Publication - Advice and guidance
Biodiversity Programme Advisory Group - target indicator: recommendations
The Biodiversity Programme Advisory Group (PAG) has provided expert recommendations to inform statutory nature restoration targets under Scotland’s proposed Natural Environment Bill, a key component of the strategic framework for biodiversity in Scotland.
Annex 3
Results of pre-workshop questionnaire
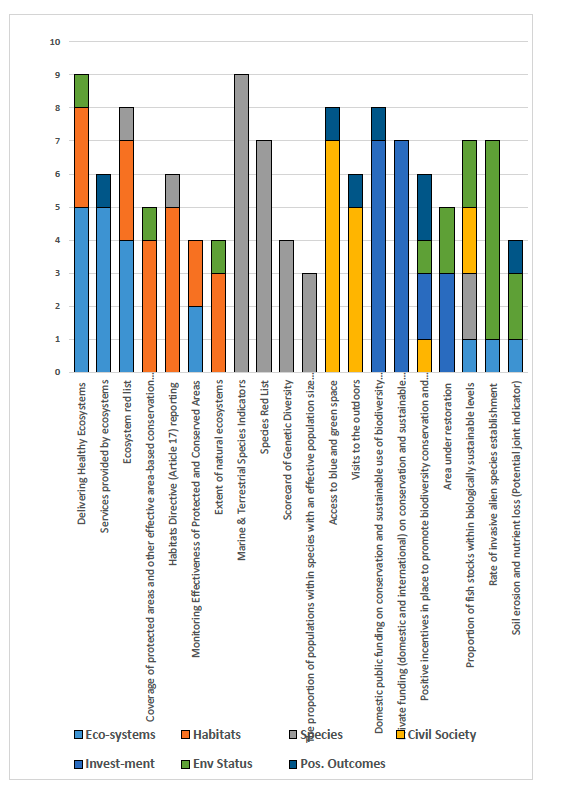
- Results are summarised in Table 1, 2 3 and in Figure 1.
Overarching Points for indicators
- Need to consider indicators as a whole as many cut across target topics and when used in combination this may strengthen their value.
- Existing indicators often a poor fit to topics (e.g. to measure ecosystem health/integrity) but some appear better suited/more directly relevant.
- Marine under represented/Some indicators (e.g. habitat related indicators) not well suited to marine and protection should relate to removal of pressure (account for condition etc.)
- Some topics need more emphasis on outcomes (topics 4-7)
1. Ecosystem Integrity
- Ecosystem red list includes extent/condition, widely understood, stronger combined with delivering healthy ecosystems and ES indicator
- Ecosystem services widely understood and captures importance of multiple tropic levels (and if they are functioning well) and (depending on services) these could be taken as metrics of system health.
- Potential to join up ES with NCAI indicator to capture socio-economic but NCAI is limited and does not deliver on ecosystem function (not high scoring).
- Ecosystem function requires more consideration - ecosystem services delivery dependent on healthy soils and sustainable use of wild species..
- Assessing ecosystem health and effectiveness of PAs more tractable in marine in addition to fish stocks indicator to ensure fish moving to good environmental status (designation not the same as protection).
- Connectivity and biodiversity intactness deserve consideration but indicators currently have limitations
Any other indicators needed for this topic?
- Further development of delivering healthy ecosystems and ecosystem services indicators needed (also applies for habitats topic)
- Use of similar approach to Good Environmental Status (for Marine) - msfd.eu (11 descriptors with defined indicators)
- Area under protection in marine is 37% but effective area under management - where pressure causing activity has been stopped - is nearer 4.8%. Need to report on where pressure has been removed, not area designated.
- A wider soil health indicator (physical, biological, chemical)
2. Habitat Condition and Extent
- Indicators should combined extent and status
- Ecosystem red list and habitat directive indicators widely applied and understood (clear) but red list covers wide range of habitats needs prioritising.
- Delivering healthy ecosystems indicator (also for ecosystems) requires work for application across Scotland (assessing condition out with PAs key).
- Several habitat monitoring systems but difficult to rank their value and some terminology needs clarified (habitats of importance, ‘natural’ ecosystems)
- SLAM map would build in remote sensing as a priority (will become more powerful, and cost-effective through time, but requires a baseline).
Any other indicators needed for this topic?
- A high resolution 3D map of Scotland's habitat extent and condition that identifies specifically for peatlands, semi-natural forests and more broadly for 3D vegetation structural diversity (Lidar). Results may challenge change detection and agile management and provide a national solution allowing accurate change detection, a reduced need to interpret the lidar data compared to satellite images, and could generate metrics of vegetation structural diversity at varied scales to support nature monitoring.
- Marine aspects - % area by broad scale habitat (marine) that is in good environmental status (GES) and % area and condition of Vulnerable marine ecosystems (VMEs) protected
- Inclusion of eDNA biomonitoring strategically in assessments of habitat condition should be developed (cheaper and easier through time, but will need a baseline).
3. Threatened Species Status
- None perfect but consensus around species indicators (less overlap to other topics) – Species Red List (widely applied) but species in Uk may be of low concern on global red list despite declines.
- Marine/terrestrial indicators now stronger and includes marine but less clear if they specifically identifies threatened species .
- Important to include a genetic element but currently limited set of species, need to innovate an eDNA approach for species and genetic diversity.
- Should include population size/viability e.g. fish stocks indicator (but commercial sp. - include wider species) and population viability indicator
Any other indicators needed for this topic?
- Status of eDNA across Scottish habitats; based on sampling across seas, lochs, rivers, and terrestrial habitat to log the most complete genetic mapping and its changes. eDNA allows an efficient and comprehensive approach to sampling. It captures species and genetic diversity.
- Wider fished species, as reported under OSPAR, needs to come in. Current indicators too focussed on commercial and red list
4. Civil Society Understanding, Benefitting from and Contributing to Nature
- Limited options for this topic and global impacts indicator does not fit topic and indicators selected are relevant but generally not a great fit.
- Access and use of green/blue space seem most relevant for most, could also consider public use/involvement.
Any other indicators needed for this topic?
- Skills - A new metric that shows skills requirement and capacity of society for meeting climate/nature crises (and environmental education and training)
- Business sustainability e.g. number of B Corps registered in Scotland."
- An indictor(s) that assesses the general public's a) knowledge of and b) engagement with biodiversity in their everyday life.
- Spatial proximity to blue and green space using SLAM/ES indicators
- Outdoor learning indicator, given importance to wider educational attainment and quality of life
- Indicators on people-oriented measures - Social attitude surveys would fit
5. Investment in Nature
- Current indicators limited but can help identify progress and important to assess public commitments over time/show the public what is being done.
- Some combination of the three funding indicators (international, domestic and public) should assess this topic (private funding less straightforward)
- Active funding in marine restoration a useful indicator.
Any other indicators needed for this topic?
- Indicator(s) that specifically measure contribution from different government sectors, including agriculture, forestry and transport.
- Area under restoration should be prioritised to allow consideration/comparison with habitat extent/condition and integrity/health indicators.
6. Enhancing Environmental Status for Nature
- Some consensus around INNS but may require several indicators.
- Overlap with ecosystem health indicator which should include soils and nutrient run off meaning not needed here.
- Include freshwater, coastal and marine – indicative of wider pressures (agriculture, fish farming, forestry etc.)
- Greatest actor for change in marine ecosystem is passive restoration - i.e. removing pressure. Active restoration is vanishingly small in comparison and likely to be in very coastal areas i.e. tracking real reductions in pressure.
Any other indicators needed for this topic?
- We need a new set of indicators that focus on: a) the whole water environment. River Basin Plans, SEPA monitoring of rivers and large lochs, inadequate and misses majority of 'wetlands' (RAMSAR definition), especially small scale and upland areas. b) the impact of agriculture and forestry
- % of pressure removed, not under MPA
- A more complete measure of soil health (physical, biological, chemical)
7. Positive Outcomes for Biodiversity in Public Sector and Government Policy
- Options very limited for this topic and requires outcome indicators, not just output e.g. soil erosion and nutrient loss will reflect what is being achieved in agriculture/forestry sectors on the ground.
- Assessing incentives only effective if outcomes of incentives measured.
- NCAI relevant here could be assessed in combination with ES and can assess cross-sector delivery depending on the services assessed.
- Percentage of land and sea area covered by biodiversity-inclusive spatial plans lacks specificity (but could show if biodiversity being considered by multiple sectors)
Any other indicators needed for this topic?
- Proportion of public procurement funding using nature positive supply chains
- Indicators that can demonstrate the sectoral inputs to biodiversity conservation and associated outcomes.
- Net effect of farming, forestry, fisheries - especially commercial/productivity practices.
- Some future refinement and enhancement of the biodiversity duty report?
| Topic | Indicator | Eco-systems | Habitats | Species | Civil Society | Invest-ment | Env Status | Pos. Outcomes | Total |
|---|---|---|---|---|---|---|---|---|---|
| Ecosystems | Delivering Healthy Ecosystems | 5 | 3 | - | - | - | 1 | - | 9 |
| Ecosystems | Services provided by ecosystems | 5 | - | - | - | - | - | 1 | 6 |
| Ecosystems | Biodiversity Intactness Index | 2 | 1 | - | - | - | - | - | 3 |
| Ecosystems | Connectivity Ecosystems Health Indicator | 3 | - | - | - | - | - | - | 3 |
| Ecosystems | Natural Capital Index | 2 | - | - | - | - | - | 1 | 3 |
| Ecosystems | Soil sealing (inverse) | 1 | - | - | 1 | - | - | 1 | 3 |
| Ecosystems | Benefits from the sustainable use of wild species | 1 | - | - | 1 | - | - | - | 2 |
| Ecosystems | Index of coastal eutrophication potential | 1 | - | - | - | - | 1 | - | 2 |
| Habitats | Ecosystem red list | 4 | 3 | 1 | - | - | - | - | 8 |
| Habitats | Coverage of protected areas and other effective area-based conservation measures | - | 4 | - | - | - | 1 | - | 5 |
| Habitats | Habitats Directive (Article 17) reporting | - | 5 | 1 | - | - | - | - | 6 |
| Habitats | Monitoring Effectiveness of Protected and Conserved Areas | 2 | 2 | - | - | - | - | - | 4 |
| Habitats | Extent of natural ecosystems | - | 3 | - | - | - | 1 | - | 4 |
| Habitats | Connectivity Ecosystems Health Indicator | - | 1 | - | - | - | 1 | - | 2 |
| Habitats | SLAM map | - | 1 | - | - | - | 1 | - | 2 |
| Habitats | New: 3D vegetation structural diversity (Lidar) | - | 1 | - | - | - | - | - | 1 |
| Species | Marine & Terrestrial Species Indicators | - | - | 9 | - | - | - | - | 9 |
| Species | Species Red List | - | - | 7 | - | - | - | - | 7 |
| Species | Scorecard of Genetic Diversity | - | - | 4 | - | - | - | - | 4 |
| Species | The proportion of populations within species with an effective population size > 500 | - | - | 3 | - | - | - | - | 3 |
| Species | New 'Status of eDNA' indicator | - | - | 1 | - | - | - | - | 1 |
| Civil Society | Access to blue and green space | - | - | - | 7 | - | - | 1 | 8 |
| Civil Society | Visits to the outdoors | - | - | - | 5 | - | - | 1 | 6 |
| Civil Society | Average share of the built-up area of cities that is green/blue space for public use for all | - | - | - | 2 | - | - | 1 | 3 |
| Civil Society | Business target (see notes) | - | - | - | 1 | - | - | - | 1 |
| Civil Society | Global Biodiversity impacts of Scottish economic activity | - | - | - | 1 | - | - | - | 1 |
| Civil Society | Skills Target (see notes) | - | - | - | 1 | - | - | - | 1 |
| Investment | Domestic public funding on conservation and sustainable use of biodiversity and Ecosystems | - | - | - | - | 7 | - | 1 | 8 |
| Investment | Private funding (domestic and international) on conservation and sustainable use of biodiversity and ecosystems | - | - | - | - | 7 | - | - | 7 |
| Investment | Positive incentives in place to promote biodiversity conservation and sustainable use | - | - | - | 1 | 2 | 1 | 2 | 6 |
| Investment | Area under restoration | - | - | - | - | 3 | 2 | 5 | |
| Investment | International public funding, including official development assistance (ODA) for conservation and sustainable use of biodiversity and ecosystems | - | - | - | - | 1 | - | - | 1 |
| Env Status | Proportion of fish stocks within biologically sustainable levels | 1 | - | 2 | 2 | - | 2 | - | 7 |
| Env Status | Rate of invasive alien species establishment | 1 | - | - | - | - | 6 | - | 7 |
| Env Status | Soil erosion and nutrient loss (Potential joint indicator) | 1 | - | - | - | - | 2 | 1 | 4 |
| Env Status | Clean seas | - | - | - | - | - | 3 | - | 3 |
| Env Status | Long term river water quality | - | - | - | - | - | 4 | - | 4 |
| Env Status | Pesticide environment Concentration | - | - | - | - | - | 2 | - | 2 |
| Pos. Outcomes | Percentage of land and sea area covered by biodiversity-inclusive spatial plans | - | - | - | 1 | - | - | 2 | 3 |
| Pos. Outcomes | NEW - Public procurement | - | - | - | - | - | - | 1 | 1 |
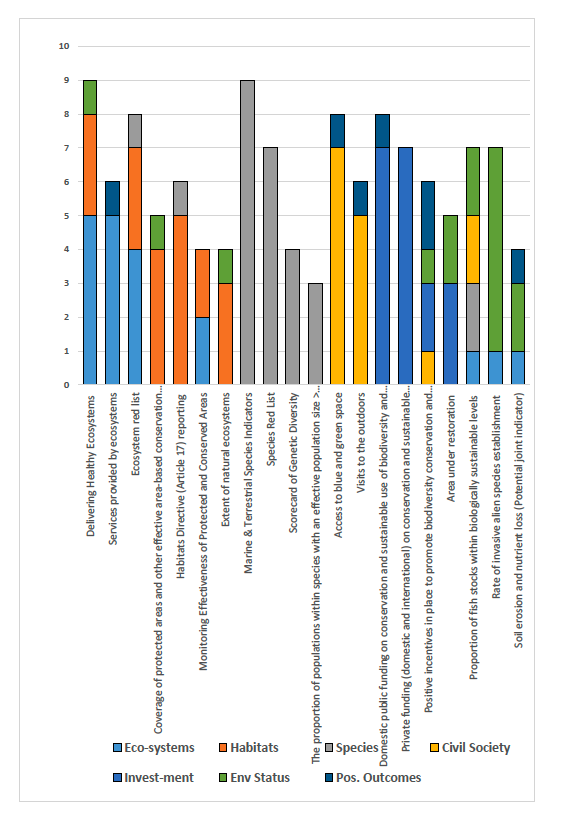
| Topic | Indicator | Eco-systems | Habitats | Species | Civil Society | Invest-ment | Env Status | Pos. Outcomes | Total |
|---|---|---|---|---|---|---|---|---|---|
| Ecosystems | Delivering Healthy Ecosystems | 5 | 3 | - | - | - | 1 | - | 9 |
| Ecosystems | Services provided by ecosystems | 5 | - | - | - | - | - | 1 | 6 |
| Habitats | Ecosystem red list | 4 | 3 | 1 | - | - | - | - | 8 |
| Habitats | Coverage of protected areas and other effective area-based conservation measures | - | 4 | - | - | - | 1 | - | 5 |
| Habitats | Habitats Directive (Article 17) reporting | - | 5 | 1 | - | - | - | - | 6 |
| Habitats | Monitoring Effectiveness of Protected and Conserved Areas | 2 | 2 | - | - | - | - | - | 4 |
| Habitats | Extent of natural ecosystems | - | 3 | - | - | - | 1 | - | 4 |
| Species | Marine & Terrestrial Species Indicators | - | - | 9 | - | - | - | - | 9 |
| Species | Species Red List | - | - | 7 | - | - | - | - | 7 |
| Species | Scorecard of Genetic Diversity | - | - | 4 | - | - | - | - | 4 |
| Species | The proportion of populations within species with an effective population size > 500 | - | - | 3 | - | - | - | - | 3 |
| Civil Society | Access to blue and green space | - | - | - | 7 | - | - | 1 | 8 |
| Civil Society | Visits to the outdoors | - | - | - | 5 | - | - | 1 | 6 |
| Investment | Domestic public funding on conservation and sustainable use of biodiversity and Ecosystems | - | - | - | - | 7 | - | 1 | 8 |
| Investment | Private funding (domestic and international) on conservation and sustainable use of biodiversity and ecosystems | - | - | - | - | 7 | - | - | 7 |
| Investment | Positive incentives in place to promote biodiversity conservation and sustainable use | - | - | - | 1 | 2 | 1 | 2 | 6 |
| Investment | Area under restoration | - | - | - | - | 3 | 2 | - | 5 |
| Env Status | Proportion of fish stocks within biologically sustainable levels | 1 | - | 2 | 2 | - | 2 | - | 7 |
| Env Status | Rate of invasive alien species establishment | 1 | - | - | - | - | 6 | - | 7 |
| Env Status | Soil erosion and nutrient loss (Potential joint indicator) | 1 | - | - | - | - | 2 | 1 | 4 |
| Outcomes | % of land/sea area covered by biodiversity-inclusive spatial plans | - | - | - | 1 | - | - | 2 | 3 |
| Topic | Indicator | Eco-systems | Habitats | Species | Civil Society | Invest-ment | Env Status | Pos. Outcomes | Total |
|---|---|---|---|---|---|---|---|---|---|
| Habitats | New: 3D vegetation structural diversity (Lidar) | - | 1 | - | - | - | - | - | 1 |
| Species | New 'Status of eDNA' indicator | - | - | 1 | - | - | - | - | 1 |
| Civil Society | Business target (see notes) | - | - | - | 1 | - | - | - | 1 |
| Civil Society | Skills Target (see notes) | - | - | - | 1 | - | - | - | 1 |
| Outcomes | NEW - Public procurement | - | - | - | - | - | - | 1 | 1 |
Contact
Email: biodiversity@gov.scot