Attainment Scotland Fund Evaluation: School Survey Report, 2025
The Report presents the findings from a school survey in relation to the Attainment Scotland Fund undertaken in spring 2025. The survey explored the views of a range of school-based staff on approaches, perceptions of impact of the Fund on the poverty-related attainment gap, and sustainability.
Research findings
Background understanding
The survey began by asking respondents about their understanding of the Scottish Attainment Challenge mission, and the challenges and barriers faced by children and young people affected by poverty.
Understanding of the Scottish Attainment Challenge mission
All respondents were asked about their level of understanding of the Scottish Attainment Challenge mission to use education to improve outcomes for children and young people impacted by poverty.
Levels of understanding were generally high, with 92% of respondents overall saying they have a detailed or some understanding of the mission – and 54% said they have a detailed understanding (see Table 3). There was a clear pattern in results based on role, with headteachers having the greatest understanding: 72% of headteachers said they had a detailed understanding, compared to 55% of senior/middle leaders, 22% of teachers and 18% of support/other staff.[13]
| All | Head-teachers | Senior/middle leaders | Classroom teachers | Support/ other staff | |
|---|---|---|---|---|---|
| NET: Detailed/some understanding | 92% | 98% | 95% | 85% | 69% |
| Detailed understanding of the SAC mission | 54% | 72% | 55% | 22% | 18% |
| Some understanding of the SAC mission | 38% | 25% | 40% | 63% | 52% |
| Heard of SAC mission, but don’t know much about it | 6% | 2% | 5% | 11% | 20% |
| Not familiar with SAC mission at all | 2% | - | - | 4% | 9% |
| Don’t know/not sure | <1% | - | - | - | 2% |
| Base (all) | 974 | 487 | 209 | 158 | 120 |
Respondents from schools in the most deprived areas had the greatest levels of reported understanding of the Scottish Attainment Challenge mission: 97% most deprived[14] versus 88% least deprived[15] had a detailed/some understanding (and the equivalent figures were 63% v 47% for detailed understanding). Those from schools in small towns/rural areas were less likely than others to say they had a detailed understanding (44%, compared to 62% in large urban areas and 57% in other urban areas). These findings are likely to be linked, since respondents in urban areas were more likely to be based in schools with higher levels of deprivation, while respondents in small towns/rural areas tended to have fewer pupils living in deprived areas.
Understanding of challenges and barriers for pupils affected by poverty
Reported levels of understanding of the challenges and barriers faced by pupils affected by poverty were high: seven in ten (72%) said they understood these challenges/barriers to a great extent and a further 22% to a moderate extent (see Table 4). Headteachers and senior/middle leaders were most likely to say they understood this to a great extent (82% and 76% respectively, compared to 54% among classroom teachers and 49% among support/other staff).
| All | Head-teachers | Senior/middle leaders | Classroom teachers | Support/ other staff | |
|---|---|---|---|---|---|
| NET: Great/moderate extent | 94% | 98% | 97% | 90% | 79% |
| To a great extent | 72% | 82% | 76% | 54% | 49% |
| To a moderate extent | 22% | 17% | 21% | 35% | 30% |
| To some extent | 5% | 2% | 3% | 9% | 18% |
| Not very well | <1% | - | - | - | 2% |
| Not at all | <1% | - | - | - | 1% |
| Don’t know/not sure | <1% | - | - | 1% | - |
| Base (all) | 974 | 487 | 209 | 158 | 120 |
Understanding of challenges and barriers was greater among respondents from schools with the highest proportions of pupils living in deprived areas – for example, 84% in the most deprived areas said they understood this to a great extent, compared to 64% in the least deprived areas. Understanding was also greater among those in large urban areas (77% to a great extent v 67% among those from small towns/rural areas) – again this is likely to reflect the higher proportions of pupils living in deprived areas in large urban schools.
Changes in understanding over the course of the Scottish Attainment Challenge
There was clear evidence of increased understanding about the challenges faced by pupils affected by poverty over the course of the Scottish Attainment Challenge (i.e. since 2015) – over eight in ten respondents overall said their understanding has increased (see Table 5). Reported understanding had increased particularly among headteachers (85%) and senior/middle leaders (87%) compared to classroom teachers (72%) and support/other staff (74%).
| All | Head-teachers | Senior/middle leaders | Classroom teachers | Support/ other staff | |
|---|---|---|---|---|---|
| Increased | 82% | 85% | 87% | 72% | 74% |
| Remained the same | 15% | 13% | 13% | 23% | 16% |
| Decreased | 1% | 1% | - | 1% | - |
| Don’t know/not sure | 2% | 1% | - | 4% | 10% |
| Base (all) | 974 | 487 | 209 | 158 | 120 |
Results were broadly consistent across the sample for this question, although respondents from schools in the least deprived areas were less likely than others to say their understanding had increased (this was still high at 77% but was 87% among those in the most deprived areas).
Implementation and use of ASF
This section focuses on respondents’ experiences in developing their approach, what types of approaches and initiatives the ASF has funded, and professional learning undertaken in this area.
Funding streams
Headteachers were asked to confirm what funding streams had been used to support work in their school: almost all mentioned Pupil Equity Funding (PEF), and around a fifth mentioned Strategic Equity Funding (SEF) and/or Care Experienced Children and Young People (CECYP) Funding – see Table 6.
| % | |
|---|---|
| Pupil Equity Funding (PEF) | 99% |
| Strategic Equity Funding (SEF) | 22% |
| Care Experienced Children and Young People (CECYP) Funding | 19% |
| Don’t know/not sure | 1% |
| Base (all headteachers) | 487 |
Development of approaches
Headteachers, and those with a lead role in relation to PEF/closing the poverty-related attainment gap, were asked how their school’s approaches to closing the gap were developed. As shown in Table 7, respondents were most likely to mention the use of local guidance (85%), national operational guidance (84%) and approaches being developed by teachers within the school (83%). Input from parents/communities (79%), and/or children and young people (72%) were also commonly mentioned, as was advice from local authorities (76%).
| % | |
|---|---|
| Using local guidance (e.g. guidance developed by local authorities) | 85% |
| With reference to national operational guidance (Scottish Government) | 84% |
| By teachers within the school | 83% |
| With input from parents and communities | 79% |
| With advice from local authority | 76% |
| With input from children and young people | 72% |
| Through discussion/collaboration with other schools (other teachers, headteachers) | 68% |
| In discussion/partnership with Attainment Advisors | 57% |
| With advice from central sources e.g. Scottish Government, Education Scotland | 46% |
| Other | 3% |
| Not applicable – no approaches were developed | <1% |
| Don’t know/can’t remember | 1% |
| Base (all heads and lead roles) | 536 |
Results were broadly consistent by school type in terms of how approaches were developed. However, respondents from schools in the most deprived areas were more likely to mention several of these elements than those in the least deprived areas – including development of approaches by teachers in the school (89% v 80%), in discussion with other schools (80% v 64%), with input from children and young people (86% v 64%) and with input from parents/communities (88% v 73%). Those from schools in small towns/rural areas were less likely than others to mention discussion/collaboration with other schools (58% v 78% of those from large urban and 74% other urban areas), input from parents/communities (70%, v 84%/85% respectively) and input from children and young people (61% v 81%/79%).
How ASF funding has been used
Headteachers and those with a lead role were asked how the ASF has been used, and a wide range of approaches were implemented (see Table 8). The vast majority (91%) mentioned learning and teaching approaches – most likely in relation to literacy (89%) but a majority also mentioned numeracy (81%). There was also a clear focus on wellbeing and nurture: pupil wellbeing initiatives were mentioned by 85%, and nurture-based interventions/approaches by 71%. Around seven in ten mentioned universal approaches to supporting attainment among all pupils (69%) and two thirds used ASF funding to address financial barriers/cost of the school day issues (66%). At least half mentioned family support/wellbeing initiatives (54%) and/or ASN approaches (53%).
| % | |
|---|---|
| NET: Any Learning and Teaching approaches | 91% |
| Learning and Teaching approaches – literacy | 89% |
| Learning and Teaching approaches – numeracy | 81% |
| Pupil wellbeing initiatives | 85% |
| Nurture based interventions/approaches | 71% |
| Universal approaches to support attainment of all pupils | 69% |
| Cost of the school day/addressing financial barriers to learning | 66% |
| Family support and wellbeing initiatives | 54% |
| ASN approaches | 53% |
| Outdoor learning approaches | 49% |
| Pupil attendance initiatives | 48% |
| Wider achievement focus/initiatives/offers | 46% |
| Improvements to using data for tracking and monitoring | 38% |
| Transition initiatives | 29% |
| Alternative provision | 19% |
| Positive destinations initiatives | 11% |
| Other | 3% |
| Not applicable – have not used ASF funding | 1% |
| Don’t know/not sure | <1% |
| Base (all heads and lead roles) | 536 |
Respondents from primary schools were more likely than those from secondaries to mention learning and teaching approaches focused on literacy (91% v 83%). Conversely, those from secondaries were more likely to mention pupil attendance initiatives (81% v 41%), cost of the school day initiatives (78% v 63%), family support/wellbeing initiatives (65% v 51%), wider achievements (61% v 42%), transition initiatives (49% v 25%), improvements to using data for tracking/ monitoring (49% v 35%), alternative provision (47% v 13%) and positive destinations (44% v 3%).
There was also a clear pattern in results based on levels of deprivation: respondents from schools in the most deprived areas were more likely than those in the least deprived areas to cite each of the approaches listed, with the exception of learning and teaching focusing on numeracy and ASN approaches. The biggest differences between respondents from schools with the highest and lowest proportion of pupils from deprived areas were for initiatives related to: family support/wellbeing (81% v 35%), pupil attendance (63% v 31%), cost of the school day/addressing financial barriers (82% v 53%), pupil wellbeing (99% v 77%), and outdoor learning (62% v 41%).
A similar pattern was seen based on urban/rural classification, with those in small towns/rural areas being least likely to mention several of these approaches compared to respondents from urban areas – again this could reflect the differing SIMD profile of schools in these areas.
Professional learning
All respondents were asked if they had taken part in any professional learning in relation to the poverty-related attainment gap, and most had taken part in at least some (only 5% said they had not done any professional learning in this area – see Table 9). The pattern of responses was very similar to the kind of approaches that had previously been mentioned, with learning and teaching approaches mentioned by three in five (61%), and a focus on nurture approaches (57%) and pupil wellbeing initiatives (56%) also commonly reported.
Senior/middle leaders were more likely than all other groups to mention universal approaches to support attainment (63%), ASN approaches (59%), and improvements to the use of data for tracking/monitoring (62%). Support/other staff were less likely than those in other roles to have undertaken most of the types of professional learning listed.
| All | Head-teachers | Senior/middle leaders | Classroom teachers | Support/ other staff | |
|---|---|---|---|---|---|
| NET: Any Learning and Teaching approaches | 61% | 65% | 59% | 64% | 42% |
| Learning and Teaching approaches – literacy | 56% | 62% | 51% | 58% | 39% |
| Learning and Teaching approaches – numeracy | 50% | 54% | 51% | 50% | 30% |
| Nurture based interventions/approaches | 57% | 58% | 61% | 53% | 53% |
| Pupil wellbeing initiatives | 56% | 61% | 58% | 49% | 44% |
| Universal approaches to support attainment of all pupils | 49% | 50% | 63% | 40% | 34% |
| Cost of the school day/addressing financial barriers to learning | 49% | 54% | 61% | 34% | 31% |
| ASN approaches | 48% | 44% | 59% | 46% | 46% |
| Improvements to using data for tracking and monitoring | 48% | 48% | 62% | 43% | 28% |
| Pupil attendance initiatives | 45% | 56% | 48% | 20% | 31% |
| Family support and wellbeing initiatives | 36% | 39% | 45% | 19% | 28% |
| Outdoor learning approaches | 33% | 30% | 33% | 45% | 28% |
| Wider achievement focus/initiatives/offers | 24% | 19% | 35% | 23% | 28% |
| Transition initiatives | 21% | 15% | 33% | 17% | 31% |
| Positive destinations initiatives | 11% | 8% | 17% | 7% | 17% |
| Alternative provision | 11% | 9% | 18% | 5% | 19% |
| Other | 2% | 1% | 4% | 1% | 3% |
| Not applicable – have not done any professional learning in this area | 5% | 2% | 3% | 6% | 13% |
| Don’t know/not sure | 2% | 1% | 1% | 4% | 6% |
| Base (all) | 974 | 487 | 209 | 158 | 120 |
Respondents based in primary schools were more likely than those in secondaries to mention professional learning in relation to any learning and teaching approaches (66% v 44%), outdoor learning (37% v 19%) and ASN approaches (49% v 41%). Staff based in secondary schools were more likely to mention professional learning around pupil attendance (56% v 43%), cost of the school day (58% v 47%), wider achievement (35% v 21%), positive destinations (32% v 3%), transitions (30% v 19%) and alternative provision (22% v 7%).
Reflecting previous findings, respondents from schools with the lowest proportion of pupils living in deprived areas, and those working in small towns/rural schools, were less likely than others to have undertaken professional learning in most of these areas.
Focus on readiness to learn
All respondents were asked the extent to which a focus on readiness to learn has featured in their school’s approach to improving the educational outcomes of children and young people affected by poverty. As shown in Table 10, readiness to learn has been a key focus for most – 84% overall said this was a feature of their approach to a great/moderate extent; two thirds said this was to a great extent (66%).
| All | Head-teachers | Senior/middle leaders | Classroom teachers | Support/ other staff | |
|---|---|---|---|---|---|
| NET: Great/moderate extent | 84% | 85% | 89% | 77% | 84% |
| To a great extent | 66% | 67% | 71% | 59% | 59% |
| To a moderate extent | 19% | 18% | 17% | 17% | 25% |
| To some extent | 12% | 12% | 10% | 16% | 8% |
| Not very much | 2% | 2% | 1% | 4% | 3% |
| Not at all | 1% | 1% | - | 1% | - |
| Don’t know/not sure | 1% | - | <1% | 3% | 5% |
| Base (all) | 974 | 487 | 209 | 158 | 120 |
Responses about the focus on readiness to learn were broadly consistent by respondent role and school type, although this was more likely to be a focus to a great extent among respondents from schools with the most pupils living in deprived areas (74% most deprived v 55% least deprived) and in urban areas (70% v 58% small towns/rural areas – again this is likely to reflect the SIMD profile of schools by urban/rural classification).
Addressing the needs of children and young people who have experienced care
The survey asked which approaches, if any, had been used to address the specific needs of children and young people who have experienced care. As detailed in Figure 1, the key focus was on wellbeing initiatives, mentioned by two thirds of respondents (65%). Around two in five mentioned wider achievements/qualifications (42%), attendance initiatives (41%) and/or outdoor learning (39%), while a quarter mentioned mentoring (24%) and just over a fifth mentioned engagement/support from a Virtual School Head Teacher (22%).
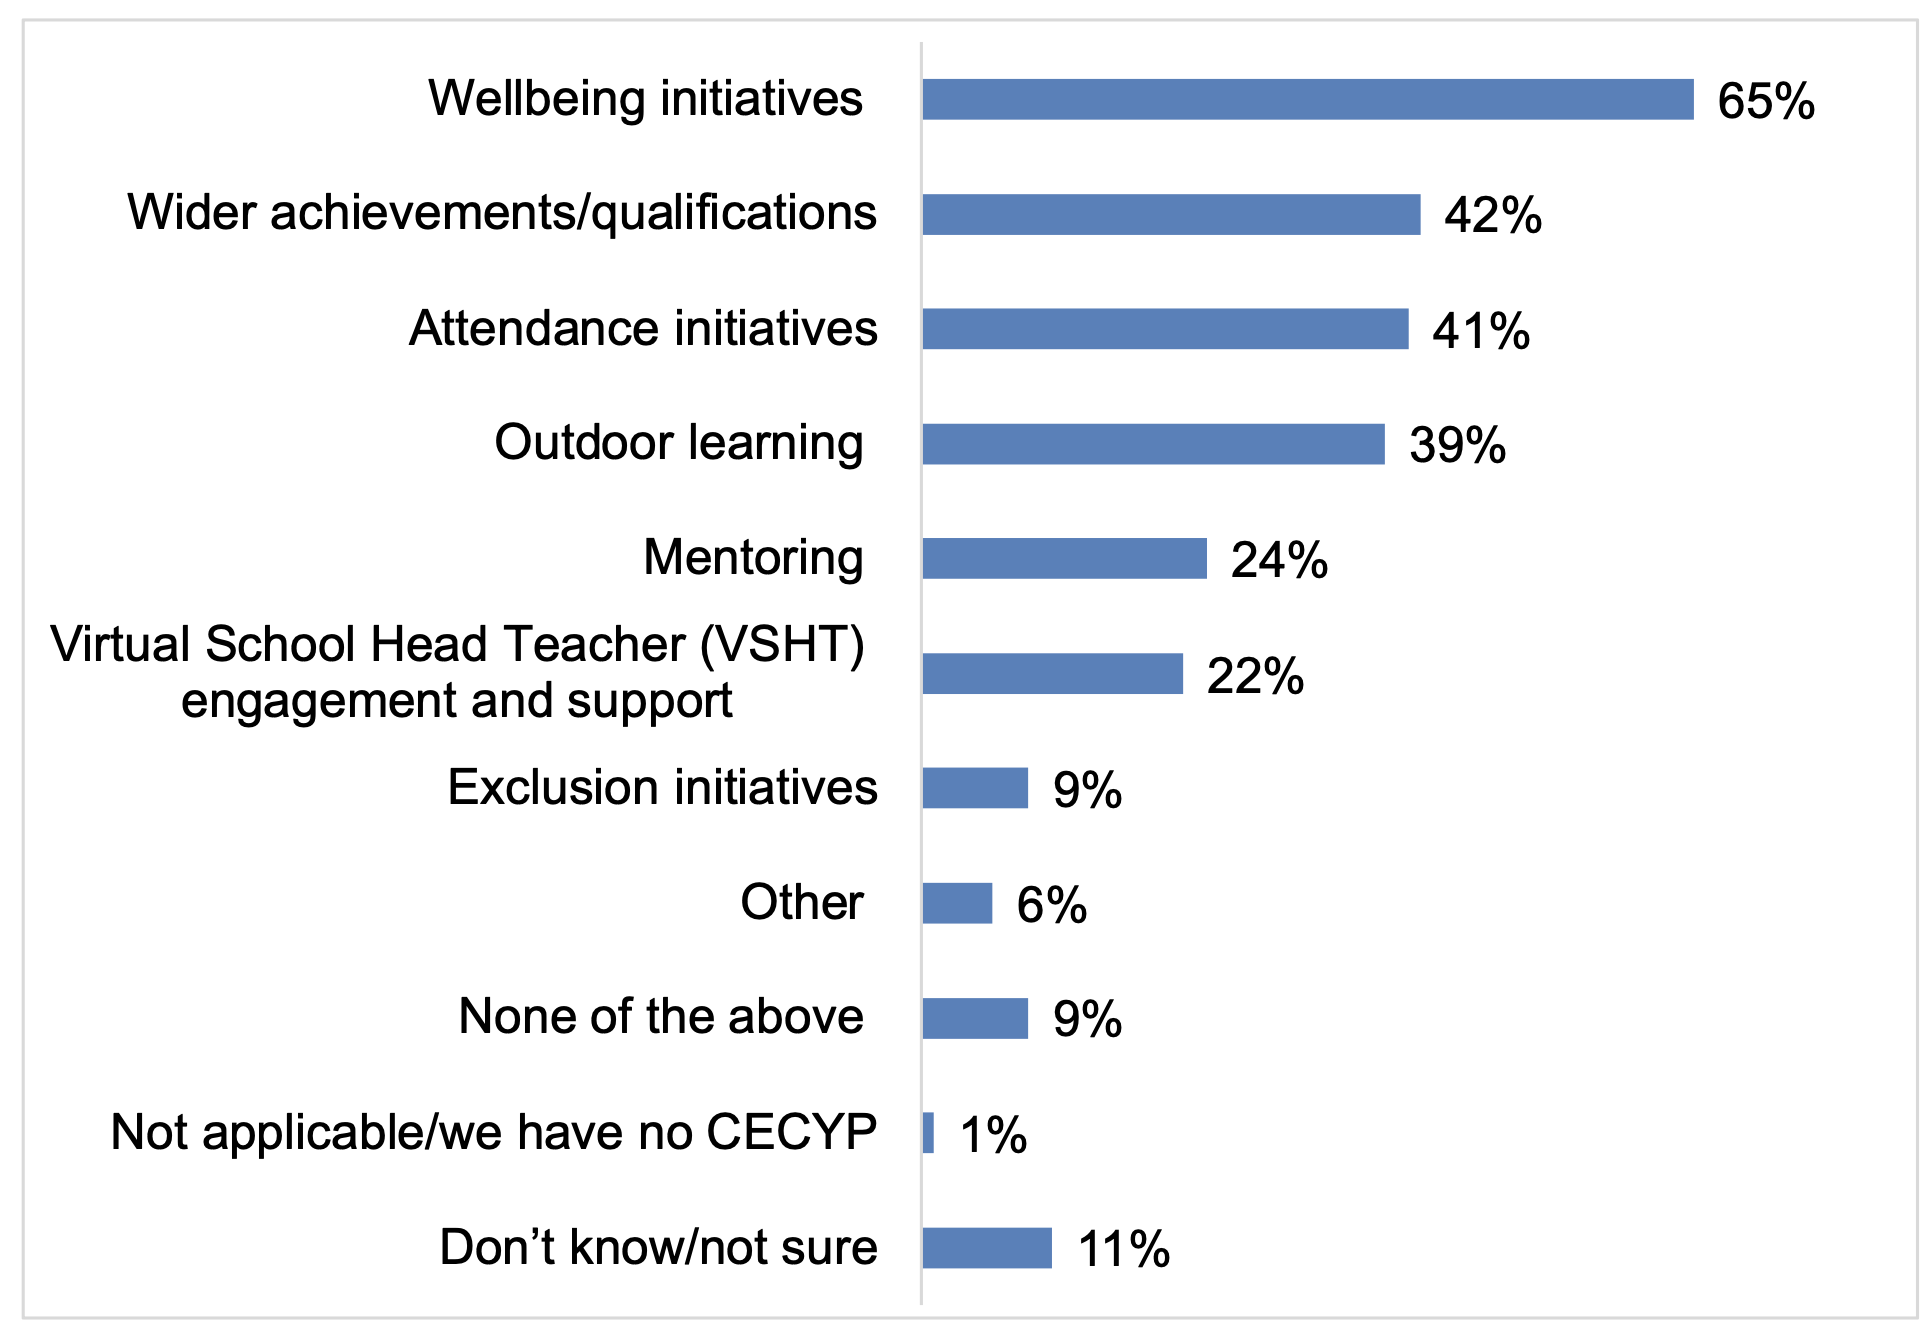
Base (all): 974
Respondents from secondary schools were more likely than those from primaries to mention any of the approaches to supporting CECYP, while those from primaries were more likely to say ‘none of the above’ (12% v nobody from a secondary).
Respondents from schools in the most deprived areas were more likely to mention most of these approaches than those in the least deprived areas. The biggest differences were seen in relation to use of a Virtual Headteacher (36% v 16%), attendance initiatives (50% v 30%) and wellbeing initiatives (77% v 58%). A similar pattern was seen in the analysis by urban/rural classification, reflecting the differing profiles of schools in these areas – e.g. 17% of those from small town/rural schools said they had used none of these approaches, compared to 4% from large urban and 5% from other urban areas.
Engagement with families and children and young people
The survey asked a series of questions in relation to whether and how schools had engaged children and young people and families in decision-making about how to close the poverty-related attainment gap.
Extent of engagement with families and children and young people
First, respondents were asked the extent to which engagement with these groups in decision-making has been part of their school’s approach to achieving equity in education. As shown in Figure 2, there were relatively high levels of reported engagement: two thirds overall said they had engaged with children and young people to a great or moderate extent (38% to a great extent; a further 28% to a moderate extent) and three fifths said that families and communities had been engaged to a great (26%) or moderate (36%) extent.
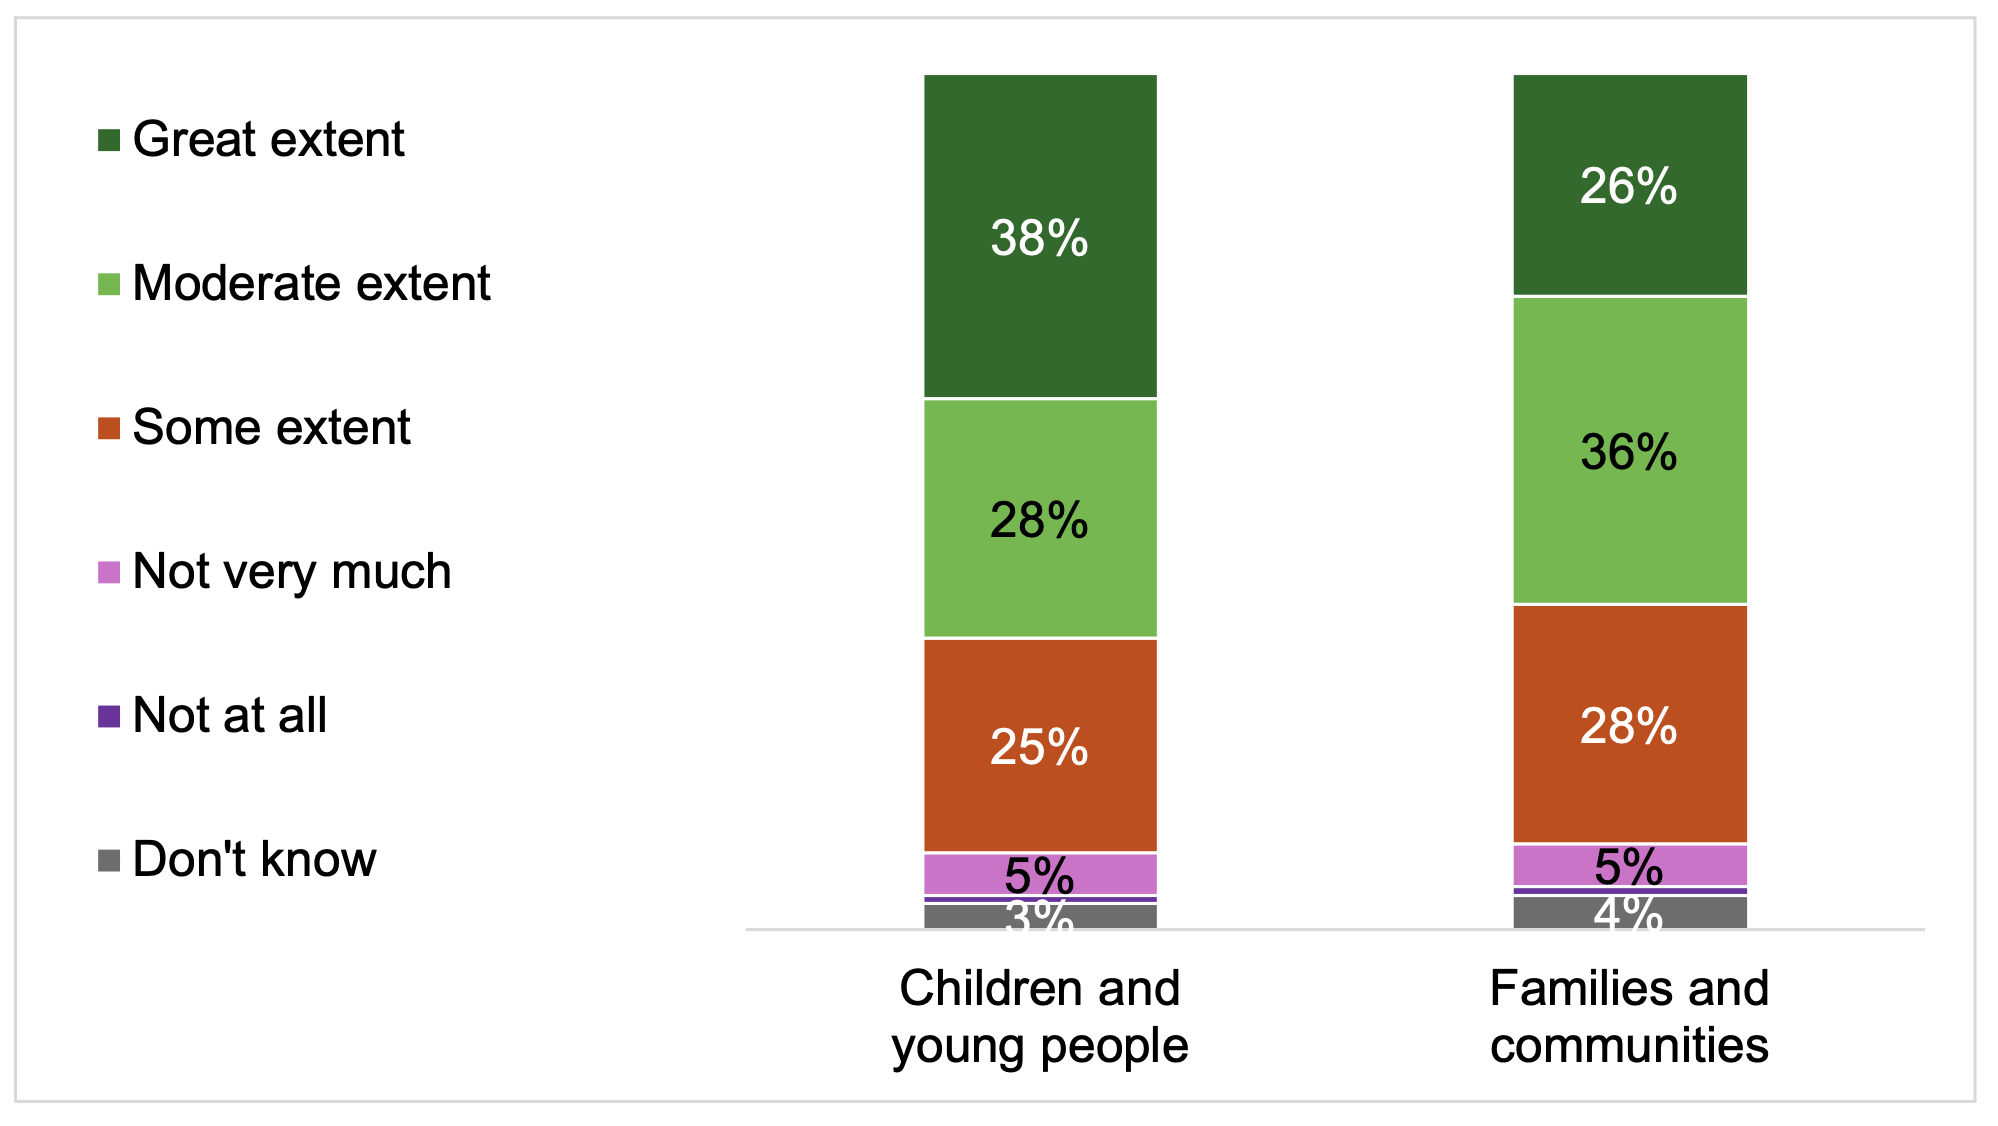
Base (all): 974
Interestingly, headteachers were less likely than those in other roles to say their schools had engaged with children and young people and/or families/communities – e.g. 55% of headteachers said this had happened to a great/moderate extent in relation to children and young people, compared to 80% of senior/middle leaders, 79% of classroom teachers and 70% of support staff/other roles. It is possible that the majority of this engagement may be undertaken by other staff within schools.
Reported involvement of children and young people was consistent by school type, but was greatest among schools with the highest proportion of pupils in deprived quintiles (43% in the most deprived areas said this had happened to a great extent, compared to 32% in the least deprived areas), and in urban areas (45% large urban and 41% other urban v 30% small towns/rural areas). A similar pattern was seen for the involvement of families and communities in decision-making.
Nature of engagement with families and children and young people
Those who said their school had engaged with either children and young people or families/communities in decision-making to at least some extent were asked to describe how they did this. The main themes to emerge in response to this question are outlined in Table 11. Respondents were most likely to highlight the use of surveys (45%), pupil groups such as pupil councils etc. (43%), and/or formal parent groups/committees (40%).
| % | |
|---|---|
| Consultation through parent/pupil surveys | 45% |
| Pupil groups/pupil council/assemblies/discussions | 43% |
| Formal parent/carers committees/groups/councils | 40% |
| Communication about planning/spending/budget/goals | 28% |
| Ad hoc meetings (e.g. focus groups, other discussions) | 24% |
| Communication about specific issues/problems/finding solutions | 23% |
| Parent/carer visits/drop-in sessions at school | 21% |
| Communication in general (non-specific/no detail) | 15% |
| One-to-one communication with parents and pupils | 14% |
| Mentions of newsletters/updates/communication methods to inform families | 11% |
| Base (all who had engaged and provided a comment) | 762 |
Impacts of engaging children and young people in decision-making
Respondents who had mentioned their school engaged with children and young people in decision-making were also asked about the impact this had and what difference it made. The main themes are outlined in Table 12 – by far the most common response was that this gave pupils a sense of ownership/involvement (mentioned by 63%). Around a quarter gave a comment falling under the main theme of priorities being able to reflect what is wanted/needed by engaging children and young people in decision-making, and just over one in ten mentioned improvements in attendance, learning or skills.
| % | |
|---|---|
| NET: Improved pupil wellbeing/attitudes/engagement | 79% |
| Sense of ownership/involvement/being listened to/making decisions | 63% |
| Improved motivation/engagement/attitude | 29% |
| Improved confidence/self-esteem | 15% |
| Improved communication and understanding of others/decisions | 9% |
| Sense of community/teamwork/trust | 7% |
| NET: Priorities reflect what is needed/wanted | 26% |
| Changed priorities better reflect what's needed | 12% |
| We understand their needs/wants better | 8% |
| Activities or events that are (more) what pupils want | 7% |
| Specific individual needs were met/support provided | 3% |
| NET: Improved pupil attendance/learning/skills | 13% |
| Improved learning/attainment | 8% |
| Gained decision-making skills | 5% |
| Improved attendance | 2% |
| Base (all who had engaged pupils and provided a comment) | 598 |
Use of data and evidence
This section summarises survey findings on the use of data and evidence in relation to ASF-supported approaches to closing the poverty-related attainment gap.
Ratings of use of data/evidence
Respondents were asked to rate their school’s approach to data and evidence on a scale of very good to very poor. As outlined in Figure 3, ratings were highest for monitoring progress on pupil attendance (89% rated this as very/quite good; 55% as very good) and using data and evidence to inform development of approaches to close the poverty-related attainment gap (87% very/quite good; 51% very good). The proportions rating the other aspects as ‘very good’ were lower – and lowest for using evidence to measure whether ASF approaches are having the desired impact (31%). However, overall ratings were still above 80% very/quite good for all statements in relation to use of data and evidence.
For all statements about the use of data and evidence, the general pattern was for headteachers and senior/middle leaders to give higher ratings than classroom teachers and support/other staff (respondents in support/other roles were most likely to say they did not know) – with the exception of data for monitoring progress on pupil attendance, where results were consistent across roles. It is possible that these findings reflect greater involvement of those in senior roles in monitoring the impact of approaches.
Very few other clear patterns were observed in responses to these questions. Respondents from primary schools tended to be more positive than those from secondaries – but this is a result of the higher proportion of headteachers and leaders in the sample from primaries compared to secondaries. When data is compared for primary vs secondary headteachers/leaders, and for teachers/other roles in primaries compared to in secondaries, few differences were seen.
However, those with the highest proportions of pupils from deprived areas in their school were more likely to rate using evidence to measure the impact of ASF approaches as being good overall (85% most deprived v 77% least deprived).
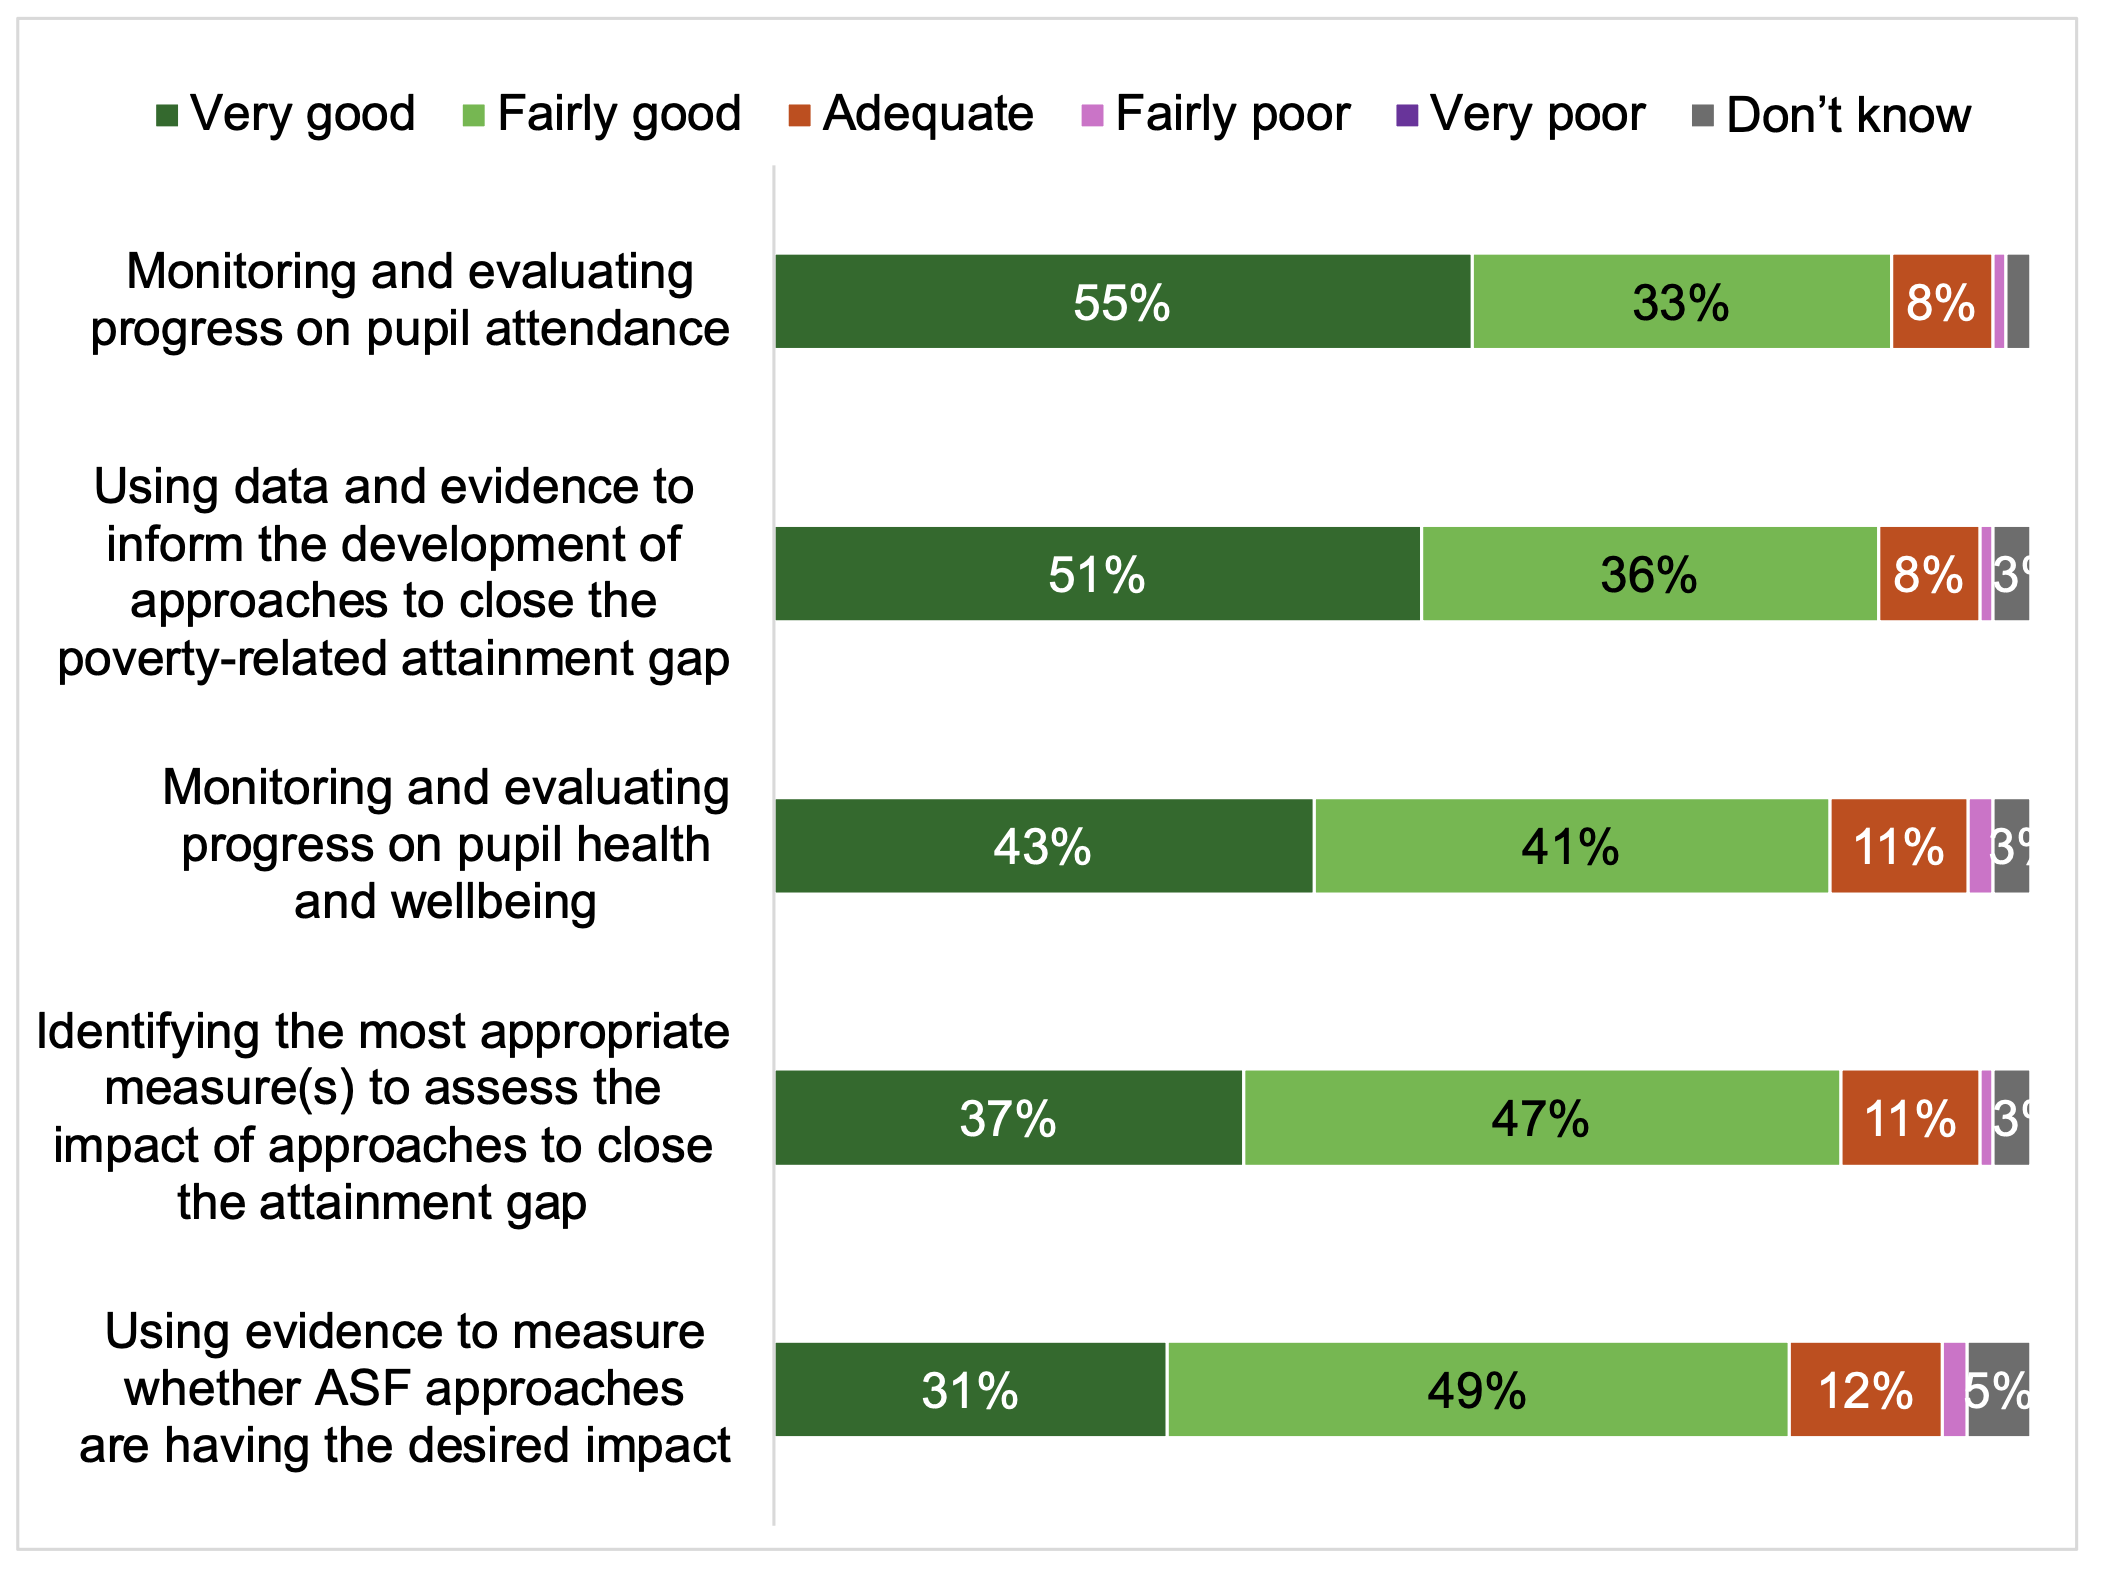
Base (all): 974
Improvements in the use of data and evidence
All respondents were asked the extent to which they agreed that there has been an improvement in the use of data and evidence since the start of the Scottish Attainment Challenge, and 84% agreed – with just over half (51%) agreeing strongly (see Table 13). Agreement was particularly high among headteachers (92%) and senior/middle leaders (89%). While agreement was lower among classroom teachers (66%) and support/other staff (67%), it is worth noting that a higher proportion among these groups said they didn’t know or weren’t sure. Very few respondents in any roles disagreed that there has been an improvement in the use of data/evidence.
| All | Head-teachers | Senior/middle leaders | Classroom teachers | Support/ other staff | |
|---|---|---|---|---|---|
| NET: Agree | 84% | 92% | 89% | 66% | 67% |
| NET: Disagree | 3% | 2% | 2% | 6% | - |
| Strongly agree | 51% | 60% | 55% | 33% | 33% |
| Agree | 33% | 32% | 34% | 33% | 34% |
| Neither agree nor disagree | 6% | 5% | 5% | 10% | 8% |
| Disagree | <1% | - | - | 2% | - |
| Strongly disagree | 2% | 2% | 2% | 4% | - |
| Don’t know/not sure | 7% | 1% | 4% | 18% | 25% |
| Base (all) | 974 | 487 | 209 | 158 | 120 |
Respondents most likely to strongly agree that there has been an improvement in the use of data and evidence included those at urban schools (55% in large urban and 56% in other urban v 42% in small towns/rural areas), and those from schools with the highest proportion of pupils living in deprived areas (57% most deprived v 43% least deprived).
Collaborative working
Respondents were asked who their school had collaborated with as a result of the ASF, and whether, as the result of ASF funding, there had been a change in staff working collaboratively in their wider school community to improve practice.
Who schools have collaborated with
As shown in Figure 4, respondents were most likely to highlight collaboration with other schools in their local authority (64%) and/or families and communities (62%). Other public sector partners such as health and social work were mentioned by around half (52%) and over two fifths mentioned third-sector organisations (44%).

Base (all): 974
Generally, headteachers and senior/middle leaders were most likely to mention collaboration with each of these partners; classroom teachers and support/other staff were more likely than senior staff to say they did not know.
Collaboration was most likely to be reported by respondents based in secondary schools for: public sector partners (62% v 49% among primary school respondents), schools outwith their LA (26% v 11%), third sector organisations (59% v 38%), universities and colleges (35% v 9%) and families/communities (67% v 59%). Generally, those working in schools in small towns/rural areas were less likely than others to report collaboration with each of these partners, as were those in the least deprived areas (the only exception was for collaboration with other schools – within or outwith their local authority – where results were consistent by SIMD).
Improvements in collaboration
Almost three fifths of respondents said there had been any improvement in collaborative working as a result of the ASF (27% said this was a large improvement; 30% said it was a small improvement). A further quarter (25%) said there had been an improvement, but it was not as a result of the Fund – very few said there had been no improvement at all (see Table 14). Senior/middle leaders were particularly positive about improvements in collaboration as a result of the ASF, being more likely than staff in any other type of role to say this (66%). Support/other staff were least likely to say this, but this was due to a high level of ‘don’t know’ responses, rather than a higher proportion reporting no improvement – and three in ten among this group still reported a large improvement (31%).
| All | Head-teachers | Senior/middle leaders | Classroom teachers | Support/ other staff | |
|---|---|---|---|---|---|
| NET: Any improvement as a result of the fund | 57% | 58% | 66% | 54% | 47% |
| Large improvement in collaborative working as a result of the fund | 27% | 25% | 31% | 25% | 31% |
| Small improvement in collaborative working as a result of the fund | 30% | 33% | 34% | 29% | 16% |
| Improvement in collaborative working, but not a result of the fund | 25% | 32% | 21% | 18% | 10% |
| No improvement in collaborative working | 4% | 4% | 3% | 7% | 2% |
| Don’t know/not sure | 14% | 6% | 11% | 22% | 42% |
| Base (all) | 974 | 487 | 209 | 158 | 120 |
Those most likely to report any improvement in collaboration due to the ASF were based in urban schools (62% large urban and 63% other urban v 49% small towns/rural areas). Those least likely to report this were the schools with the smallest proportion of pupils from deprived areas (47% of those in the least deprived areas, compared to 68% of those in the most deprived areas and 60-64% of those in between).[16] There was also a difference by school type, with respondents from secondary schools being more likely to report an improvement than those from primaries (67% v 54%) – however, when data was examined taking staff role into account, this was a result of there being more headteachers and leaders in the primary sample than the secondary sample (and these groups were more likely to report improvements). However, it is worth noting that secondary headteachers/leaders were even more positive than their primary counterparts, with 72% v 56% reporting any improvement in collaboration.
Pupil Equity Funding
Respondents who said that their school received PEF funding were asked a series of questions about this funding stream. Since 97% said they receive PEF, reflective of the proportion of schools overall who receive PEF, this is most of the sample.
Confidence in selecting approaches
Headteachers and those in a lead role related to closing the poverty-related attainment gap were asked about their level of confidence in selecting approaches to closing the poverty-related attainment gap that would be most effective in their school, taking into account local needs. As shown in Table 15, there were high levels of confidence expressed, with 98% saying they felt confident – although respondents were more likely to say they were quite (53%) than very (45%) confident.
| % | |
|---|---|
| Net: Confident | 98% |
| Very confident | 45% |
| Quite confident | 53% |
| Not very confident | 2% |
| Not at all confident | - |
| Don’t know/not sure | <1% |
| Base (all heads and lead roles in schools receiving PEF) | 601 |
Overall confidence was broadly consistent across the sample, but those least likely to say they were very confident were those from schools in small towns/rural areas (35% v 55% large urban and 48% other urban) and those in the least deprived areas (38% v 52% most deprived) – again these findings are likely to be linked due to the patterns in SIMD profile of schools in urban and rural areas.
Confidence over the course of the Scottish Attainment Challenge
The same respondents were asked how their confidence has changed over the course of the Scottish Attainment Challenge. Positively, 85% said their confidence has increased (see Table 16).
| % | |
|---|---|
| Increased | 85% |
| Remained the same | 13% |
| Decreased | 1% |
| Don’t know/not sure | 2% |
| Base (all heads and lead roles in schools receiving PEF) | 601 |
Reported confidence had increased particularly among those from schools with the highest proportion of pupils living in deprived areas: 93% of respondents from schools in the most deprived areas said this, compared to 78% in the least deprived areas.
Views of PEF
All respondents who said their school receives PEF were asked the extent to which they agreed with a series of statements about this funding stream. As shown in Figure 5, agreement was highest that headteachers have autonomy to develop a PEF plan taking their local needs into account (95% of headteachers agreed, 64% strongly), and that PEF has provided schools with additional resources needed to address the poverty-related attainment gap (90% of respondents agreed; 61% strongly). Over four in five agreed that the 4-year funding allocation has helped them plan PEF implementation (50% agreed strongly). Agreement was slightly lower that reporting requirements are reasonable: around two thirds (64%) agreed with this, but only 15% agreed strongly.
For most statements about PEF, headteachers and senior/middle leaders were better able to express an opinion – these groups were more likely to agree with each statement, but higher proportions of classroom teachers and support/other staff said they did not know, particularly in relation to reporting requirements and the 4-year funding allocation.
Views of PEF were broadly consistent across the sample, although those from schools in the least deprived areas expressed the lowest levels of overall agreement in relation to the benefits of 4-year funding and PEF providing additional resources needed by their school to address the poverty-related attainment gap. Since PEF funding is allocated based on free school meal eligibility as a measure of need, these findings may be based on these schools receiving smaller amounts of PEF.
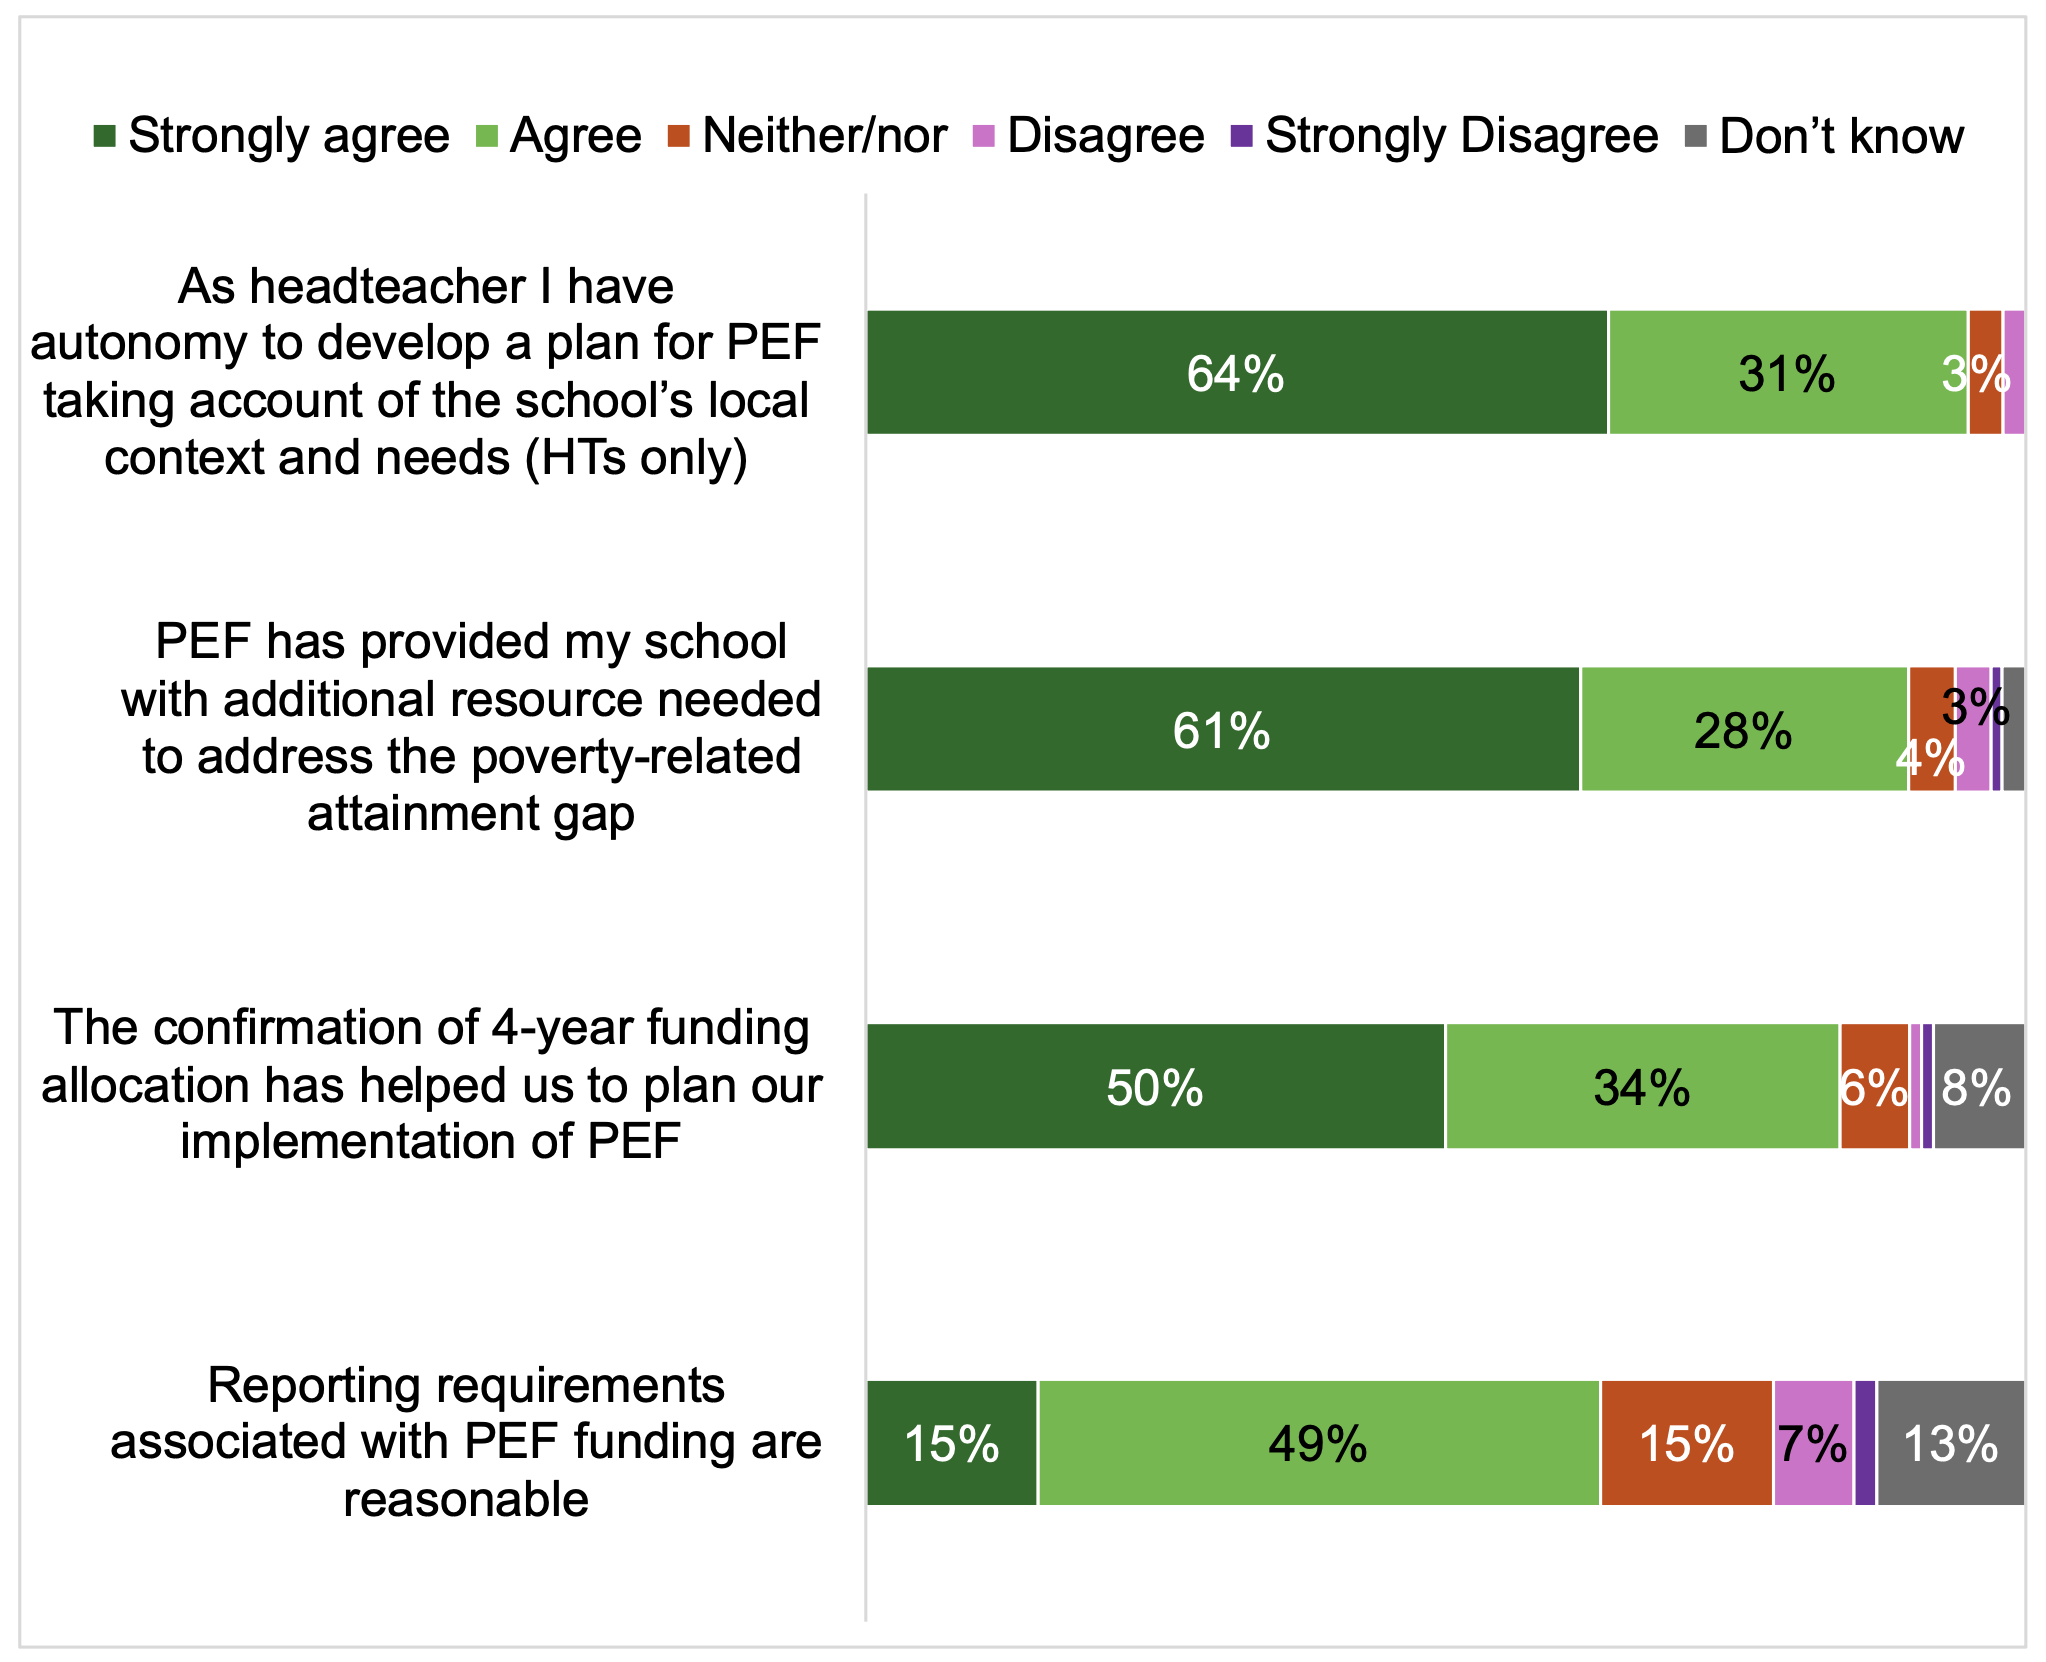
Base (all in receipt of PEF): 947, Headteachers 481
Impacts of the ASF on attainment and wellbeing
This section outlines the key findings in relation to the impacts of the ASF, with a particular focus on attainment and wellbeing among children and young people affected by poverty. Two key question areas were included: improvements for children and young people affected by poverty in literacy, numeracy and health and wellbeing as a result of the ASF; and whether the poverty-related attainment gap is closing between those from the most and least disadvantaged communities.
Impacts of the ASF on attainment and wellbeing
All respondents were asked about the extent to which they have seen improvements for children and young people affected by poverty in attainment and wellbeing as a result of the ASF. As outlined in Figure 6, a majority of respondents reported improvements to a great or moderate extent across all three aspects.
This was most commonly reported for improvements in health and wellbeing (75% said this had improved to a great/moderate extent, with 37% saying a great extent). Two thirds (65%) reported great/moderate improvement for literacy, and 61% for numeracy, although the proportions saying these had improved to a great extent were lower (25% and 22% respectively). Very few respondents reported that any of these aspects had improved not at all or not very much.
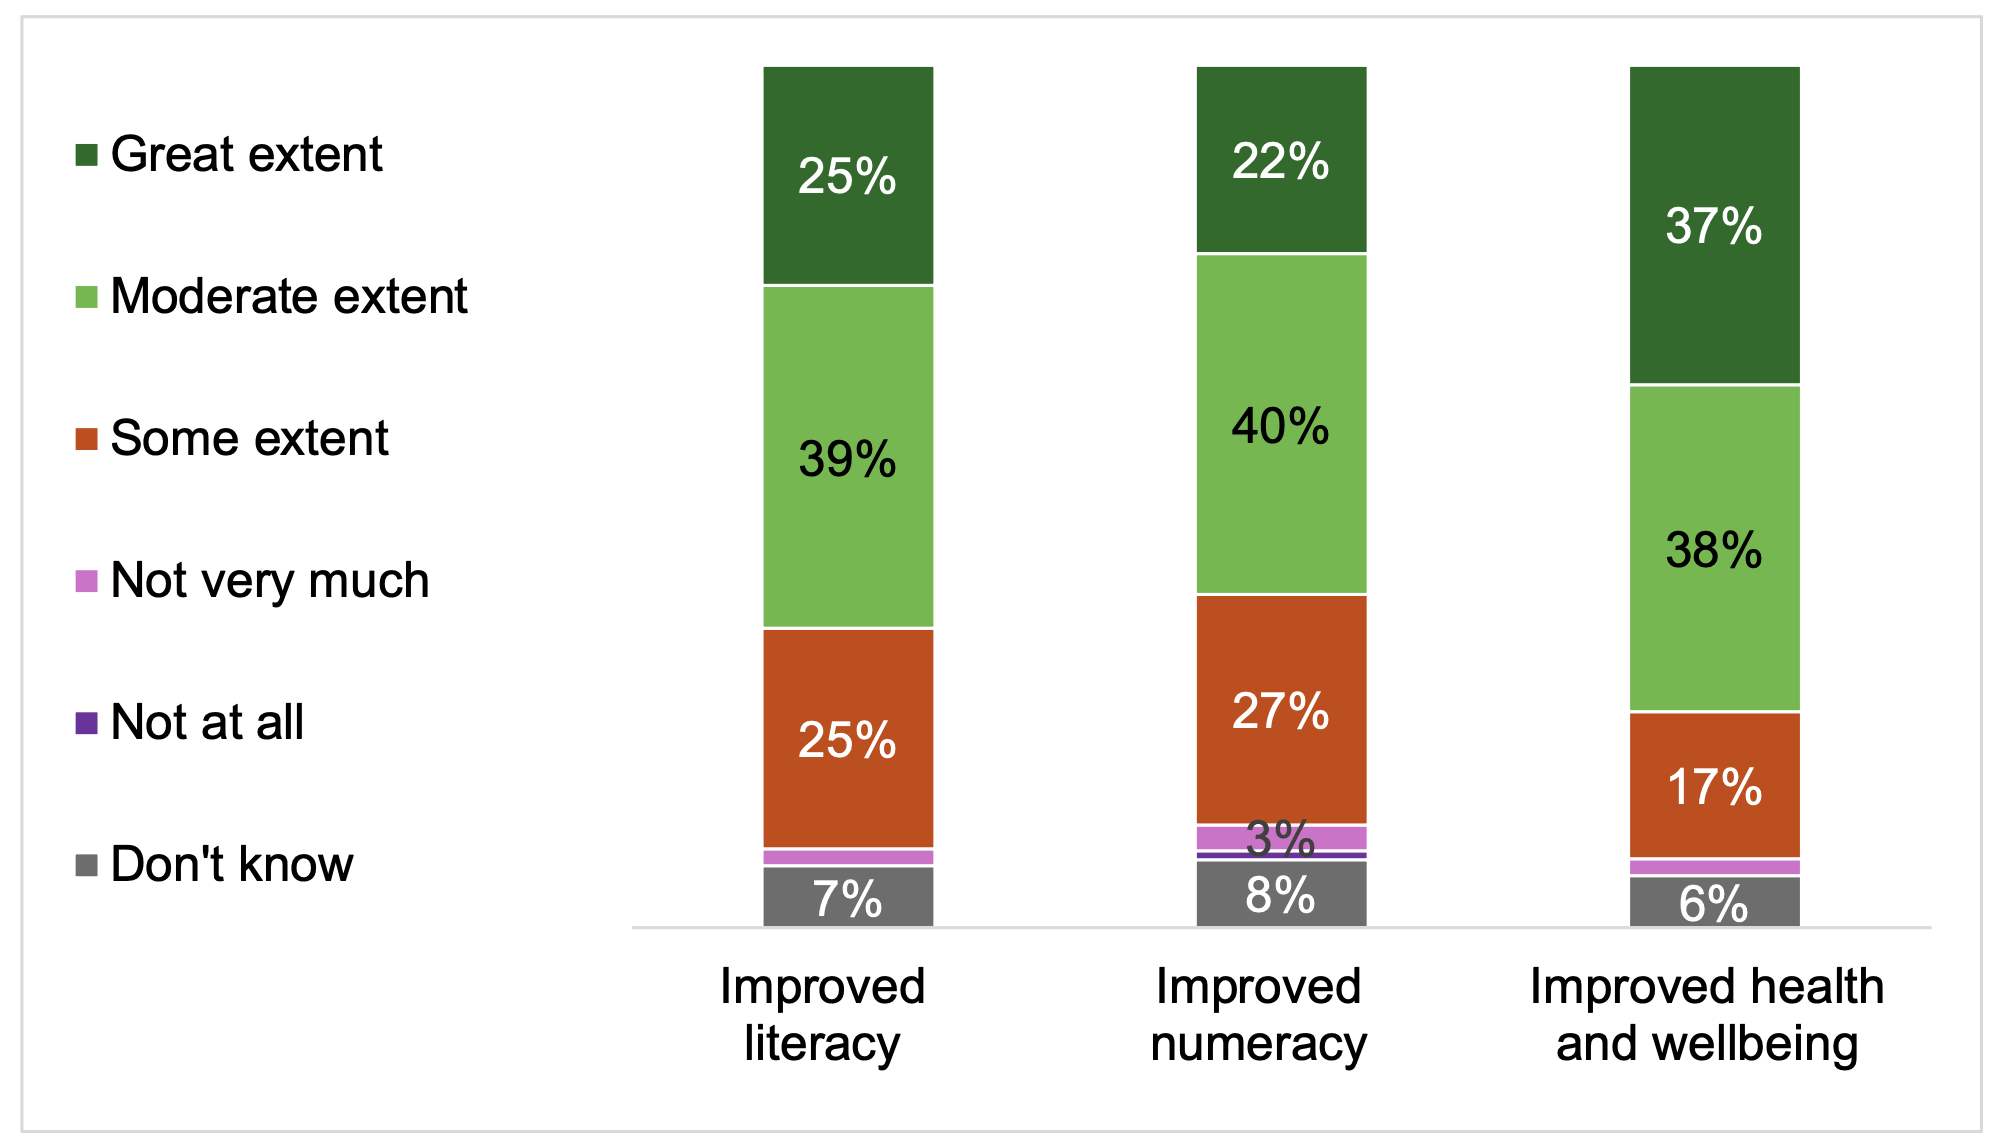
Base (all): 974
Results varied by role, with headteachers and senior/middle leaders being more likely to report improvements, and classroom teachers and support/other staff being more likely to say they did not know. Respondents based in primary schools were more likely than those in secondaries to report great/moderate improvements in literacy (67% v 58%) and numeracy (64% v 55%), but when respondent role is taken into account – i.e. by comparing primary and secondary headteachers/leaders, and primary and secondary teachers/other staff – there is less impact of school type on the results.
Those based in the second least deprived areas[17] tended to be most likely to report improvements: 75% said this for literacy (compared to 61% among the least deprived, 66% among the second most deprived,[18] and 64% among the most deprived) and 86% for health and wellbeing (compared to 70%, 78% and 75% respectively). Those in the second least deprived group were also more likely than those in the least deprived areas to report improved numeracy (71% v 57%). This is one of the only areas of the survey where findings did not follow a reasonably clear pattern from lowest to highest proportions of pupils in the most deprived quintiles. This perhaps suggests that when it comes to the perception of actual impact on improved literacy, numeracy and health and wellbeing, a range of other factors may be influencing progress in the most deprived areas – demonstrating the scale and complexity of the challenge of closing the poverty-related attainment gap.
How reported improvements reflect ASF approaches
Findings about reported improvements were analysed by looking at responses to other questions about the approaches schools had used. It should be noted that any correlations in the data do not necessarily imply a cause-and-effect relationship, and it is not possible to draw definitive conclusions about what is driving the link between variables. That said, there was evidence that reported improvements do reflect earlier information about the approaches used, for example:
- 96% of those who had seen improved literacy to a great extent reported that the ASF had supported literacy-related learning and teaching approaches; 94% said the same in relation to numeracy approaches and improvements
- 68% of those who had seen improved literacy to a great extent reported taking part in literacy-related professional learning; the equivalent figure was 65% for numeracy (compared to less than half of those reporting little or no improvement doing these kinds of professional learning)
- A focus on ASN approaches also appears to improve literacy and numeracy – those reporting improvements to a great extent were more likely than those who had not seen as much of an improvement to mention using the ASF for ASN approaches (67% for greatly improved literacy and 68% for greatly improved numeracy), and/or professional learning related to ASN approaches (58% for literacy and 60% for numeracy, compared to less than half of those reporting little or no improvement)
- Respondents reporting improvements in health and wellbeing to a great extent were particularly likely to say their school’s approach included pupil wellbeing initiatives (91%) and nurture-based approaches (79%); and to have undertaken professional learning in relation to these aspects (72% pupil wellbeing; 68% nurture-based approaches)
- Respondents who reported a focus on readiness to learn as part of their school’s approach were also more likely than others to report improvements, particularly for health and wellbeing: 48% of those reporting a focus on readiness to learn to a great extent reported improved health and wellbeing to a great extent, compared to 14% of those focused on readiness to learn to some/not much/no extent (equivalent figures were 31%/13% for literacy and 26%/11% for numeracy).
Pupils showing the most improvement in attainment
Respondents who noted any improvement in attainment were asked if there were any specific groups of pupils affected by poverty in their school showing the most improvement – see Table 17. Children with ASN were most likely to be mentioned in this context – two fifths (39%) said this group had shown most improvement in attainment. In terms of age/stage, those in S4-S6 were most likely to be highlighted (by 42% of respondents from secondary schools), followed by S1-S3 (34% of secondary school respondents). A quarter of those noting improvements in attainment said that children and young people who have experienced care had shown the most improvement.
| % | |
|---|---|
| Children with Additional Support Needs | 39% |
| S1-S3[19] | 34% |
| S4-S6 | 42% |
| P1-P4 | 26% |
| P5-P7 | 25% |
| Care experienced children and young people | 25% |
| Children with English as a Second Language | 17% |
| Boys | 14% |
| Girls | 11% |
| Other | 2% |
| None – no particular groups are showing more improvement than others | 22% |
| Don’t know/not sure | 16% |
| Base (all who reported any improvement in attainment) | 882 |
Respondents from secondary schools were more likely than those from primaries to mention several groups of pupils, including CECYP (44% v 19%) and those with ASN (46% v 35%). Primary school respondents were more likely to say no particular groups have shown more improvement than others (25% said this v 11% of secondary school respondents).
Impacts of the ASF on the poverty-related attainment gap
As well as asking about any improvements in pupil attainment and wellbeing, respondents were asked to consider the specific impact of the ASF on closing the poverty-related attainment gap – i.e. focusing not just on improvements among those affected by poverty, but whether the poverty-related attainment gap is closing between those from the most and least disadvantaged communities.
As shown in Figure 7, around three quarters of respondents reported that the poverty-related attainment gap has closed at least a little for all three aspects as a result of interventions/approaches supported by the ASF: 75% said this for literacy, 74% for numeracy and 75% for health and wellbeing – although the greatest change was reported for health and wellbeing, with 22% saying the gap had closed a lot. Less than one in ten said that the gap had not closed at all for each element (although around a fifth said they did not know).
Impact of the ASF on the poverty-related attainment gap
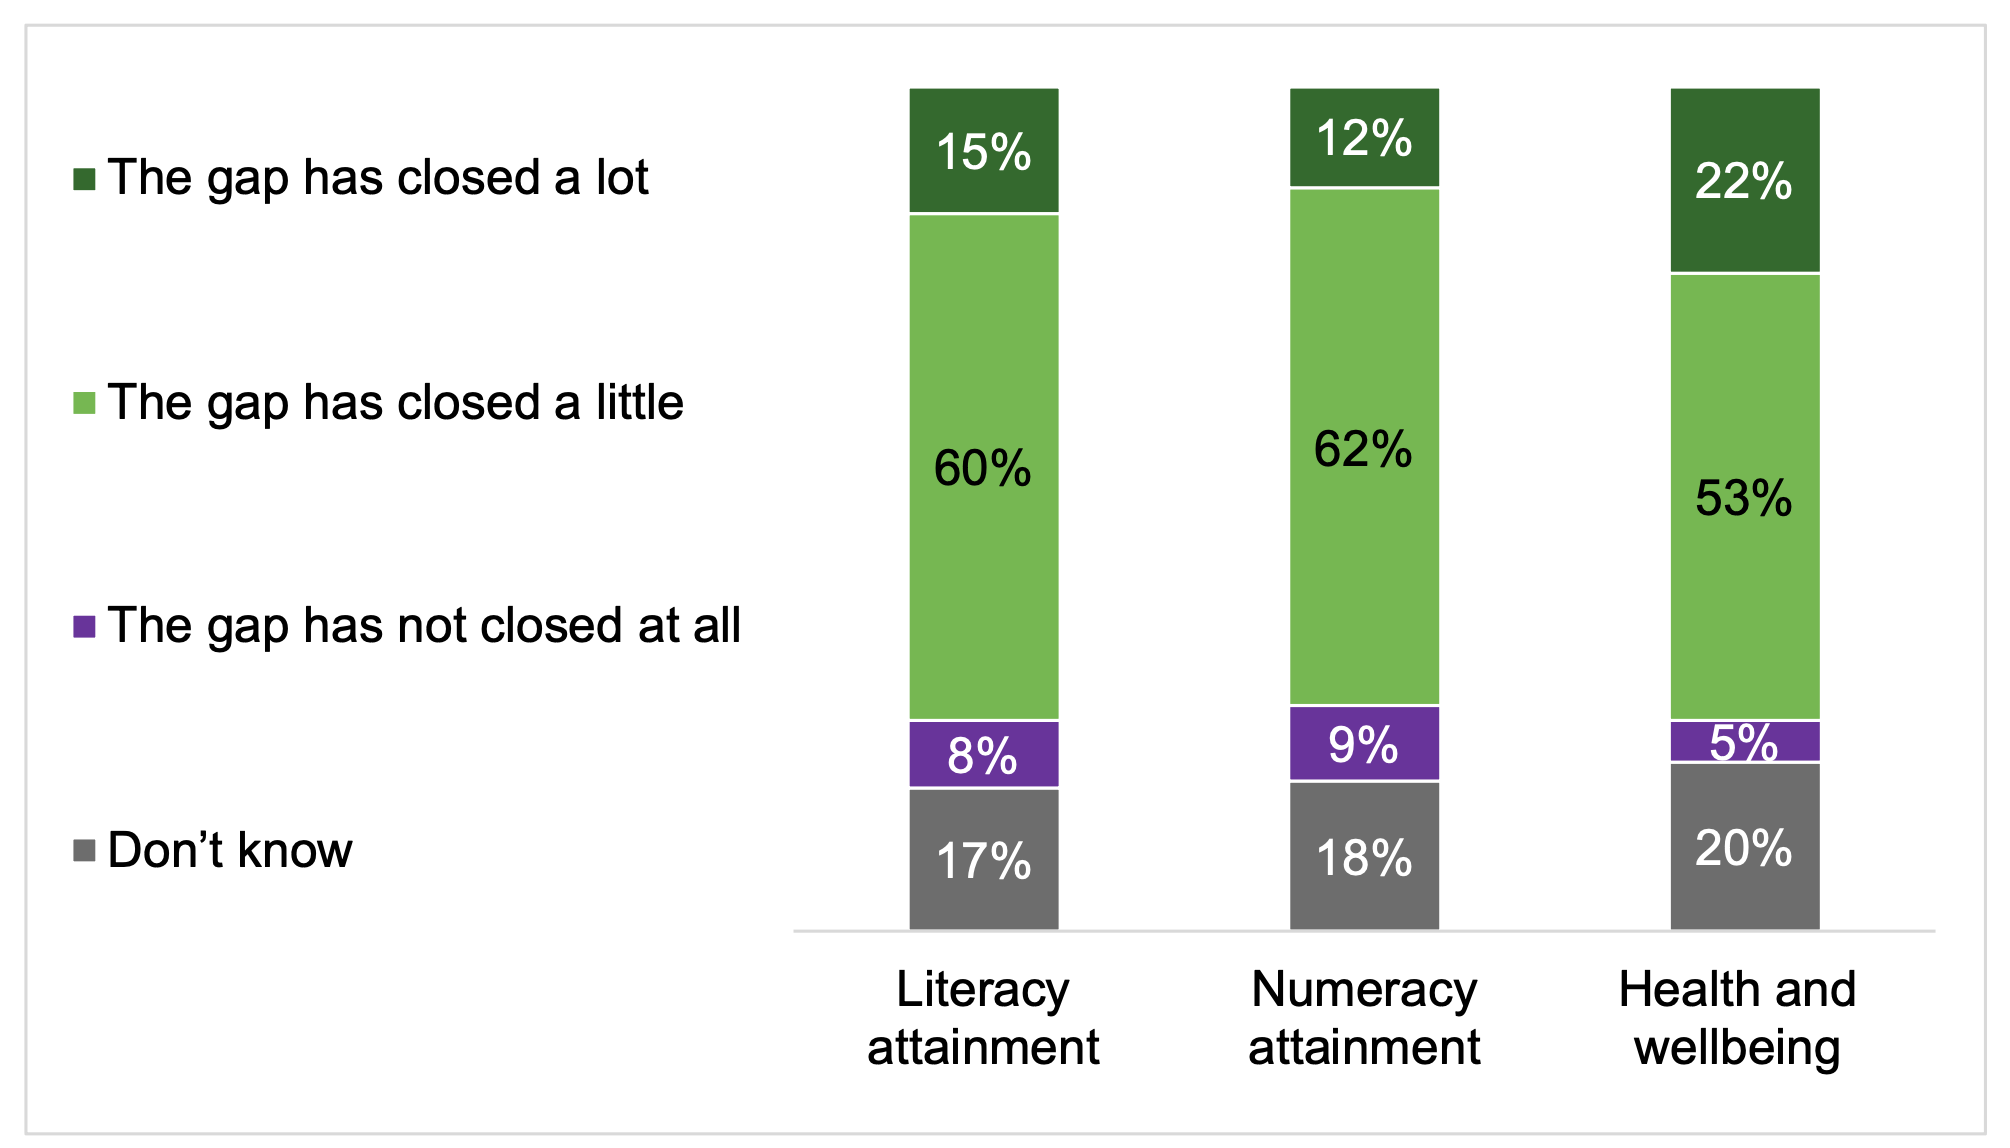
Base (all): 974
Headteachers and senior/middle leaders were more likely than others to say the gap had closed a little/a lot, while classroom teachers and support/other staff were more likely than senior staff to say they did not know. For example, among headteachers the proportion saying the gap had closed was 85% for literacy, 84% for numeracy and 85% for health and wellbeing.
Despite differences seen elsewhere in terms of the approaches implemented and experiences of the ASF, results in relation to the closing of the poverty-related attainment gap were very consistent across other sample sub-groups, particularly for literacy and numeracy attainment. For health and wellbeing, respondents from primary schools were more likely to report the gap had closed a lot (24% v 16% of secondary school respondents) – while those from secondaries were more likely to say they didn’t know (25% v 18%). In this instance, this was not due to respondent role – e.g. headteachers/leaders from primary schools were more likely than headteachers/leaders from secondary schools to report the gap had closed for health and wellbeing (85% v 78% said it had closed a little/a lot; 27% v 16% said it had closed a lot).
How reductions in the poverty-related attainment gap reflect ASF approaches
Data on reported closing of the gap was examined to explore any links with the approaches that schools had used – although the caveat about correlation not implying causation noted earlier should be borne in mind. Respondents reporting that the gap had closed a lot were more likely than those reporting it had not closed at all to mention:
- A focus on relevant learning and teaching approaches (98% saying the literacy gap closed a lot reported a focus on literacy-related learning and teaching approaches in their school; 94% reported the same for numeracy)
- Respondents reporting the gap had closed a lot for health and wellbeing were particularly likely to report professional learning in relation to wellbeing initiatives (73%, compared to 55% of those saying the gap had not closed at all) and family support/wellbeing initiatives (53% v 31%)
- Those who reported a focus on readiness to learn as part of their school’s approach were more likely than others to report the poverty-related attainment gap had closed, particularly for improved health and wellbeing: 29% of those reporting a focus on readiness to learn to a great extent reported the gap had closed a lot compared to 9% of those focused on readiness to learn to some/not much/no extent (equivalent figures were 19%/6% for literacy and 15%/4% for numeracy).
Improvements in readiness to learn
Respondents who had reported that a focus on readiness to learn featured in their school’s approach were asked if they had seen improvements as a result. Overall, two thirds of respondents (66%) reported improvements in readiness to learn to a great (31%) or moderate (35%) extent and a further quarter (26%) said this had improved to some extent – see Table 18.
| % | |
|---|---|
| NET: Great/moderate extent | 66% |
| To a great extent | 31% |
| To a moderate extent | 35% |
| To some extent | 26% |
| Not very much | 3% |
| Not at all | 1% |
| Don’t know/not sure | 4% |
| Base (all who reported a focus on readiness to learn) | 936 |
These results were broadly consistent by job role. Greater improvements in readiness to learn were reported by respondents from schools with at least 25% of pupils living in the most deprived areas: 59% of those in the least deprived areas reported a great/moderate improvement, compared to between 70% and 72% in other areas[20]. A similar pattern was seen based on urban/rural classification (58% of those in small towns/rural areas reported a great/moderate improvement v 70% large urban/71% other urban areas).
Impacts of approaches to support CECYP
Respondents who had mentioned specific approaches to support CECYP were asked to describe any impacts they have seen, and the main themes are outlined in Table 19. The majority (seven in ten) outlined details of the support provided – most commonly mentions of specific pupil support staff put in place (29%), tailored interventions based on knowledge of pupils (25%), wellbeing focused approaches (22%) and details of specific activities/support provided (21%). Around seven in ten described the impacts of this support, which was most likely to be improved attendance/attainment for CECYP (32%), behavioural/emotional impacts (16%) and increased engagement in school (15%).
| % | |
|---|---|
| Details of specific approaches | 72% |
| Pupil support/designated staff/agencies | 29% |
| Tailored/targeted/tracked interventions and pupil knowledge | 25% |
| Wellbeing/nurture/trauma-informed approaches (incl. mentions of The Promise) | 22% |
| Play therapy/counselling/activities/clubs/trips | 21% |
| Details of impacts | 69% |
| Improved attendance/attainment (incl. willingness to learn) | 32% |
| Behaviour improvements/enhanced confidence/emotional resilience | 16% |
| Increased engagement from CECYP | 15% |
| Increased staff awareness/understanding of CECYP | 12% |
| Increased inclusion/feeling included/normality | 11% |
| Improved health and wellbeing | 9% |
| Improved transitions/destinations | 7% |
| Improved relationships | 6% |
| Wider opportunities/experiences | 5% |
| Base (all who had mentioned approaches to supporting CECYP and provided a comment) | 525 |
Factors contributing to progress
Respondents were asked an open-ended question about what factors have contributed to progress seen or have had the most impact in terms of closing the poverty-related attainment gap. Key themes from this question are outlined in Table 20. The most common responses fell under the heading of staffing/resources (60%) – having more/specialist staff (including specifically PEF-funded roles) was mentioned by 30%, and general staffing resources/pupil ratios was mentioned by 25%. Around half (49%) said that approaches focusing on pupil wellbeing/needs/readiness to learn have had the most impact, and a further 35% mentioned the ability to target approaches/pupil support (this was most likely to be a general comment about being able to target approaches, although 11% specifically mentioned support for children with ASN). Focusing on improved attendance/engagement and increased literacy/numeracy provision (including through PEF specifically) were also mentioned by around a quarter.
| % | |
|---|---|
| NET: Impact on staffing/resources | 60% |
| Increased staffing, specialisms, and retention (i.e. PEF-funded) | 30% |
| Staffing, resources, pupil ratios | 25% |
| Staff training and upskilling (e.g. through PEF-funding) | 13% |
| Budgets and funds for (specific) resources | 10% |
| Approaches focusing on pupil wellbeing/needs/readiness to learn | 49% |
| NET: Targeted approaches/pupil support | 35% |
| Targeted approaches/interventions (in general) | 26% |
| Support for children with ASN | 11% |
| Improved attendance/engagement/interventions | 28% |
| Increased literacy and numeracy provision (through PEF) | 24% |
| Evaluation and monitoring/tracking (using data) | 16% |
| Community initiatives/collaborations/agencies (fewer barriers) | 16% |
| Pupil attainment – qualifications, awards, achievement | 16% |
| Whole-school focus, curriculum structure and planning (incl. autonomy) | 14% |
| Base (all who provided a comment) | 695 |
The quotes below illustrate the type of feedback provided about what has contributed to progress:
“We employed more staff that could support with programmes on a regular basis. Targeted support and assessment we could not have done without the funding”. Primary school, Headteacher
“The PEF funding has been used to appoint Principal Teachers of Attainment and Achievement [who] work together closely to identify attainment and wellbeing needs early and put necessary interventions in place to support these young people… [including] direct 1-2-1 subject specific interventions to help support attainment and wellbeing. Additionally, our whole school nurturing approach to learning and teaching and relationships is also at the heart of closing the62%”. Secondary school, Middle leader
“Time spent on a 1-2-1 basis with teaching staff to explore (and fill) gaps in learning in literacy and numeracy. Nurture and soft breakfast club start to ensure they are fed. Re-distribution of left-over canteen food, again to ensure basic needs for food/nutrition are being met. Access to free uniform resources”. Secondary school, Learning support
“Supporting those children with additional support staff who can work in small groups/1-1 on literacy and numeracy. Also having those staff to build positive and supportive relationships with those pupils, allowing us to emotionally support them and have a greater understanding of what is going on daily in home life which impacts their school life. Investment in time and relationships are the two big things that impact student wellbeing”. Primary school, Middle leader
Factors preventing (greater) improvement
Respondents were asked if there were any factors preventing improvements, or reasons why their school has not seen greater progress in improving attainment or closing the poverty-related attainment gap (see Table 21 for the key themes from these comments). The most commonly mentioned challenges related to staffing issues/lack of staff (36%), issues with the amount/allocation of funding (26%), wider societal challenges (26%) and an increase in pupils with special needs/issues to be addressed (23%) – particularly an increase in additional support needs (17%). Challenges related to negative behaviour/attitudes (from pupils and parents) (19%) and challenges caused by pupil absence (18%) were also commonly highlighted.
| % | |
|---|---|
| NET: Staffing issues (e.g. staff absence, turnover, recruitment etc.) | 36% |
| Lack of staff in general | 25% |
| Staff absence | 8 % |
| Staff turnover/temporary positions | 6 % |
| NET: Funding issues/lack of funding (incl. issues with PEF allocation) | 26% |
| Lack of funding in general | 16% |
| Do not get enough PEF | 7% |
| NET: Challenges caused by wider societal issues | 26% |
| Poverty and hidden poverty | 1 3% |
| COVID long-term impact | 4% |
| Troubled home life/family breakdown etc. | 4 % |
| NET: Increase in pupils with special needs/issues | 23% |
| Increase in special needs/ASN/the presumption of mainstream | 17 % |
| Impact of this (overstretch staff/take time from other things) | 6 % |
| Increase in mental health/other wellbeing issues | 5 % |
| NET: Challenges caused by negative behaviour/attitudes (including lack of parental engagement) | 19% |
| Ne gative parental attitudes/lack of interest | 1 3% |
| Negative behaviour and attitudes – pupils | 7 % |
| NET: Challenges caused by pupil absence/non-attendance | 18% |
| Base (all who provided a comment) | 703 |
The quotes below provide examples of the types of comments made about challenges to progress:
“Very hard to recruit for PEF posts due their temporary nature. Once someone is in place they can only be seconded for two years meaning starting over again far too regularly. Posts like these are essential for the wellbeing and attainment of pupils from disadvantaged backgrounds and yet they are not prioritised as such”. Secondary school, Middle leader
“The biggest challenges are that poverty is complex, and the effects can be generational. The impact of poverty can be mitigated to a degree, but it is fanciful to think that it will be eradicated or that the gap can be reduced in a short time. This needs to be a 20-year project rather than a 4 or year-on-year data. The outcomes for children can't be measured each year – that data is useless. The focus has to be long-term on positive destinations etc”. Primary school, Headteacher
“Our catchment is in a fairly deprived area, a lot of changes of pupils and EAL pupils mean closing the literacy attainment gap is tricky. Staffing shortages and behaviour of pupils in the school means Learning and Teaching opportunities, and staff to support the close of the attainment gap, are more likely caught up in supporting HWB of specific pupils and ensuring behaviour is not causing harm to themselves or others”. Primary school, Classroom teacher
“Limitations on number of staff able to run closing gap interventions. Spaces for interventions are limited and often a waiting list for pupils. Due to high number of ASN across the school support staff are spread thin and are often not able to provide direct support to pupils… Waiting lists for external agencies are often high and families don't always receive support when it’s needed most. Cost of living and cost of school day – impact health, hygiene – often leads to issues of bullying”. Secondary school, Guidance/pastoral support
Impacts of the ASF on wider achievement and opportunities
One focus of the Scottish Attainment Challenge mission is to provide wider opportunities for children and young people, and the survey asked respondents about the extent to which they felt this had been achieved.
Whether ASF has provided wider opportunities for pupils affected by poverty
Overall, three quarters of secondary school respondents agreed that the ASF has provided opportunities for children and young people to develop important skills for learning, life and work (75%), and three quarters of all respondents agreed it has provided opportunities to learn outside the classroom (74%). Agreement was slightly lower that the ASF has provided opportunities for wider experience/achievements such as voluntary work, sport, the arts and other activities, although a majority still agreed (66%). See Figure 8.
Respondents from secondary schools were more likely than those from primaries to agree in relation to offering wider achievements such as voluntary work, arts and sports etc (72% v 63%), while views were split down the middle in terms of SIMD profile – those in the two least deprived groups were less likely to agree than those from the two most deprived groups.[21]
Agreement was lower overall about the ASF offering opportunities to learn beyond the classroom among respondents based in small town/rural schools (69% agreed v 76% in large urban and 77% in other urban areas) and those in schools with the lowest proportion of pupils living in deprived areas (64% least deprived, v 78% second least deprived[22], 79% second most deprived[23] and 83% most deprived). It is not clear whether these findings reflect lower access to wider opportunities in these areas, and/or the lower levels of ASF funding likely to be available to these schools due to how the funding is allocated.

Base (all): 947, Secondary school staff 248
Impact of ASF funding providing opportunities beyond the classroom
Those who agreed that ASF has provided opportunities for children and young people to learn beyond the classroom were asked how it has done this and what the impact has been. Key themes are outlined in Table 22. Almost nine in ten described opportunities provided in this area by the ASF; this was most often holidays/residentials/trips (mentioned by 49%), outdoor learning (32%), after school clubs (21%) and/or sporting events/activities (18%).
The main impacts described included the fact that this allowed all children and young people to take part (37%), and it provided life skills/experience (31%). Improvements to mental health/wellbeing/self-esteem (16%), attendance/engagement (15%) and confidence for transitions (15%) were also frequently mentioned.
| % | |
|---|---|
| NET: Details of what ASF funded in this area | 87% |
| Holidays/residentials/trips | 49% |
| Outdoor learning/forest schools etc. | 32% |
| After-school clubs (extra-curricular) | 21% |
| Sporting events/activities | 18% |
| Employed youth workers/agencies/partners | 12% |
| Music and performing arts | 9% |
| Charity/community experience | 8% |
| Work/vocational experience | 7% |
| Transport costs | 6% |
| Museum and cultural visits | 5% |
| NET: Reported impacts | 79% |
| All children may participate (funded) | 37% |
| Life skills/experience/understanding | 31% |
| Improved mental health/wellbeing/self-esteem | 16% |
| Attendance and engagement | 15% |
| Transition to secondary/confidence for future | 15% |
| Improved/positive relationships | 7% |
| Qualifications/awards/achievements | 7% |
| Improved family support/liaison/learning | 7% |
| Everyday budgeting/flexibility | 6% |
| Base (all who agreed it had provided opportunities and provided a comment) | 499 |
Learning and teaching
Respondents were asked a series of questions about learning and teaching approaches within their school, and the extent to which learning and teaching practices initiated by the ASF had become embedded at the classroom level.
Views of learning and teaching
As illustrated in Figure 9, respondents expressed very high levels of agreement overall that their school routinely uses approaches, tools and/or resources to support pupils affected by poverty (92% agreed), that leadership support classroom staff to develop their skills and utilise approaches/resources to ensure needs of pupils affected by poverty are met (88%), that as a result of the ASF staff are more aware of how they can support pupils affected by poverty (84%), that staff know where/how to access support (83%) and that classroom staff have the skills to do this (83%). However, it is worth noting that the balance tended to be towards ‘agree’ rather than ‘strongly agree’ for all of these statements.
There was lower agreement among respondents that their school has sufficient resources to support pupils affected by poverty – 56% agreed with this, but strong agreement was fairly low (14%) and 26% said they disagreed with this statement. Classroom teachers were more likely than any other group to disagree about having sufficient resources (35% of classroom teachers disagreed with this).
As seen elsewhere in the survey, perceptions tended to be more positive among headteachers and senior/middle leaders than other groups: senior staff were more likely to agree with most statements than classroom teachers and support/other staff.
There was also a general pattern in responses that those from primaries tended to give more positive ratings than those in secondaries (not due to the higher proportion of senior staff among primary school respondents), while lower ratings were given by those in small towns/rural areas and in the least deprived areas. This is perhaps unsurprising since those with fewer pupils in deprived areas may have less need on a day-to-day basis for resources to address this issue.
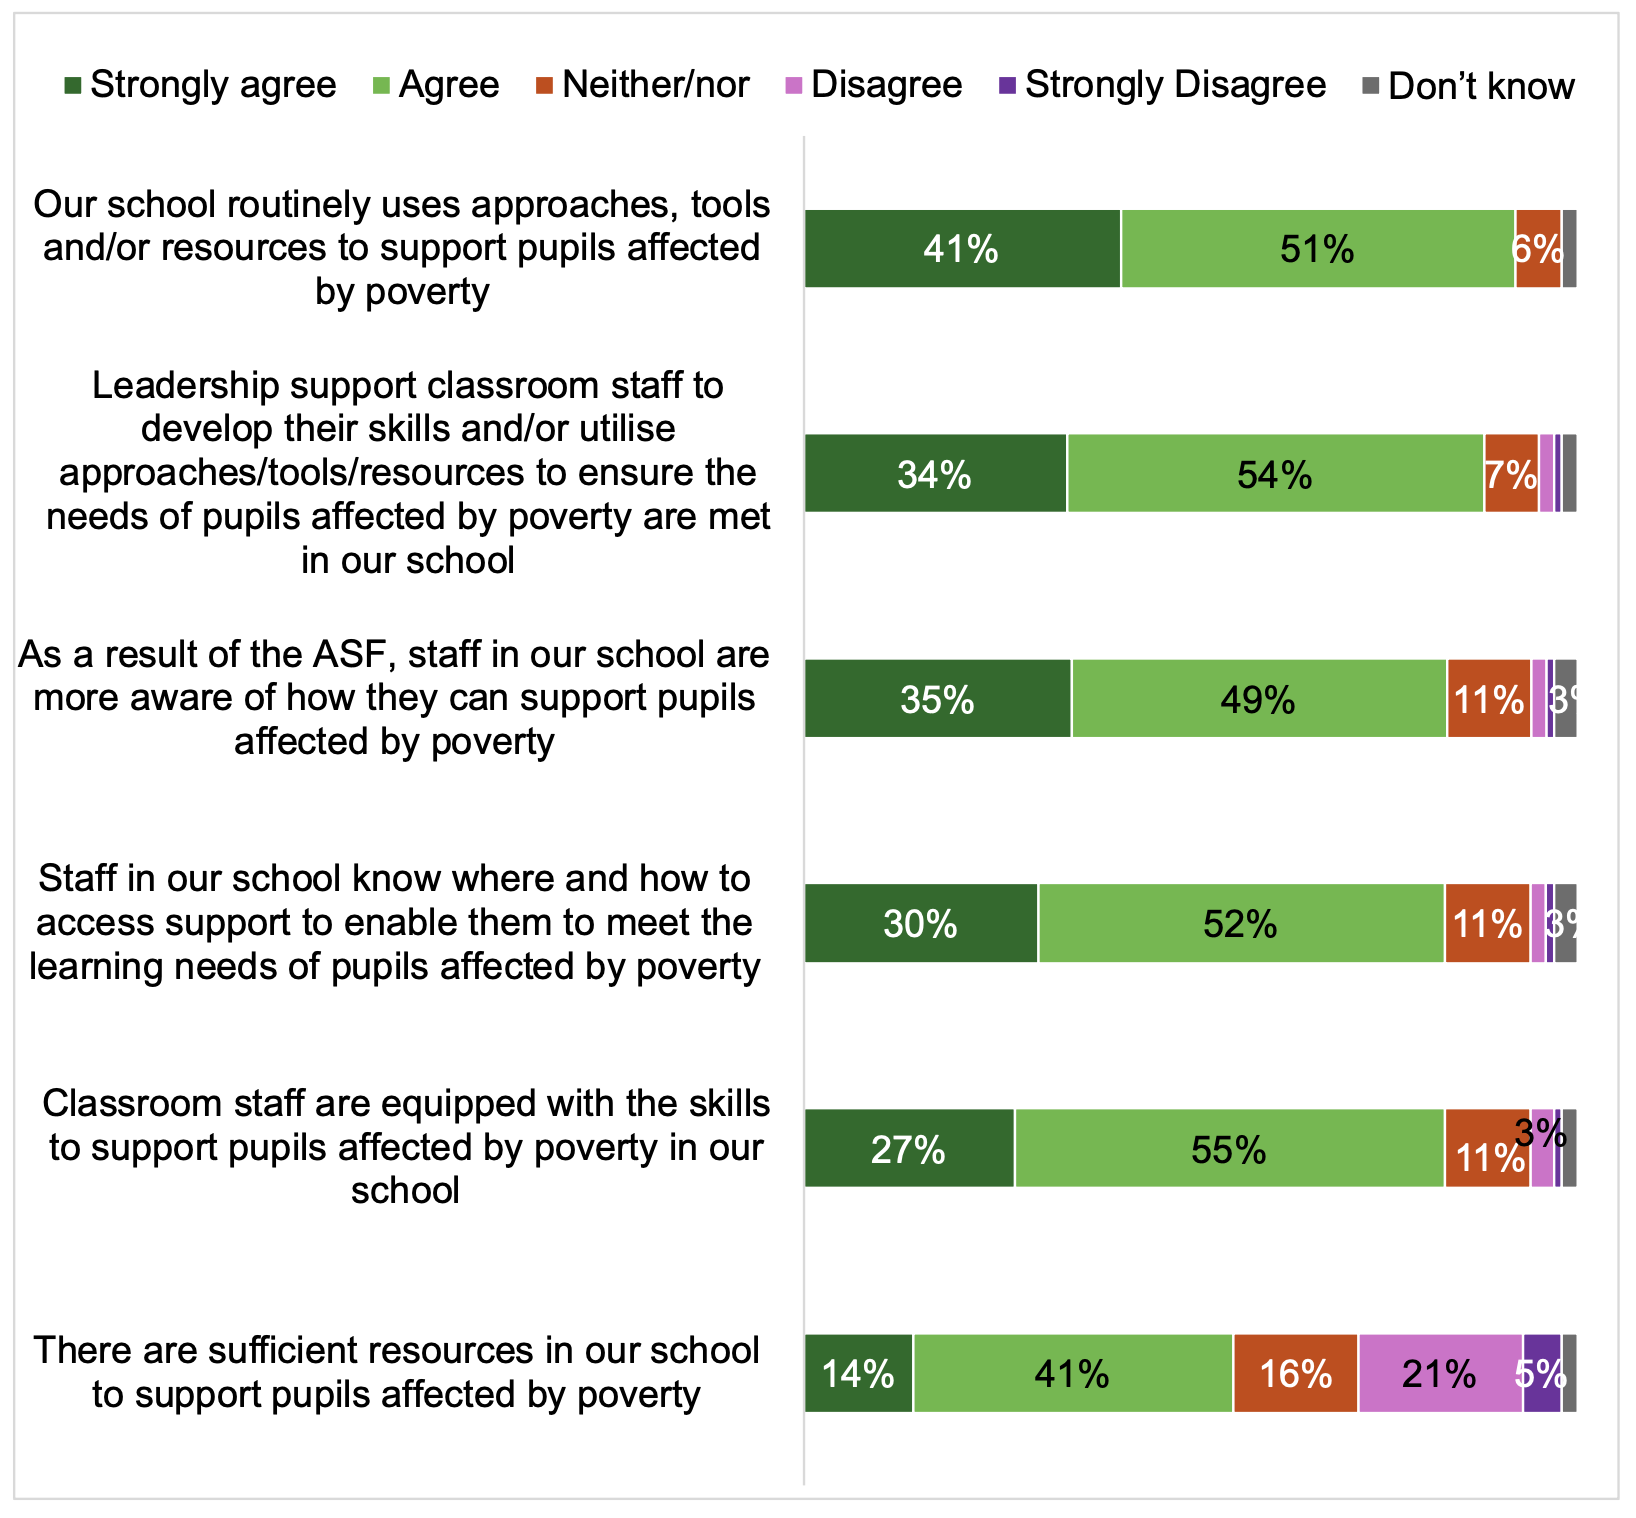
Base (all): 947
Embeddedness of learning and teaching approaches
A crucial aim of the ASF is to embed approaches to learning and teaching across the school (i.e. approaches are used routinely throughout the school, rather than being seen as a one-off activity). Respondents were therefore asked the extent to which they felt learning and teaching practices initiated by the ASF had become embedded at the classroom level.
As shown in Table 23, the majority (62%) said learning and teaching approaches were embedded to a great/moderate extent and 26% said this had happened to some extent. There was a clear pattern in results by role, with headteachers and senior/middle leaders being more likely to report that approaches were embedded, while classroom teachers and support/other staff were less likely to say this (and more likely to say they were not sure).
| All | Head-teachers | Senior/middle leaders | Classroom teachers | Support/ other staff | |
|---|---|---|---|---|---|
| NET: Great/moderate extent | 62% | 70% | 64% | 51% | 42% |
| To a great extent | 26% | 30% | 27% | 22% | 18% |
| To a moderate extent | 36% | 41% | 37% | 29% | 24% |
| To some extent | 26% | 26% | 29% | 30% | 19% |
| Not very much | 1% | 1% | 1% | 2% | 3% |
| Not at all | 1% | <1% | <1% | 1% | - |
| Don’t know/not sure | 9% | 2% | 6% | 16% | 37% |
| Base (all) | 974 | 487 | 209 | 158 | 120 |
Respondents from primary schools were more likely than those from secondaries to report approaches are embedded (66% said this had happened to a great/moderate extent v 50% of secondary school respondents) – and this was not due to the primary respondents being more senior, as headteachers/leaders at primaries were more likely than headteachers/leaders at secondaries to report approaches were embedded to a great/moderate extent (72% v 57%).
Those based in schools in the most deprived areas were also most likely to report embedded approaches (72% v 55% least deprived), while those from small towns/rural areas were less likely to say this than those in urban areas (56% v 65% large urban and 66% other urban).
Culture and ethos
After asking respondents to consider the learning and teaching approaches used at the classroom level, the survey included a series of questions considering the culture and ethos of schools more widely. These questions aimed to explore the impact of the ASF on culture and ethos, and whether an overall approach to achieving equity in education and reducing the poverty-related attainment gap has been embedded within school communities.
Views of school culture and ethos
As illustrated in Figure 10, respondents tended to provide a positive picture of their school’s culture and ethos in relation to equity in education.
The majority of respondents agreed that leadership encourages a positive culture and ethos to support the learning needs of all pupils, including pupils affected by poverty (96%), that staff are aware of the poverty-related barriers and challenges to learning (95% – very close to the 94% reporting a great/moderate understanding of challenges/barriers themselves), and that addressing the needs of children affected by poverty is an important factor in their school (93%). Strong agreement was also high for all of these statements.
Overall agreement was slightly lower for the other statements, although at least eight in ten respondents still agreed that staff have access to professional learning (84%), that the ASF has contributed to a positive culture in this area (81%) and that staff are confident they can effectively support pupils affected by poverty (81%). For these three statements, the balance tended to shift towards ‘agree’ rather than ‘strongly agree’ (see Figure 10).
A similar pattern in results was observed for perceptions of school culture and ethos as seen elsewhere in the survey, with headteachers and senior/middle leaders giving more positive ratings than classroom teachers and support/other staff (support/other staff in particular were more likely to be unsure).
Respondents from schools in the most deprived areas, and from urban areas, were also more likely to agree with statements in relation to staff being aware of challenges/being able to support pupils affected by poverty etc. For example, in relation to ‘the ASF has contributed to a positive culture and ethos in our school for responding to the learning needs of all pupils, including those affected by poverty’, overall agreement was 75% for respondents from the least deprived areas compared to 85% from the most deprived; and 76% among those based in small towns/rural areas compared to 88% of those from large urban schools.
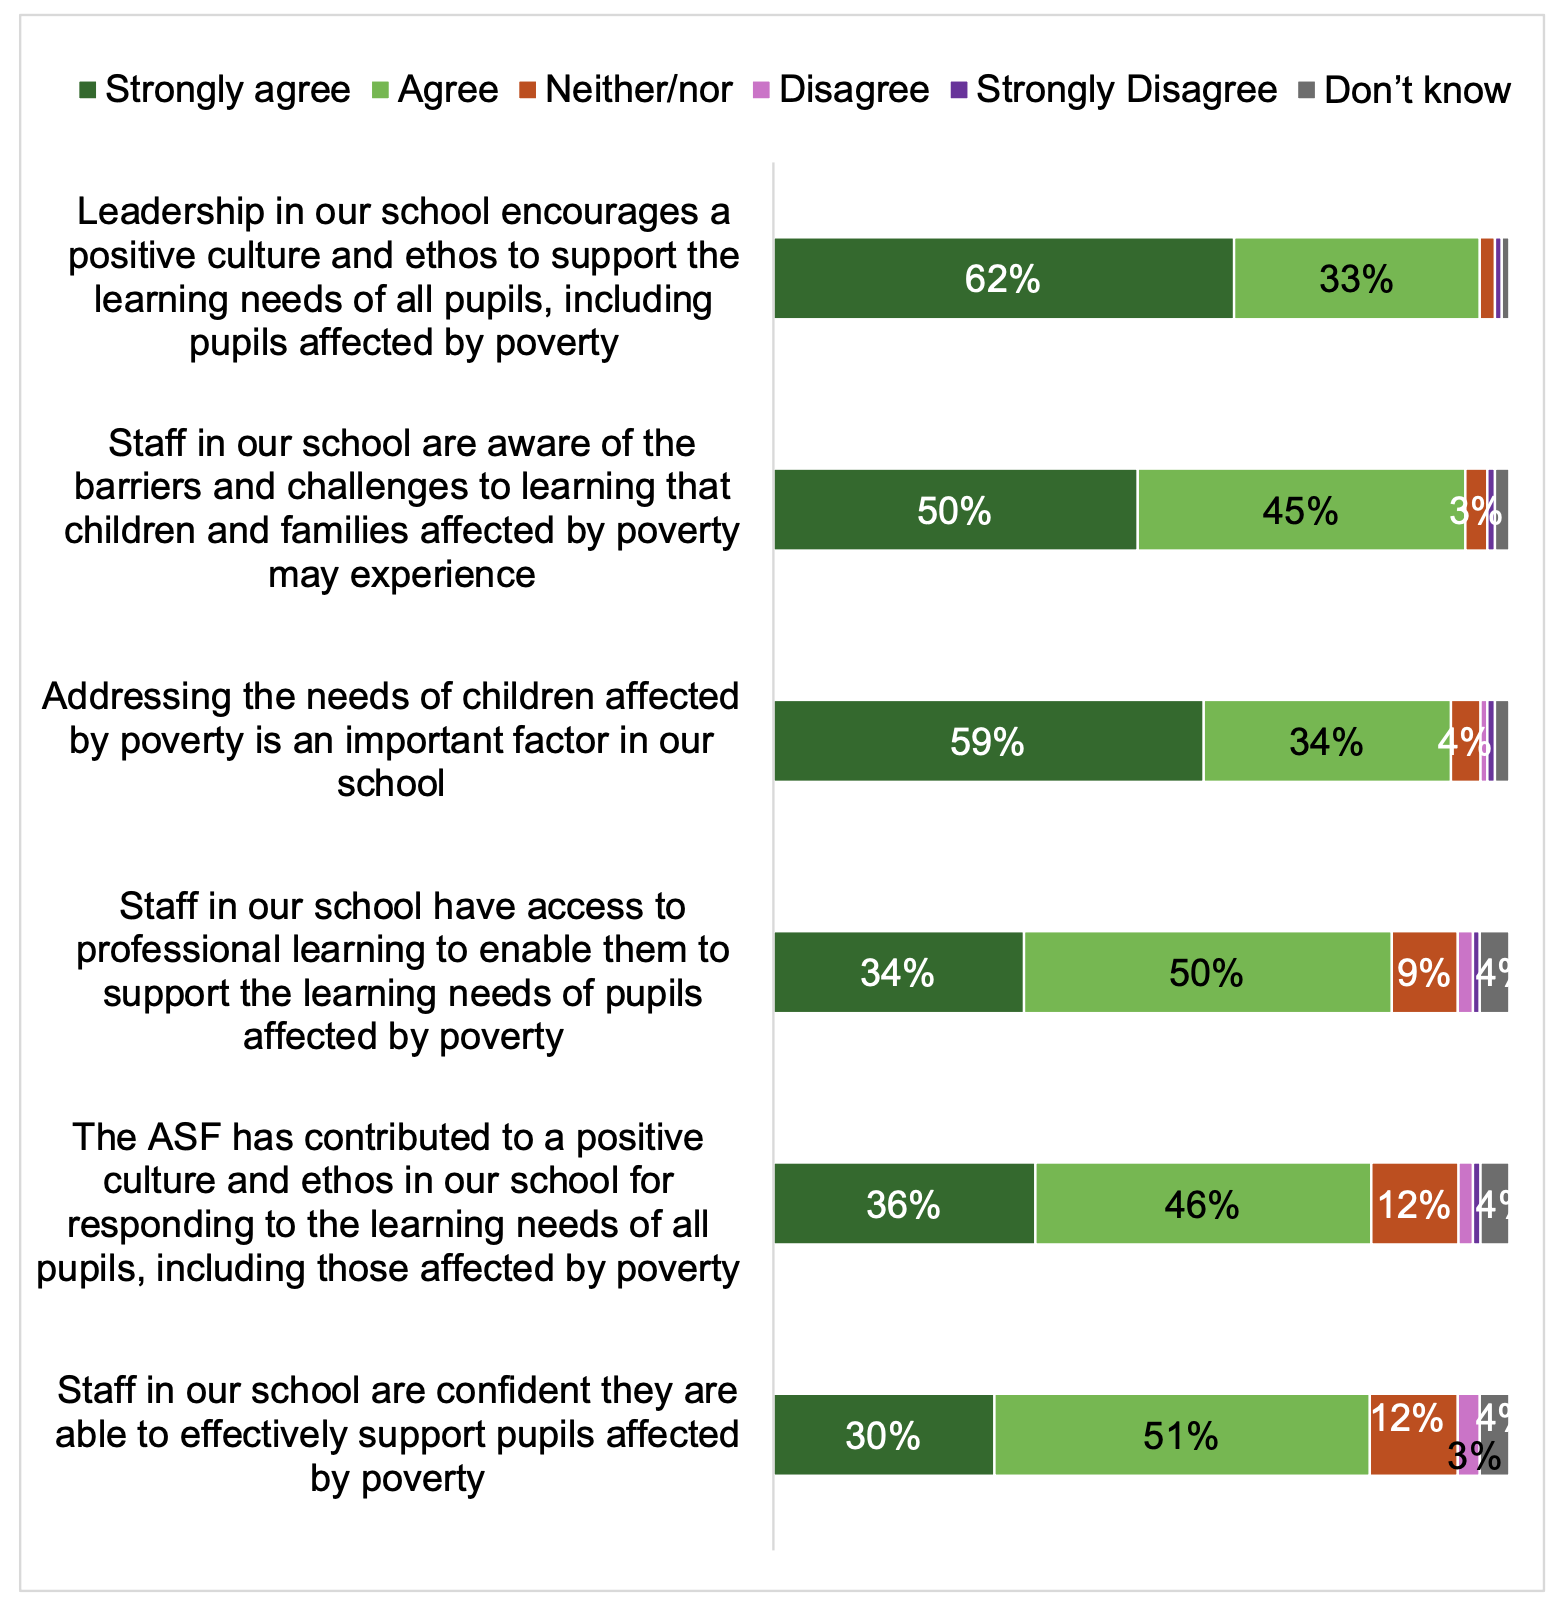
Base (all): 947
Embeddedness of approaches to equity
Respondents were also asked about the extent to which an overall approach to achieving equity in education and reducing the poverty-related attainment gap has been embedded within their school community. Over three quarters (77%) said this has happened to a great or moderate extent and a further 19% to some extent (see Table 24). Again, support/other staff were least likely to report this to a great/moderate extent, but were more likely to say they did not know.
| All | Head-teachers | Senior/middle leaders | Classroom teachers | Support/ other staff | |
|---|---|---|---|---|---|
| NET: Great/moderate extent | 77% | 81% | 81% | 70% | 60% |
| To a great extent | 43% | 45% | 45% | 39% | 34% |
| To a moderate extent | 34% | 36% | 35% | 32% | 26% |
| To some extent | 19% | 18% | 16% | 22% | 20% |
| Not very much | 1% | <1% | 2% | 1% | 3% |
| Not at all | <1% | - | - | 1% | - |
| Don’t know/not sure | 3 % | <1 % | 1 % | 5 % | 18% |
| Base (all) | 974 | 487 | 209 | 158 | 120 |
These findings were consistent by school type, but again there were differences based on deprivation: those from the least deprived areas were least likely to say approaches to equity had been embedded to a great extent (34%, compared to 45% in the second least deprived,[24] 51% in the second most deprived[25] and 49% in the most deprived areas). This reflects earlier findings about staff in these schools reporting a greater understanding of challenges and barriers for children and young people affected by poverty.
Impact of the ASF on the wider education system
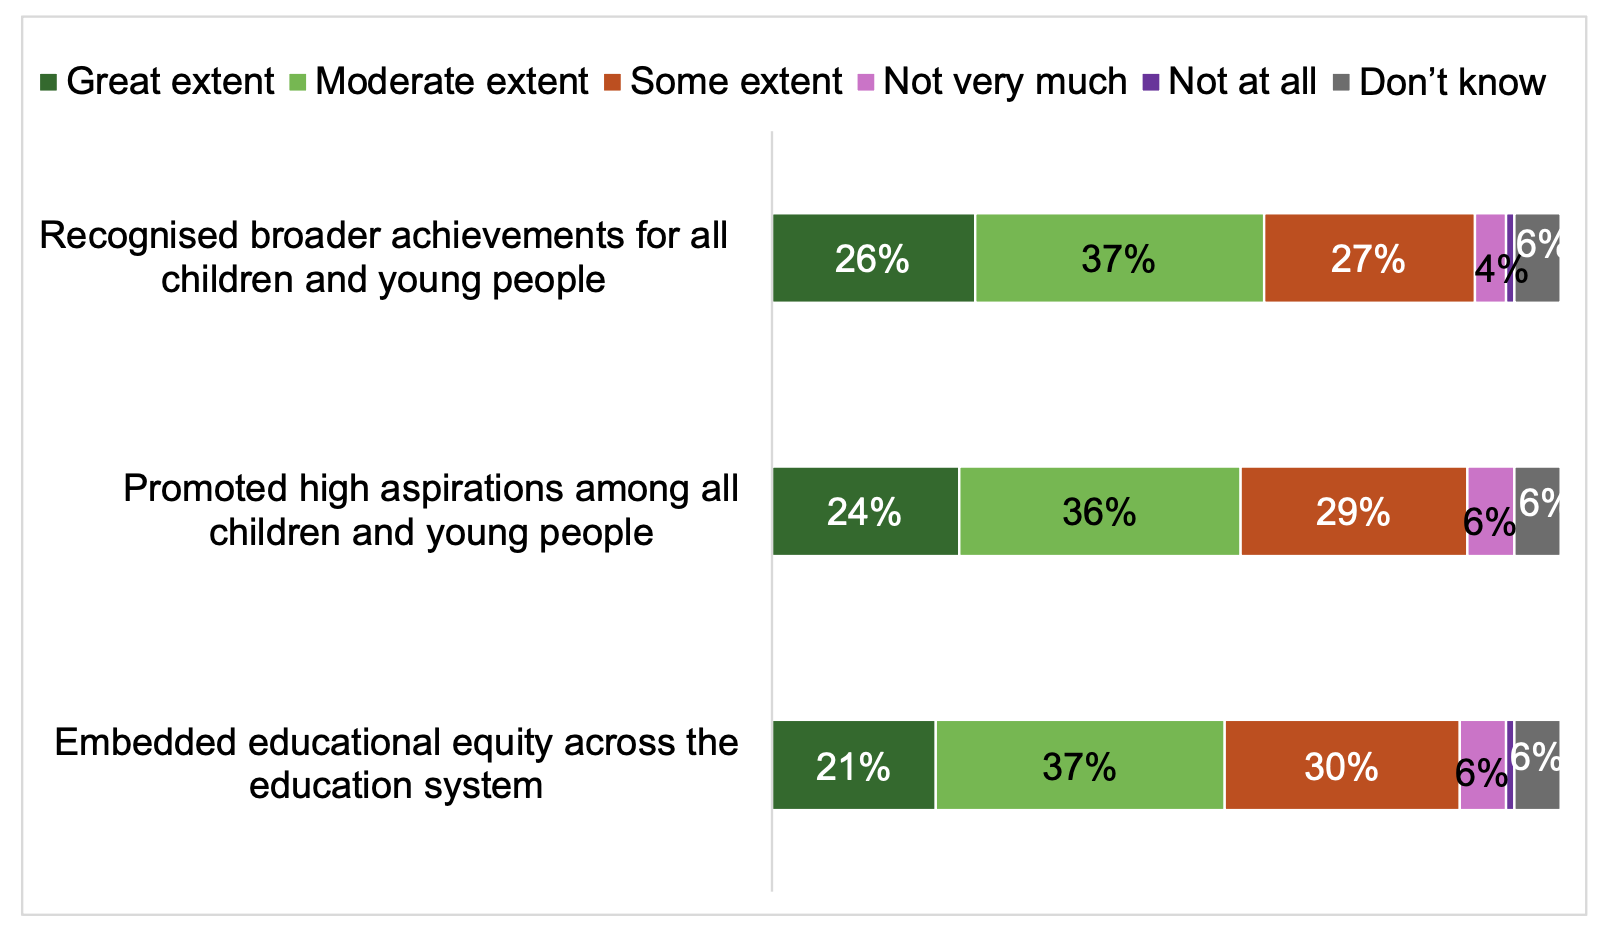
The survey asked respondents to consider the impact of the ASF on the education system as a whole, not just their own school. As shown in Figure 11, most said that the ASF has recognised broader achievements to a great or moderate extent (63%), promoted high aspirations for all children and young people (60%) and embedded educational equity across the education system (58%). Respondents were more likely to say that these aspects had been achieved to a moderate extent than a great extent, although very few said not very much/not at all.
Similar to other results, those most likely to say the ASF had achieved these things to a great or moderate extent were the more senior staff roles – headteachers and senior/middle leaders were more positive than classroom teachers and support/other staff (who were more likely to say they did not know). These results were broadly consistent across other sub-groups.
Base (all): 974
Sustainability
The final section of the survey focused on the sustainability of approaches beyond the current phase of the programme. As noted earlier, some partial completions were included if respondents answered up to and including the previous section of the survey, but not all staff completed all questions in the final section on sustainability. Base sizes therefore vary slightly in the following analysis.
Sustainability of improvements reported
All respondents who had reported the poverty-related attainment gap had closed a little or a lot for literacy, numeracy and/or health and wellbeing were asked if they thought the improvement as a result of the ASF would be sustainable beyond the current phase of the programme. A third overall said yes, although this was more likely to be to a moderate extent (24%) than to a great extent (9%) – see Table 25. Headteachers were the least optimistic in their judgements about sustainability, with 27% saying improvements were sustainable compared to 41% of senior/middle leaders and 43% of classroom teachers.
| All | Head-teachers | Senior/middle leaders | Classroom teachers | Support/ other staff | |
|---|---|---|---|---|---|
| NET: Great/moderate extent | 33% | 27% | 41% | 43% | 36% |
| Yes, to a great extent | 9% | 7% | 12% | 11% | 14% |
| Yes, to a moderate extent | 24% | 20% | 29% | 32% | 22% |
| To some extent | 42% | 47% | 34% | 36% | 34% |
| Not very much | 12% | 12% | 14% | 10% | 11% |
| Not at all | 7% | 8% | 7% | 8% | 5% |
| Don’t know/not sure | 6% | 6% | 4% | 3% | 14% |
| Base (all who reported the gap has closed) | 784 | 439 | 174 | 98 | 73 |
Staff based in secondary schools were more likely than those in primaries to say that improvements were sustainable to a great/moderate extent (40% v 30% – and this was not affected by staff seniority), while those in small towns/rural areas were less likely than those in large urban areas to say this (28% v 38%).
Sustainability of focus on closing the gap beyond the current phase of ASF
All respondents were asked the extent to which they thought the focus on closing the poverty-related attainment gap was sustainable beyond the current phase and half said it was sustainable to a great (23%) or moderate (27%) extent – see Table 26. Results were broadly consistent across all staff roles for this question (with the exception of support/other staff being more likely than other respondents to say they did not know).
| All | Head-teachers | Senior/middle leaders | Classroom teachers | Support/ other staff | |
|---|---|---|---|---|---|
| NET: Great/moderate extent | 50% | 51% | 53% | 45% | 45% |
| To a great extent | 23% | 24% | 23% | 18% | 23% |
| To a moderate extent | 27% | 27% | 30% | 27% | 22% |
| To some extent | 31% | 34% | 32% | 29% | 21% |
| Not very much | 8% | 7% | 8% | 9% | 7% |
| Not at all | 3% | 3% | 2% | 6% | 3% |
| Don’t know/not sure | 8% | 4% | 5% | 11% | 25% |
| Base (all) | 972 | 486 | 208 | 158 | 120 |
Respondents based in secondary schools were more likely than those in primaries to say that the focus on closing the poverty-related attainment gap is sustainable to a great/moderate extent (57% v 46%) – and when this was examined by staff seniority, secondary school headteachers/leaders were the most optimistic of all: 63% of this group felt the focus was sustainable compared to 47% of primary headteachers/leaders.
Those based in small towns/rural areas and the least deprived areas were less likely than others to say the focus was sustainable to a great/moderate extent (41% rural v 51% large urban and 57% other urban; 42% least deprived, v 60% second least deprived[26], 54% second most deprived[27] and 51% most deprived). This could reflect the earlier differences noted in relation to the extent to which approaches to equity had been embedded throughout the school (e.g. those based in schools with the highest proportions of pupils in quintiles 1 and 2 were more likely to say approaches were embedded, and also more likely to say the focus on closing the poverty-related attainment gap was sustainable).
Indeed, it is worth noting that respondents who reported an overall approach to achieving equity had been embedded within their school community were more likely than others to say the focus on closing the gap was sustainable: 41% of those who said approaches were embedded to a great extent said that the focus was sustainable to a great extent (compared to just 6% who said approaches were embedded only to some extent/not very much/not at all).
How schools are addressing sustainability of approaches
All headteachers and senior leaders were asked about in what ways, if any, their school is addressing the sustainability of their approach beyond the current phase of the ASF programme, and responses are outlined in Table 27. The most common approaches to sustainability selected from the list included building capacity among teaching staff (81%) and whole school approaches (77%), followed by development of spaces to meet local needs (69%) and focusing on upskilling of existing staff (64%). A majority mentioned building partnerships to support families (59%) and building leadership capacity (55%). Collaboration was also commonly highlighted – both with other schools (47%) and other organisations (43%) – as was transition planning (41%).
| % | |
|---|---|
| Building capacity among teaching staff to support high quality learning | 81% |
| Whole school approaches | 77% |
| Development of spaces (e.g. nurture spaces/flexible learning spaces) to meet locally identified needs | 69% |
| Focusing on upskilling existing staff | 64% |
| Building partnerships to support families | 59% |
| Building leadership capacity | 55% |
| Collaborating with other schools | 47% |
| Collaborating with other organisations (e.g. third sector partners) | 43% |
| Transition planning | 41% |
| Other (please specify) | 2% |
| Don’t know/not sure | 2% |
| None of the above – we are not addressing sustainability after the current phase of the programme | 1% |
| Base (all heads and senior leaders) | 589 |
Headteachers and senior leaders based in secondary schools were more likely than those in primary schools to mention building leadership capacity (75% v 51%) or transition planning (57% v 38%), while those in primaries were more likely to mention whole school approaches (79% v 68% among secondary staff).
There was also a general pattern by SIMD in that more of the approaches to sustainability were mentioned the higher the proportion of pupils in quintiles 1 and 2 there were in respondents’ schools. For example, among respondents from schools in the most deprived areas, 90% mentioned building teaching capacity, 90% mentioned whole school approaches and 74% mentioned building partnerships to support families.
Concerns about sustainability
All headteachers and senior leaders were asked an open-ended question about whether they have any concerns about the sustainability of approaches beyond the current phase of the ASF programme, and what the key challenges in this area were. Responses were coded into themes and the main issues raised are outlined in Table 28. Perhaps unsurprisingly, these tended to focus on concerns about funding issues, with seven in ten raising concerns related to this (72%) – including concerns about any reduction of PEF or funding cuts (36%) and comments about the initiatives that would be affected without PEF (28%). Over half (55%) also made a comment in relation to concerns about staffing and resources, most often that there would be changes/an impact on staffing (43%).
| % | |
|---|---|
| NET: Concerns/comments about funding issues | 72% |
| Reduction of PEF/funding/funding cuts | 36% |
| Training/initiatives/approaches would be affected with reduced PEF/funding | 28% |
| Issues regarding funding/budgets in general | 14% |
| Impact on resources | 6% |
| NET: Concerns about staffing/resourcing/time | 55% |
| Changes/impact on staffing | 43% |
| Lack of staff/staff issues affect approach | 10% |
| Concerns about being able to support children and/or families | 17% |
| Wider issues re poverty/cost of living issues | 6% |
| Base (all heads/senior leaders who provided a comment) | 463 |
The quotes below illustrate the type of feedback that headteachers and senior leaders gave about their concerns regarding sustainability:
“The challenges are ensuring there are enough adults to support the significant ASN needs of children within our schools, if this was to be addressed then there would be much more capacity to embed and sustain high quality learning and teaching approaches and interventions targeted at improving attainment”. Primary school, Headteacher
“Additional staff, counsellors and family support workers will go [if PEF ends] – this is a worry to me as I know I will not be able to support young people in the same way due to a lack of people on the floor. The teaching approaches learned will be sustainable”. Primary school, Headteacher
“Much of the positive progress has relied on additional staffing to support young people and facilitate an increase in their readiness to learn. Although there have been some cultural and systemic changes – for example around equipment, payments for activities and uniform – these are minor compared to the significant impacts on some young people for who poverty is a barrier to success”. Secondary school, Headteacher
“I genuinely fear lots of good work having to stop if funding is discontinued, given the current financial constraints. School staffing models are dictated by pupil numbers and ASNs. Without additionality linked directly to poverty I fear a lot of good work will discontinue. I would love to say that knowledge and skill development, of which there has been lots, will be enough, however without the additional staffing these funds allow, the current service will not be sustained, in my opinion”. Secondary school, Headteacher
Contact
Email: Joanna.Shedden@gov.scot