Planning Performance Statistics 2021/2022: Annual and Quarterly (October 2021 to March 2022)
Statistics on planning application decision-making timescales for 2021-2022. Data are collected as part of the Planning Performance Framework from local and planning authorities. Quarters 3 and 4 statistics are also published. Historic annual statistics back to 2017-2018 are presented.
Part of
6. Major Developments
Major developments include applications for developments of housing (50 or more homes or large sites where the main use is for housing), as well as other applications covering areas of development such as minerals, business & industry, waste management, electricity generation, freshwater fish farming, marine finfish farming, marine shellfish farming and other developments.
Classification between local and major developments depends on the particular development type. For example, housing developments are classed as major when the application is for 50 or more dwellings or for a site that exceeds two hectares, whereas electricity generation is classed as major when the capacity of the generating station is or exceeds 20 megawatts.
6.1. All Major Developments
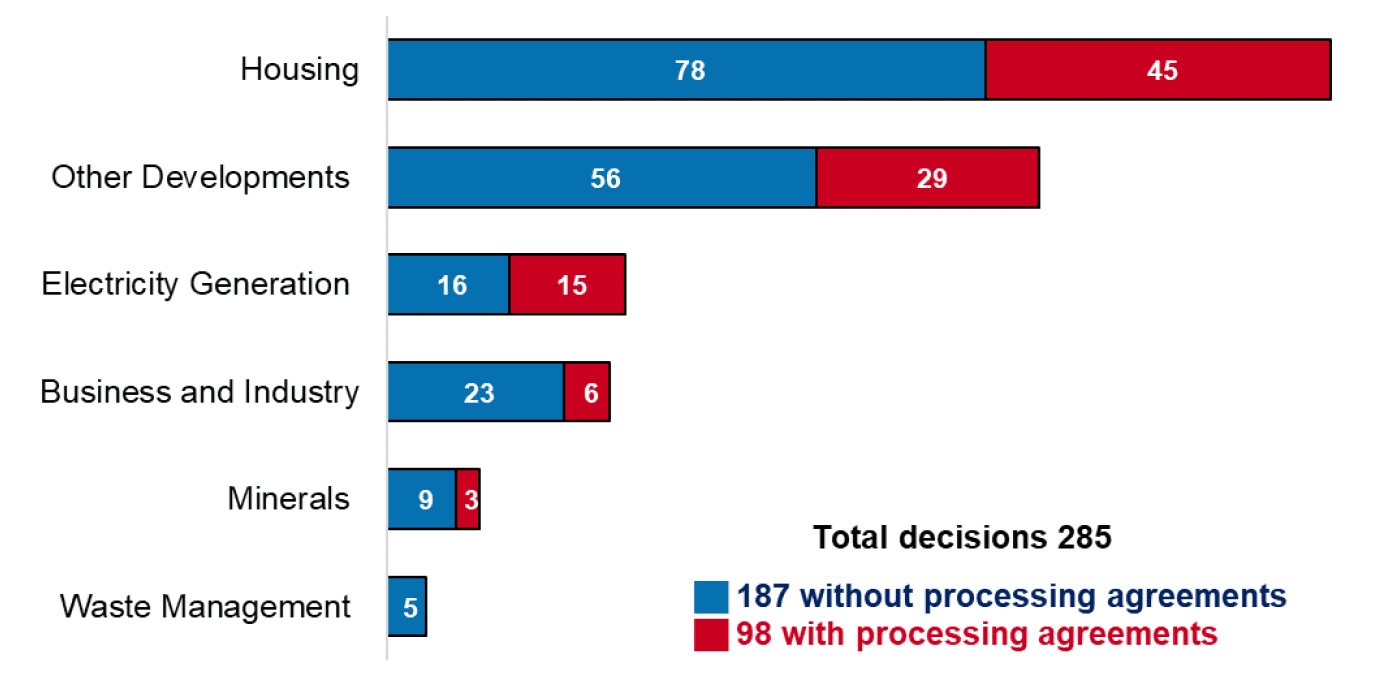
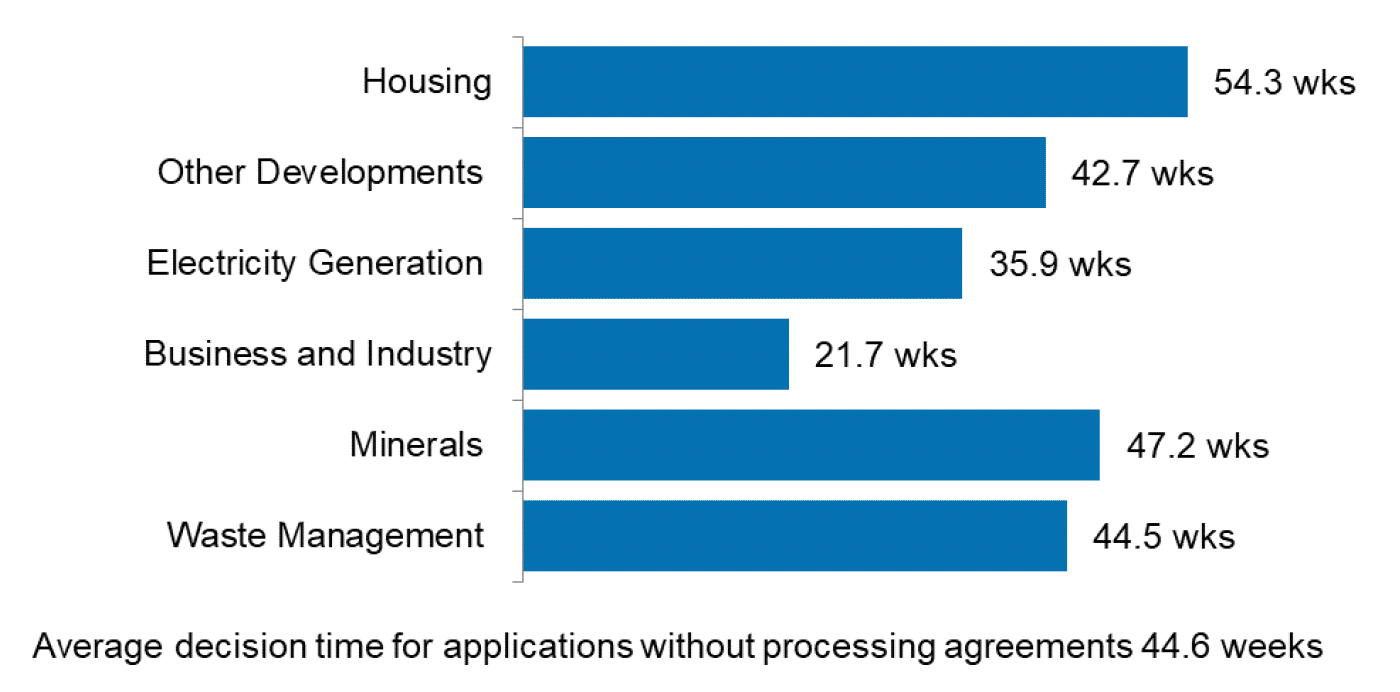
There were 285 major development applications determined in 2021/22, a slight rise on 2020/21. The longer term trend is declining numbers of major applications. Those not subject to processing agreements had an average decision time of 44.6 weeks. Average decision times have been longer in the years affected by pandemic-related pressures.
It is common for major applications to take a long time to be decided. This will depend on the details of the development. Very long decision times affect the average (mean). The middle value (median) of decision times for major applications was much lower than the average (44.6 wks) at 27.7 weeks.
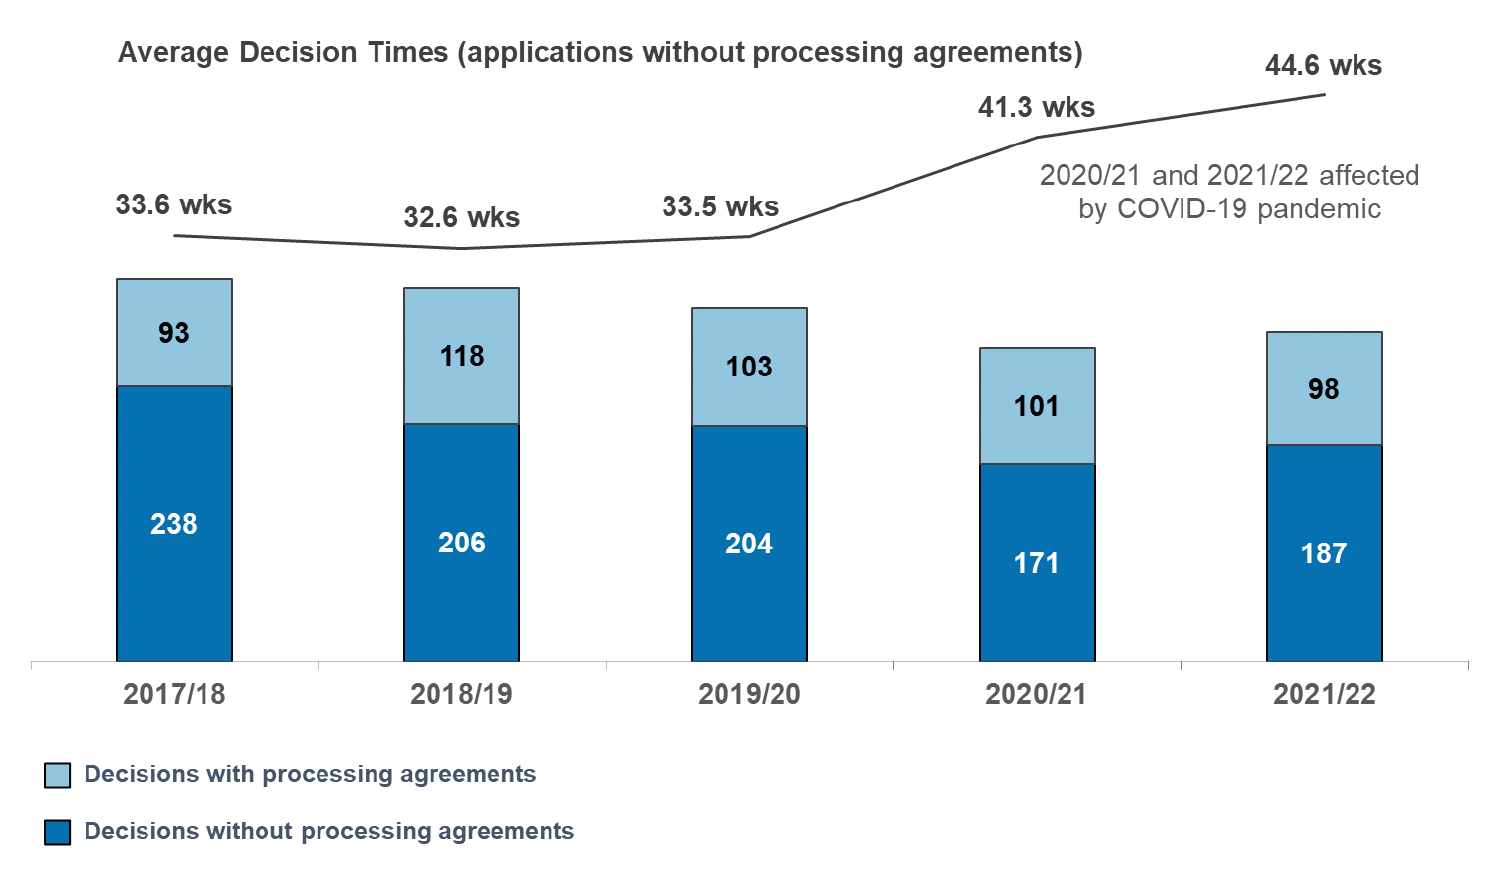
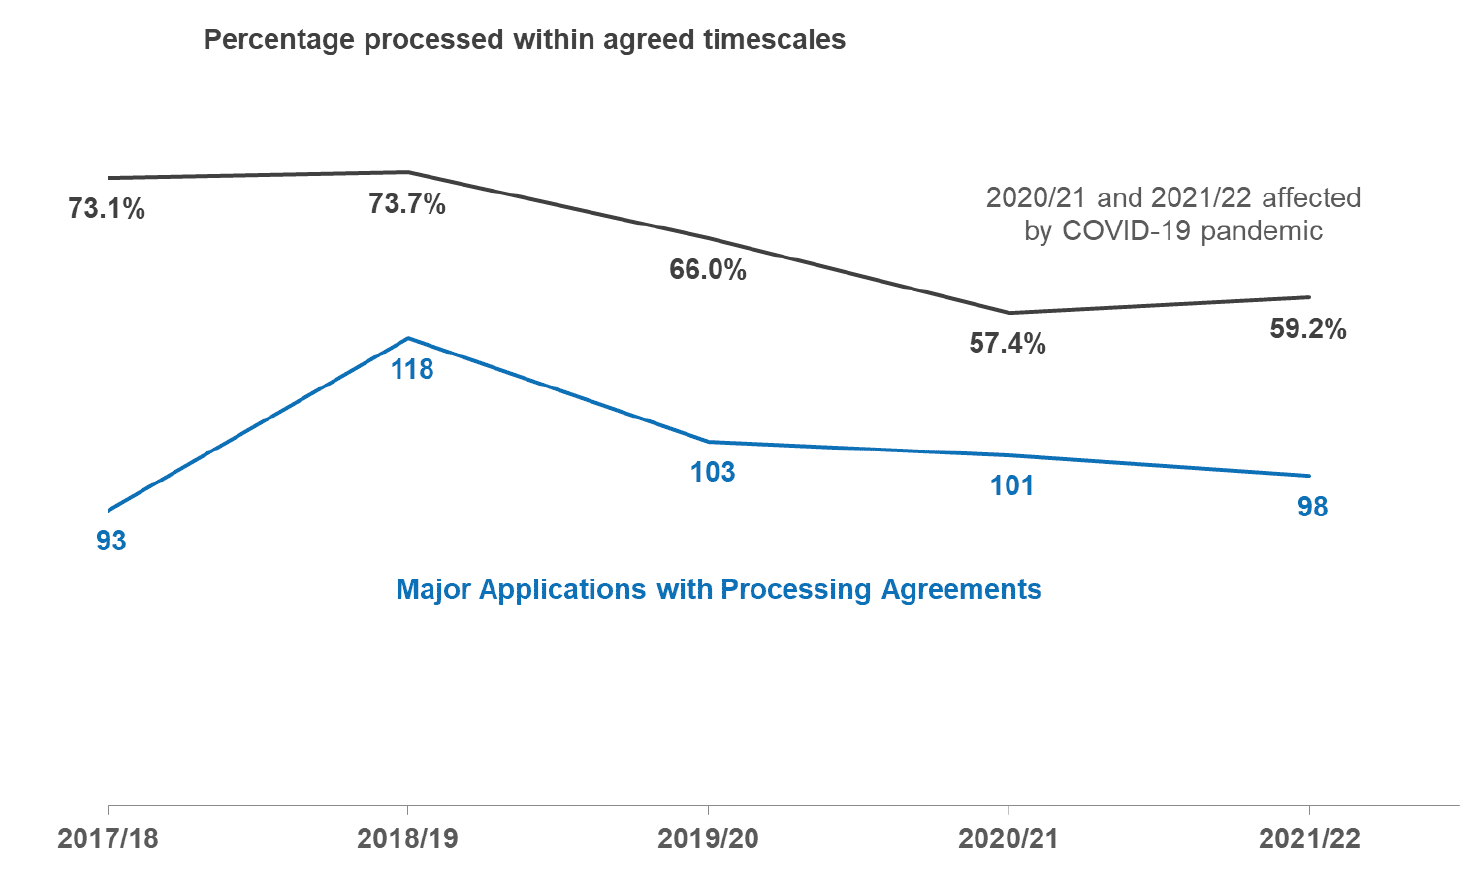
In 2021/22 there were 98 major development applications with processing agreements, 59% of these met agreed timescales that had been set between developers and local authorities. The percentage meeting timescales has been lower during the last two years than in prior years. Again, this is likely to be due to the unpredictable impacts of the pandemic. Processing agreements are typically used for about a third of all major development applications. This is a higher rate than for local applications.
6.2. Major Housing Developments
Major housing developments are those with 50 or more dwellings or with a site area of 2 hectares or more where the main use is for housing.
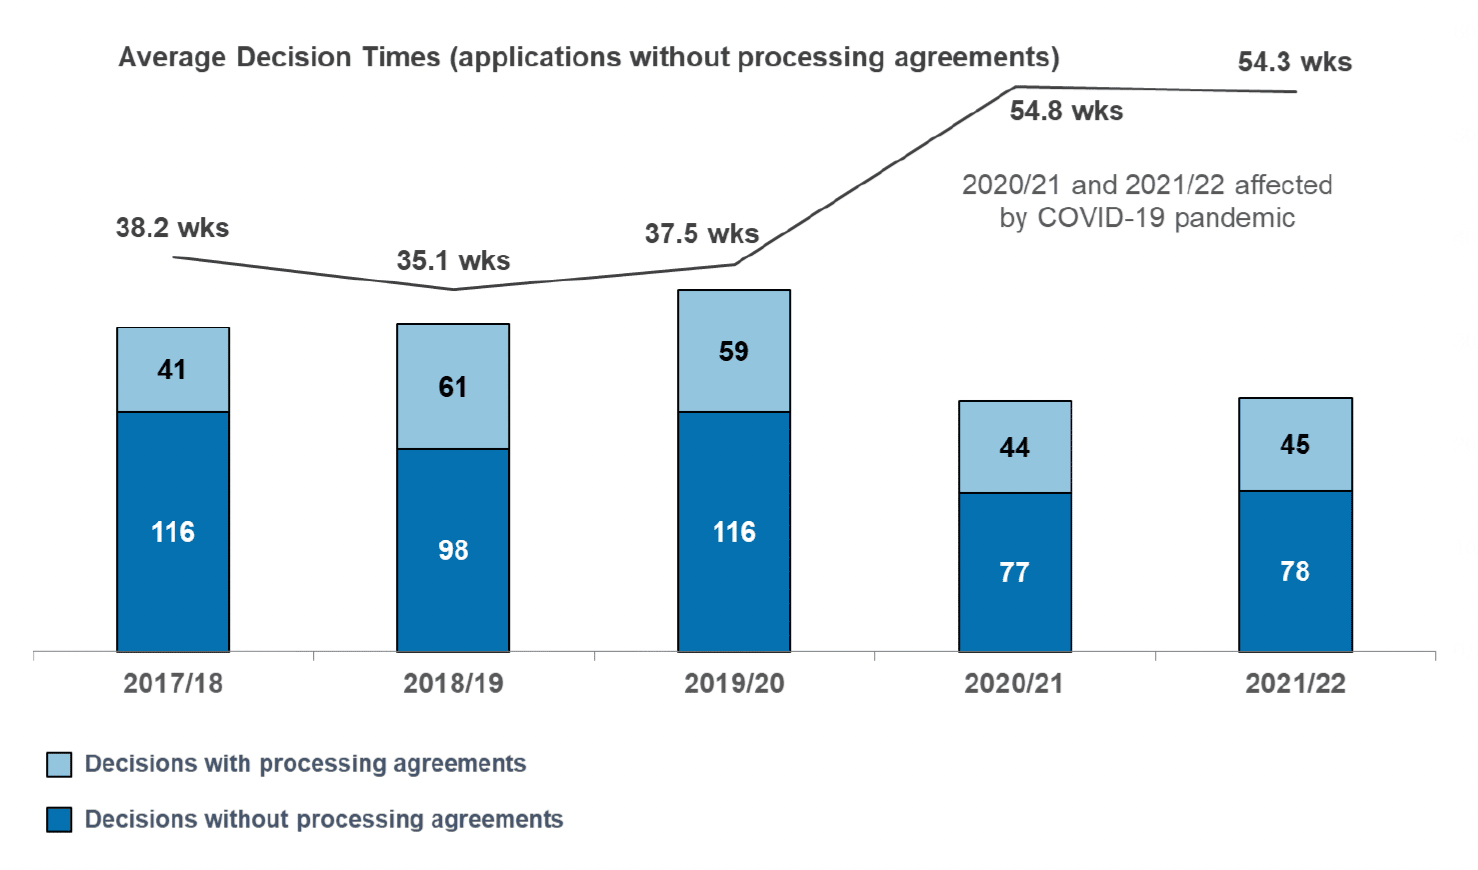
There were 123 major housing development applications determined in 2021/22. Applications have been relatively low in the past two years, falling by about a quarter from 2019/20. Those not subject to processing agreements had an average decision time of 54.3 weeks. This is markedly longer than in 2019/20 (37.5 wks).
Again, very long decision times affect the average (mean) for these developments. The middle value (median) of decision times for major applications was much lower than the average (54.3 wks) at 32.6 weeks.
There were 45 Major Housing development applications with processing agreements, under half (49%) of these met agreed timescales that had been set between developers and local authorities.
6.3. Major Business and Industry Developments
These include construction of a building or structure for any of the following: use as an office, for research and development of products or processes, for any industrial process or for use for storage or as a distribution centre. To be classed as major the gross floor space must exceed 10,000 square metres or the site must exceed 2 hectares.
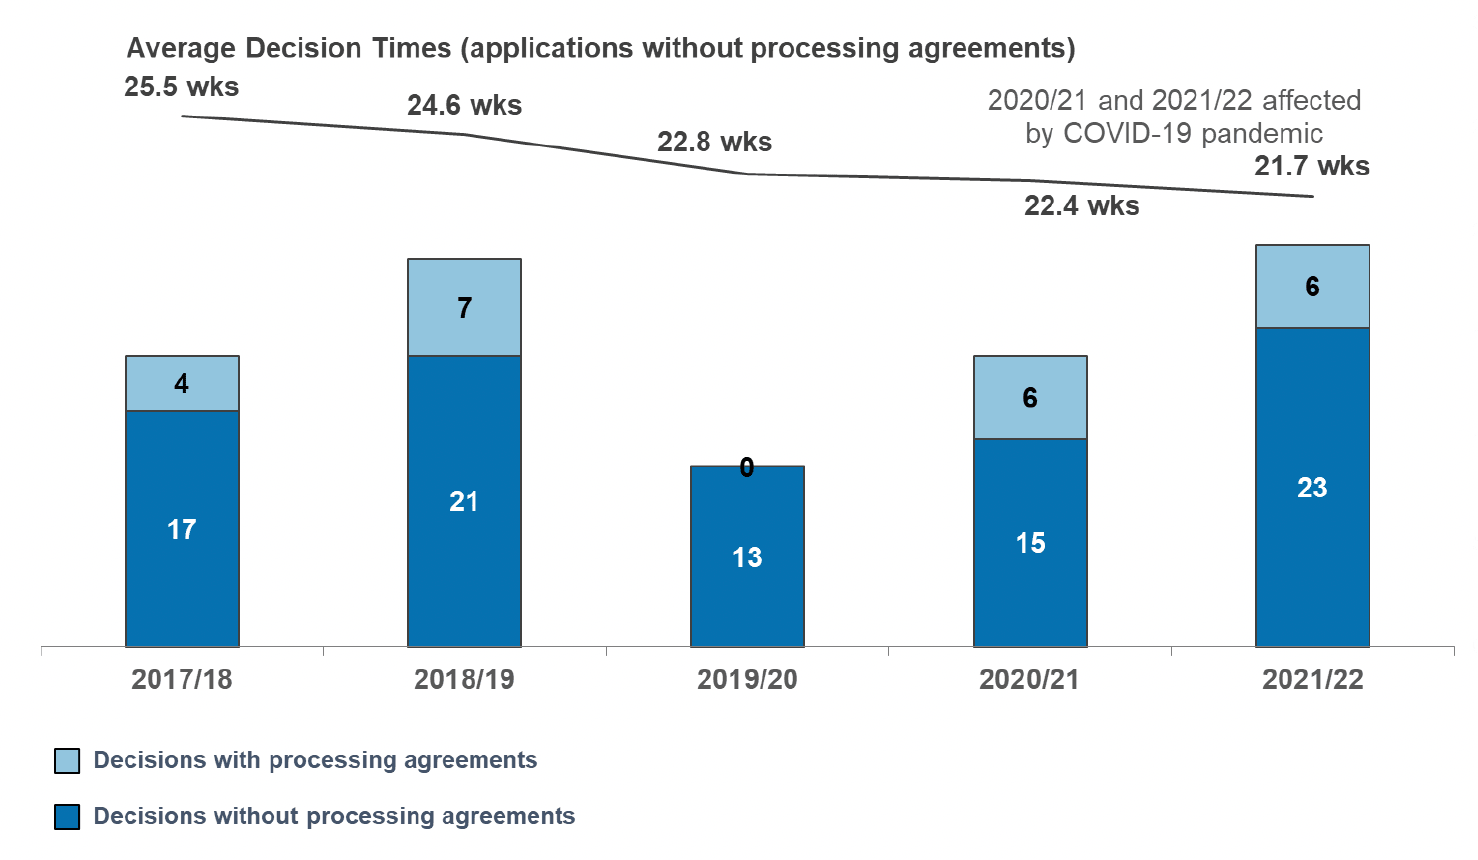
There were 29 major business and industry development applications determined in 2021/22, eight more than in the previous year. Those not subject to processing agreements had an average decision time of 21.7 weeks. Unlike the pattern for other types of development this was shorter than prior years.
There were six major business and industry development applications with processing agreements, 83.3% of these met agreed timescales that had been set between developers and local authorities.
6.4. Major Applications by Development Type
The shortest average decision time of 21.7 weeks was for business and industry developments (10% of all major developments). The longest average decision time was for housing applications (54.3 weeks, 43% of all major developments).
6.5. Major Applications by Planning Authority
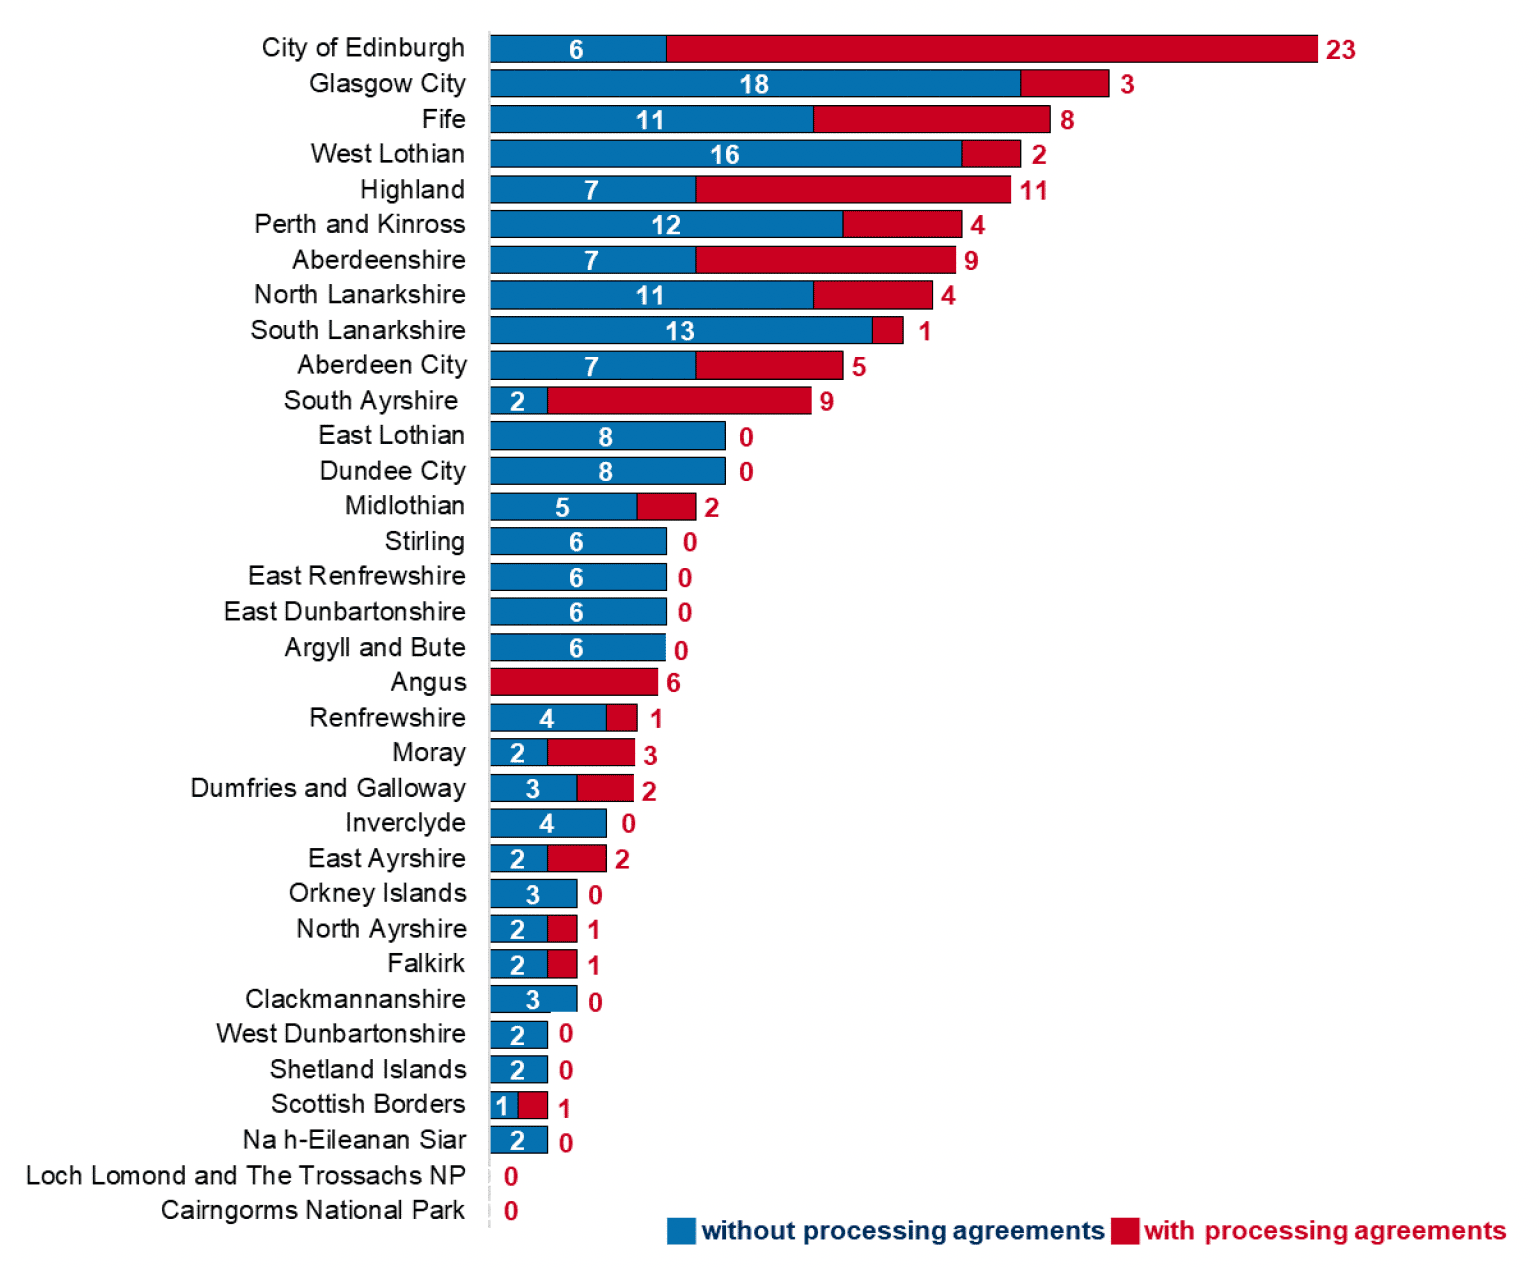
Numbers of decisions made for major developments are very small compared to those for local developments. Chart 17 shows the numbers by Planning Authority. Average decision times will vary widely and a single application can have a large effect on the average.
Contact
Email: Planning_Stats@gov.scot