Planning Performance Statistics 2021/2022: Annual and Quarterly (October 2021 to March 2022)
Statistics on planning application decision-making timescales for 2021-2022. Data are collected as part of the Planning Performance Framework from local and planning authorities. Quarters 3 and 4 statistics are also published. Historic annual statistics back to 2017-2018 are presented.
Part of
5. Local Developments
Local developments include applications for changes to houses and smaller developments for new housing. They also include applications covering areas of development such as minerals, business & industry, waste management, electricity generation, freshwater fish farming, marine finfish farming, marine shellfish farming, telecommunications, Approval of Matters Specified in Conditions (AMSCs) and other developments.
Some authorities use processing agreements where the developer and the authority agree on timescales for decisions. When an application is subject to a processing agreement it is not included in average decision time calculations.
5.1. All Local Developments
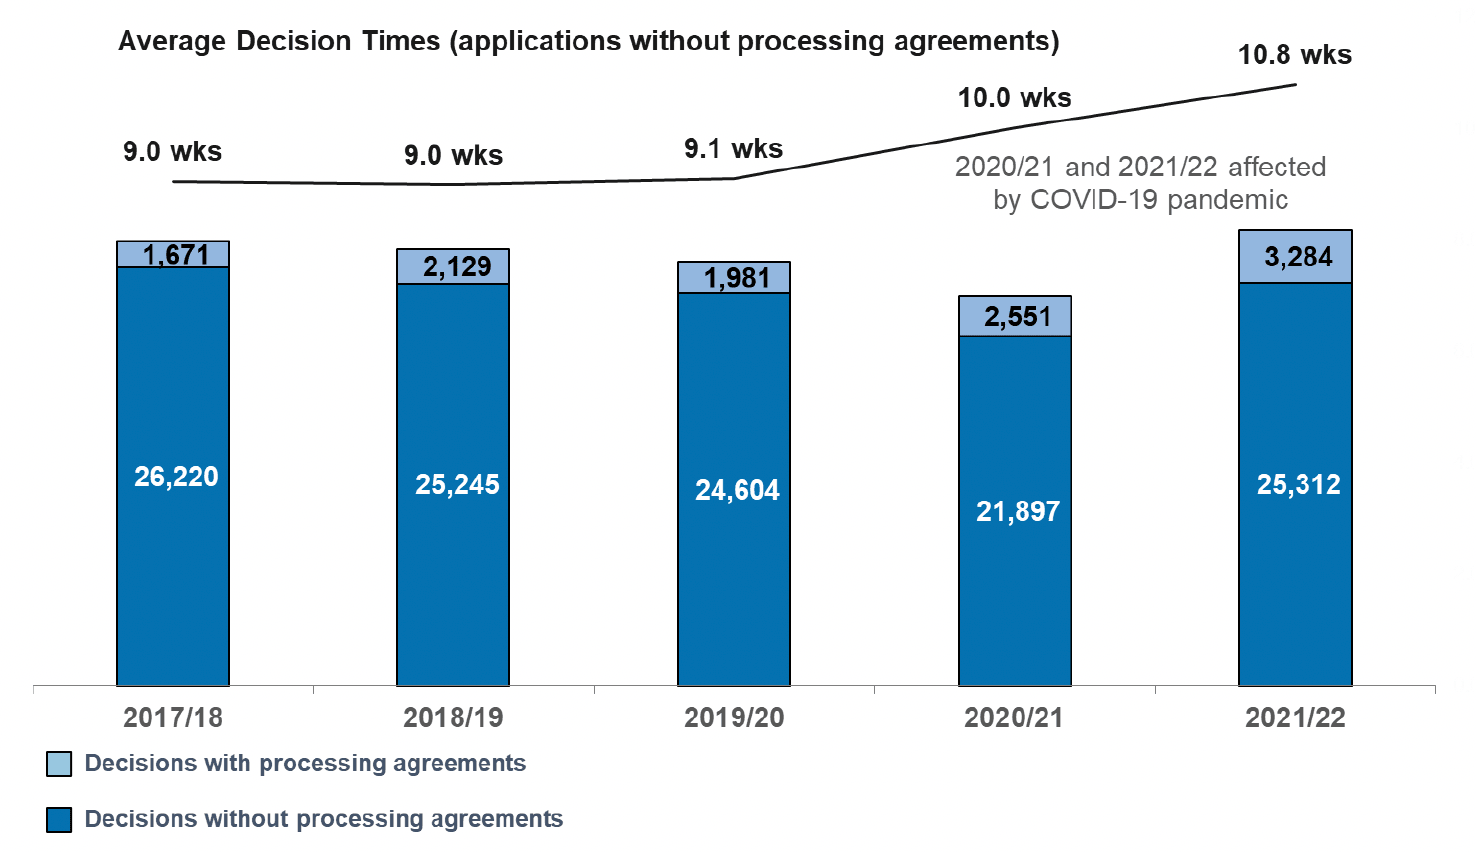
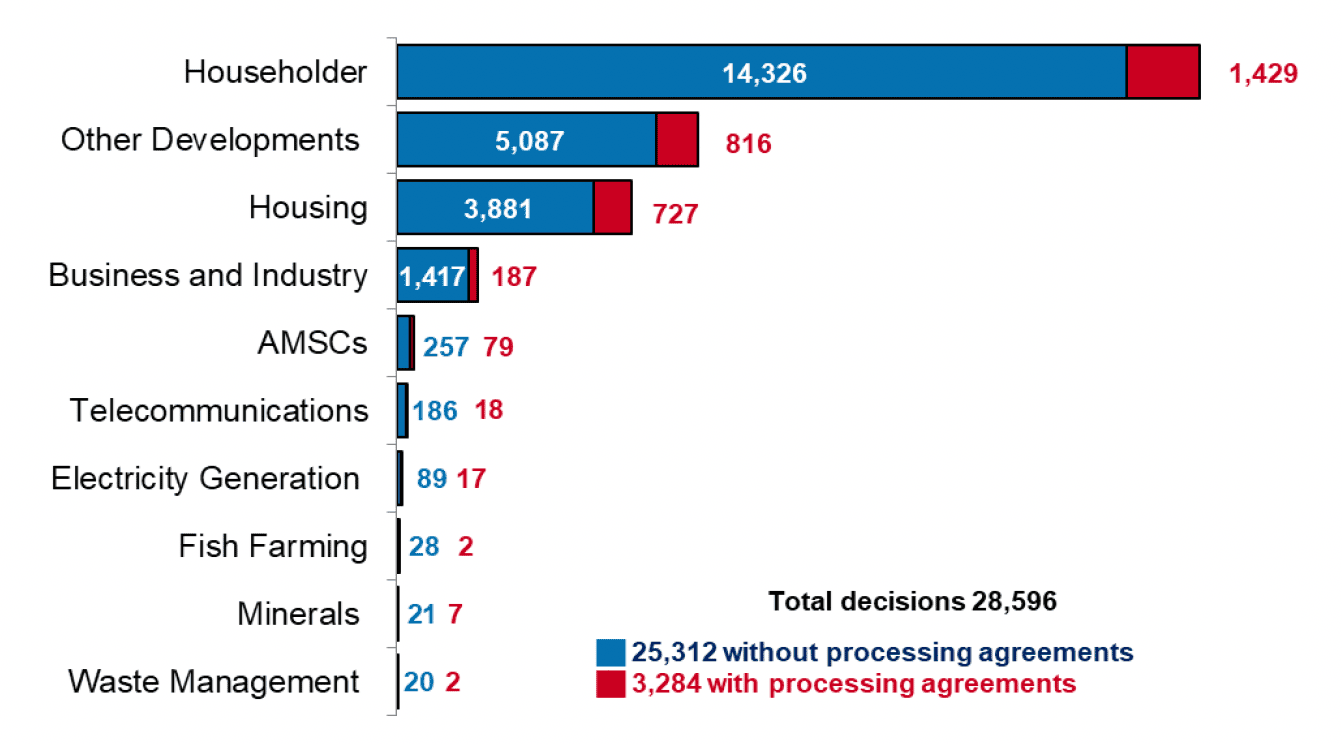
There were 28,596 local development applications decided in 2021/22, slightly higher than before the COVID-19 pandemic. This followed a dip in 2020/21 when numbers of applications were lower at the beginning of pandemic restrictions. Applications without processing agreements had an average decision time of 10.8 weeks. In 2019/20, before the pandemic, the average time was 9.1 weeks.
Stautory time period for local applications
Under planning regulations, authorities should determine applications for local developments within two months of the validation date. This is the date when the last piece of information on the content is received. More information is available in the planning circular on development management procedures.
View web page for planning series circular 3 2013 development management procedures
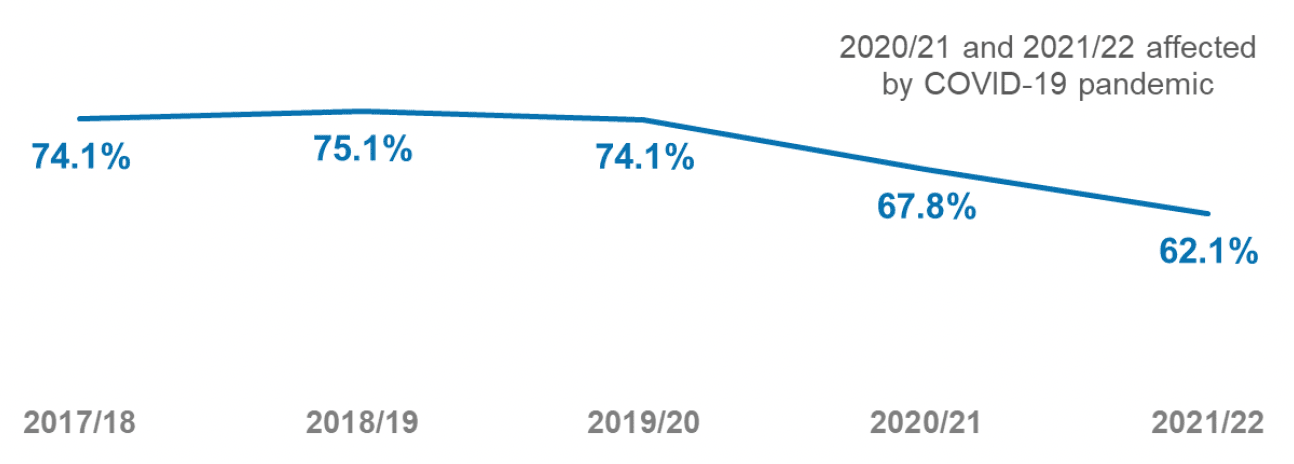
The percentage decided within two months in 2021/22 was 62%. This is lower than before the pandemic when around 74% were decided within two months. Where these applications were from householders making changes to their properties, the percentage was higher at 72%.
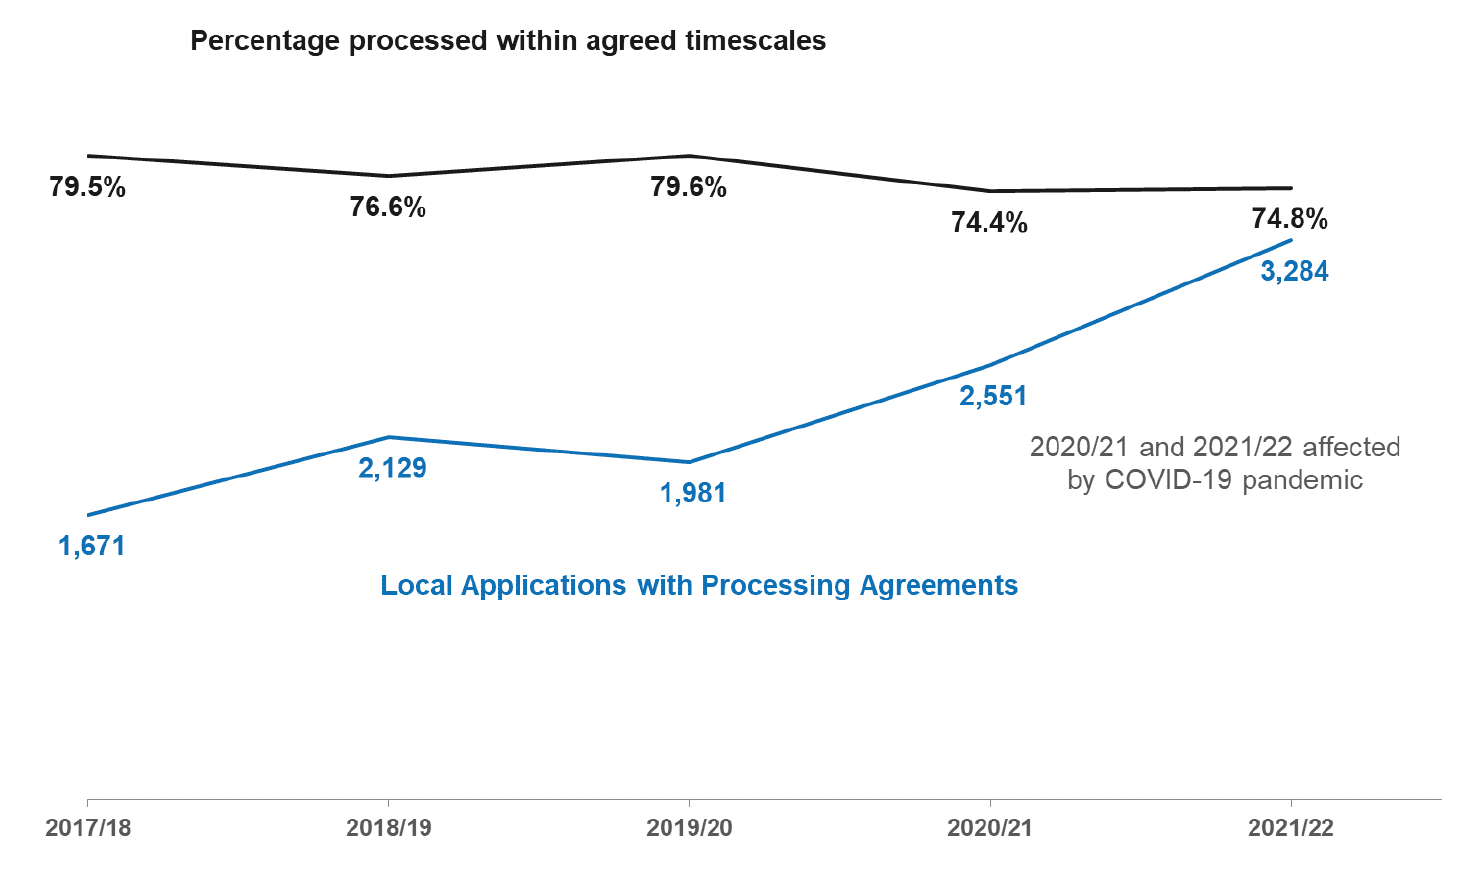
In 2021/22, there were 3,284 local development applications with processing agreements. Three quarters (75%) met agreed timescales that had been set between developers and planning authorities. There has been a rise in the number of local applications with processing agreements over the last two years. Some authorities reported increased use of processing agreements to help manage the impact of COVID-19 restrictions and delays.
5.2. Local Housing Developments
Local Housing developments are those that have less than 50 dwellings and a site area that is less than 2 hectares.
There was an increase in local housing applications to 4,608 in 2021/22 compared to the previous year. Over the longer term the numbers of these applications has been gradually falling.
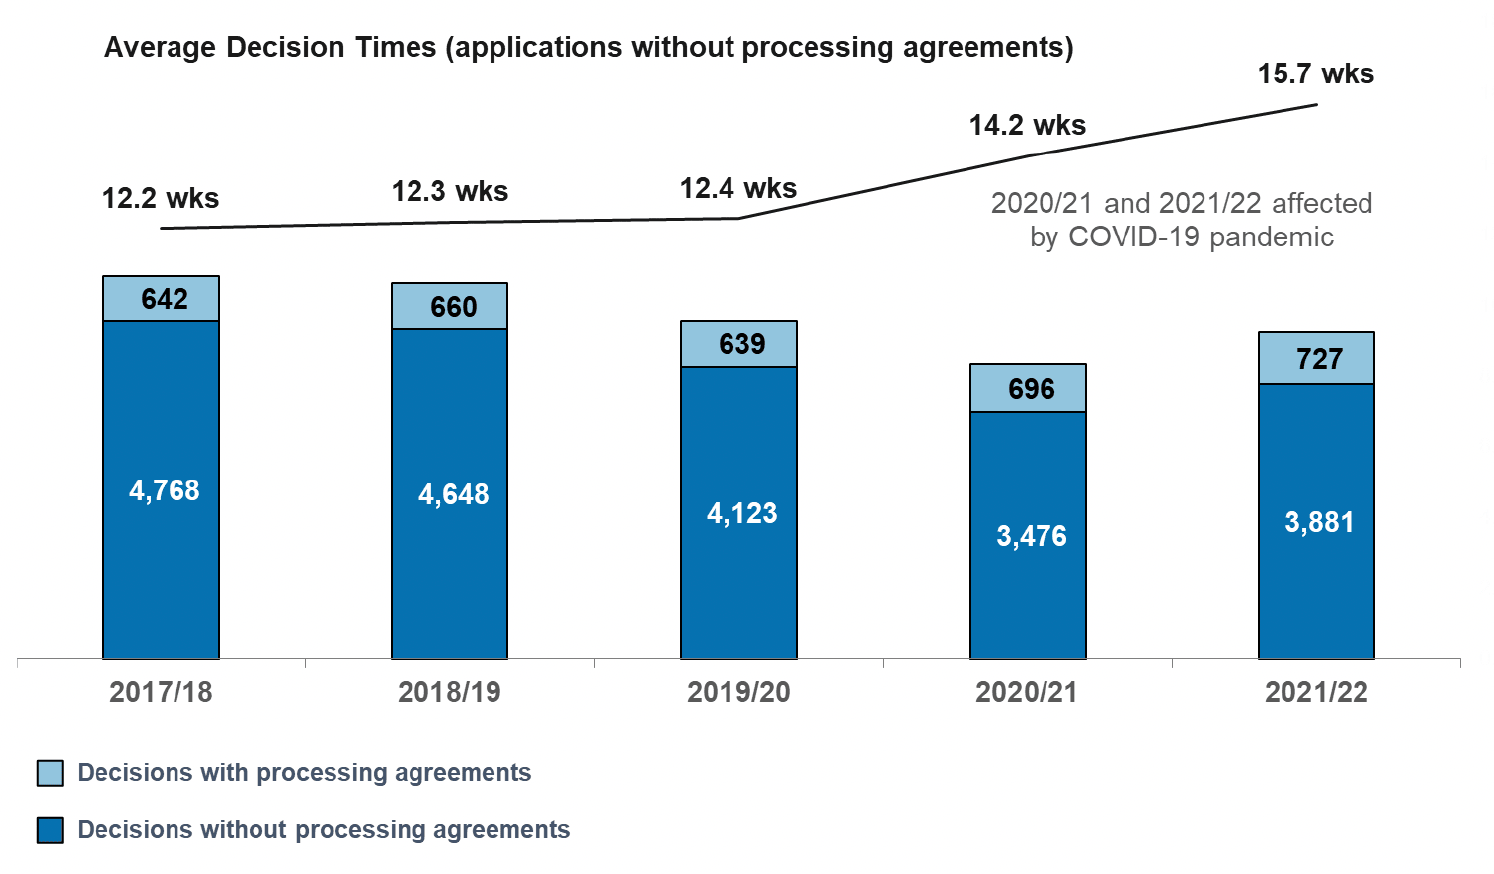
The applications not subject to processing agreements have had longer average decision times during 2020/21 and 2021/22. In 2021/22, the average time was 15.7 weeks and only 42% were decided within two months.
There can be some long decision times for local housing developments. Very long decision times affect the average (mean). The middle value (median) of decision times was lower than the average (15.7 wks) at 9.7 weeks.
727 local housing applications with processing agreements were determined. Two-thirds (66%) of these met timescales agreed between developers and local authorities.
5.3. Local Business and Industry Developments
Business and Industry developments include construction of a building or structure for any of the following: use as an office, for research and development of products or processes, for any industrial process or for use for storage or as a distribution centre. To be classed as local, the gross floor space must not be more than 10,000 square metres and the site area must be less than 2 hectares.
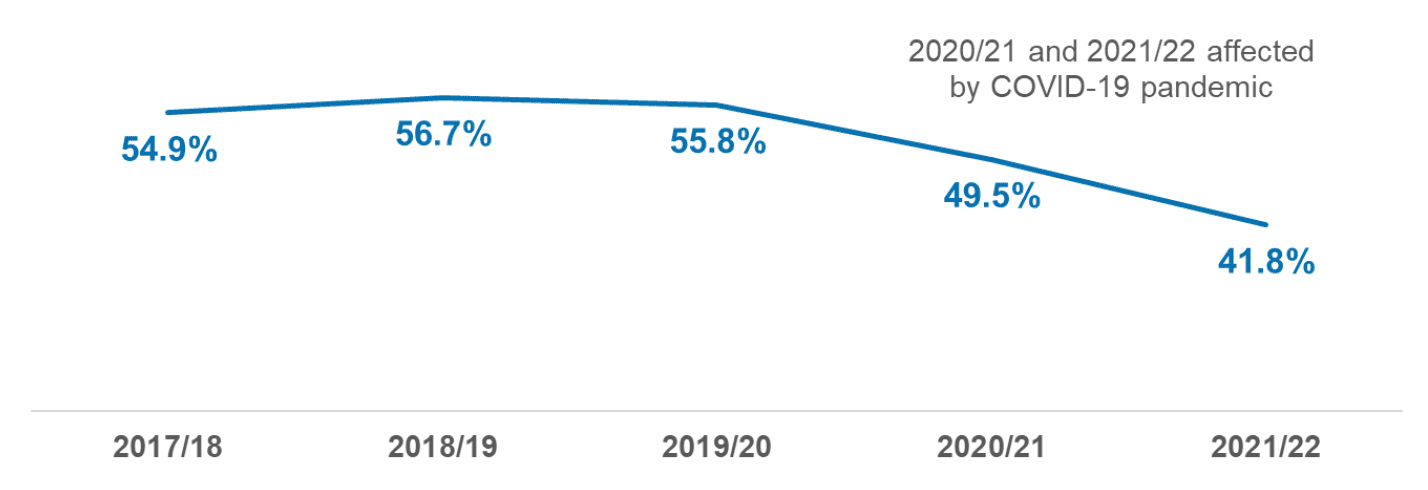
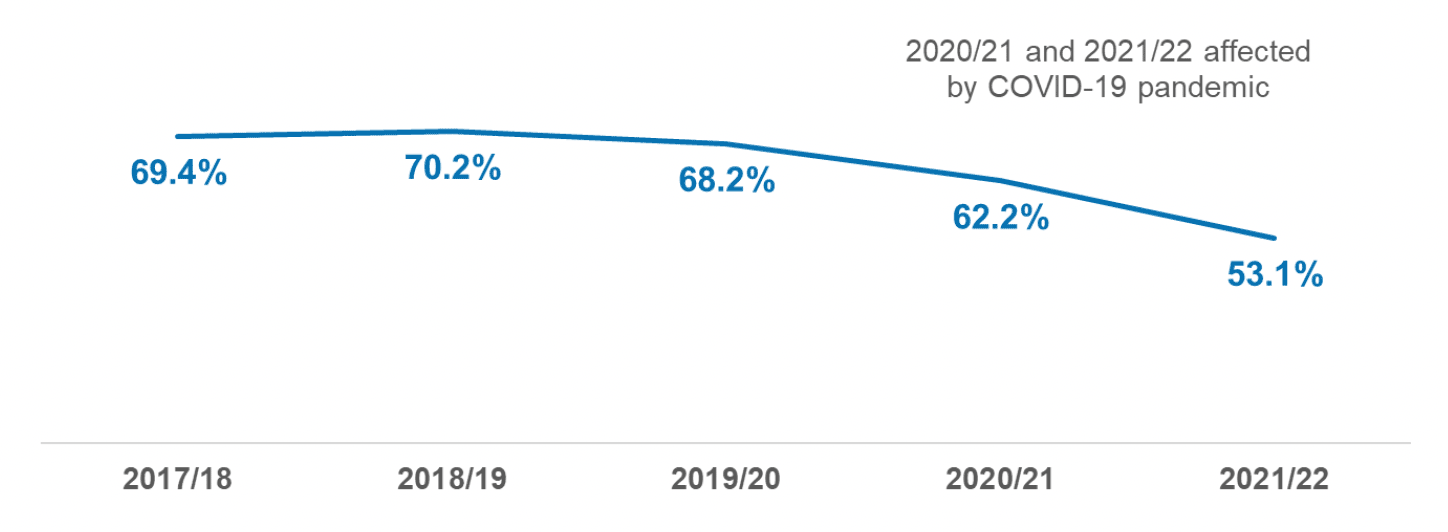
The number of local business and industry applications rose to 1,604 in 2021/22. There had been a declining trend over previous years. Average decision times for those applications not subject to processing agreements were longer in the years affected by pandemic-related pressures. The average decision time was 11.7 weeks in 2021/22. The percentage decided within two months fell to 53% in 2021/22.
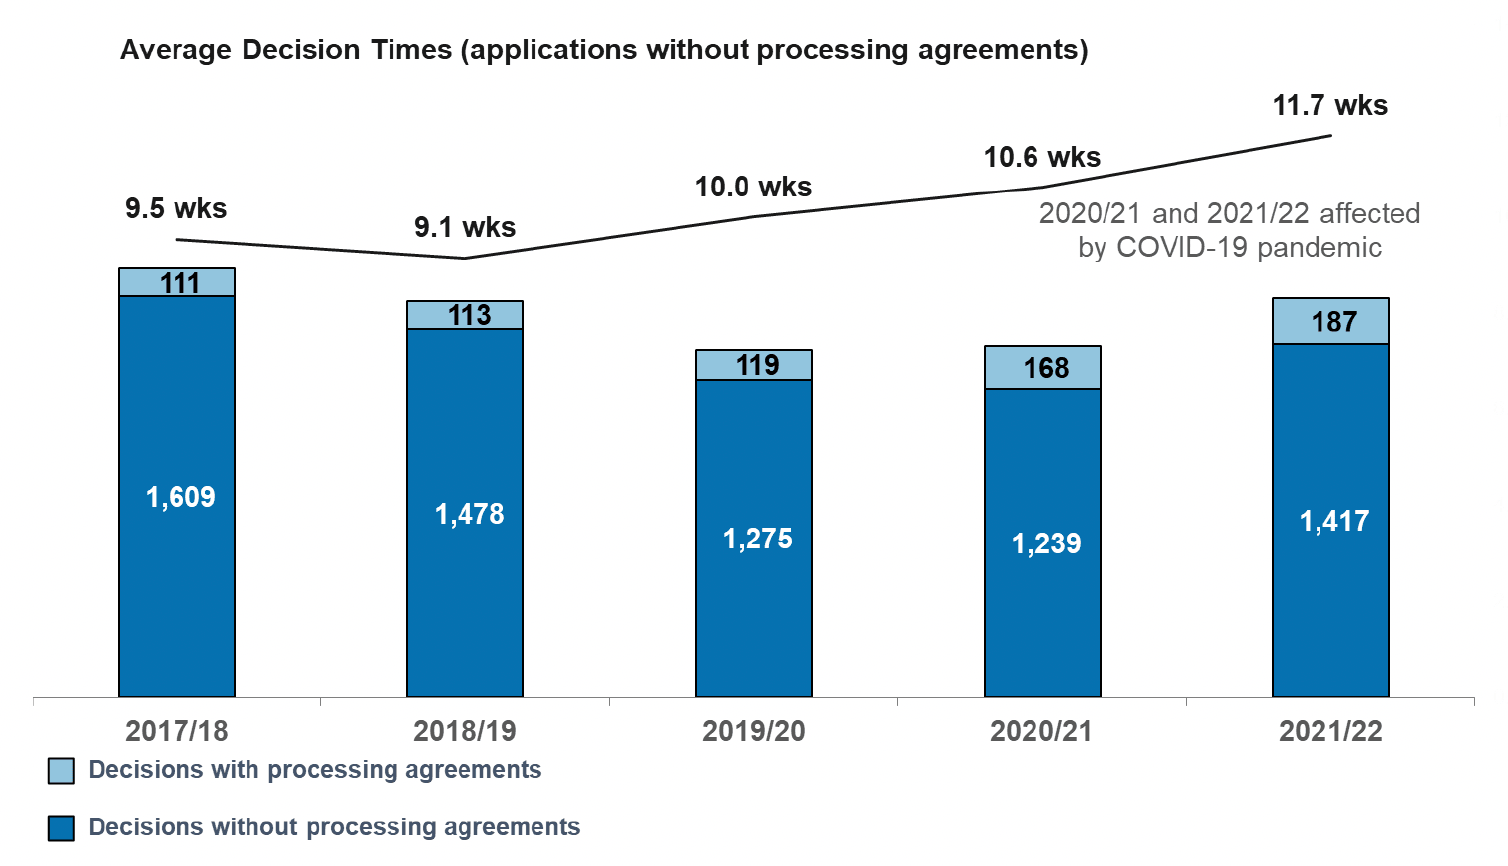
187 local business and industry applications with processing agreements were determined. Two-thirds (66%) of these met agreed timescales that had been set between developers and local authorities.
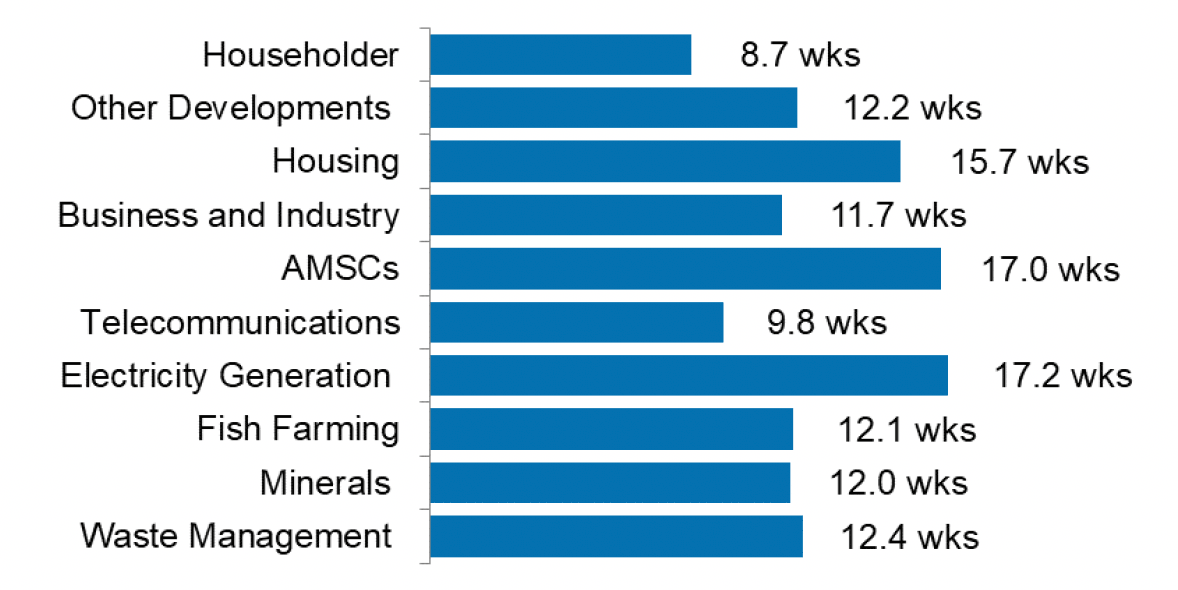
5.4. Local Applications by Development Type
More than half (55%) of all local applications were from householders making changes to their properties. These applications had the shortest average decision time of 8.7 weeks for those without processing agreements.
5.5. Local Applications by Planning Authority: Average decision time
Chart 10 shows the average decision times for local developments without processing agreements. This has been ordered by the number of decisions in each planning authority.
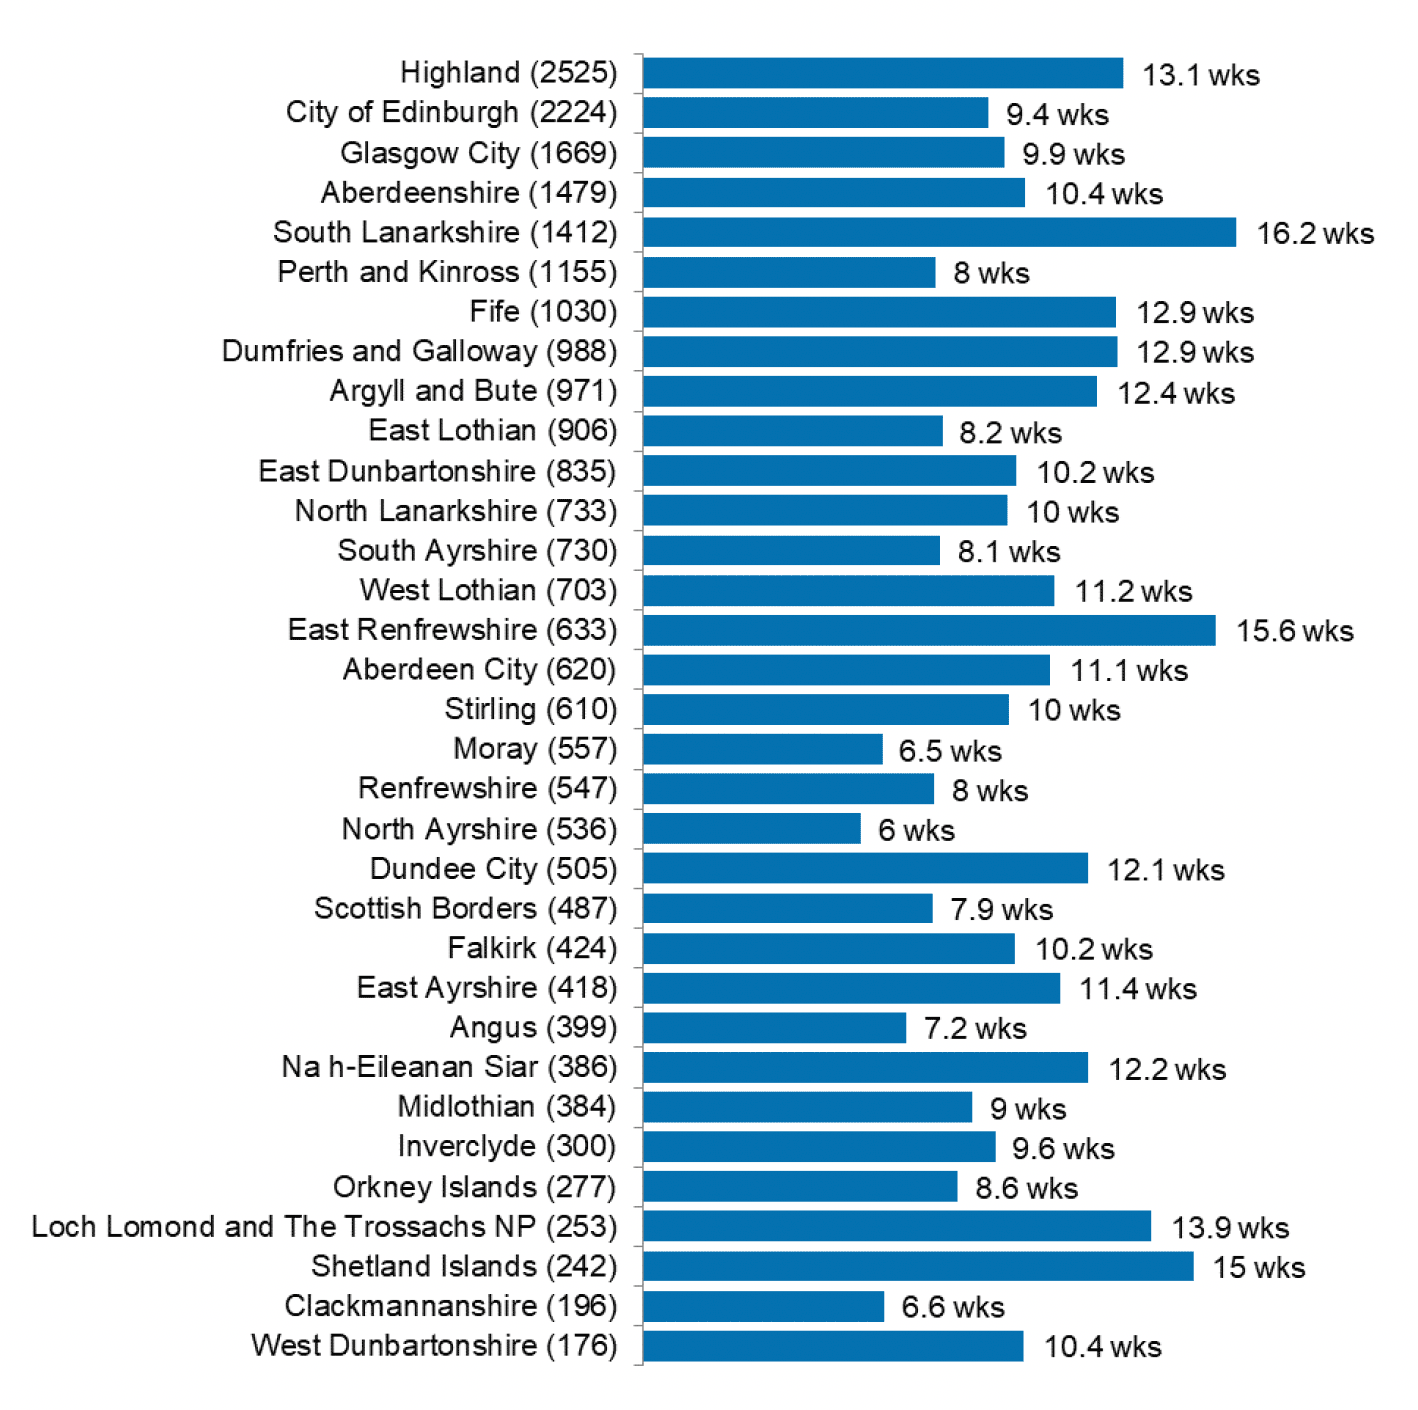
The number in brackets is the number of local development decisions not subject to processing agreements by planning authority.
The number of applications and average decision time for the Cairngorms National Park has not been shown in Chart 10. Cairngorms are notified of applications which have been made to those planning authorities within the National Park boundaries. Cairngorms National Park may then decide to call applications in for their determination. This can cause longer decision times.
Contact
Email: Planning_Stats@gov.scot