Planning Performance Statistics 2021/2022: Annual and Quarterly (October 2021 to March 2022)
Statistics on planning application decision-making timescales for 2021-2022. Data are collected as part of the Planning Performance Framework from local and planning authorities. Quarters 3 and 4 statistics are also published. Historic annual statistics back to 2017-2018 are presented.
Part of
Annex A: Yearend 2021/22 Key Findings
1. Local Developments
1.1. All Local Developments
There were 13,565 decisions on local developments in the last two quarters of 2021/22. This was slightly higher than the same period in 2019/20. In 2021/22 the pattern over quarters returned to highest numbers in Q1 (Apr to Jun) with numbers falling each subsequent quarter. The average decision time for applications not subject to processing agreements rose in Q3 and Q4 to 11.7 weeks in Q4. Pressures due to the pandemic continued to affect Authorities.
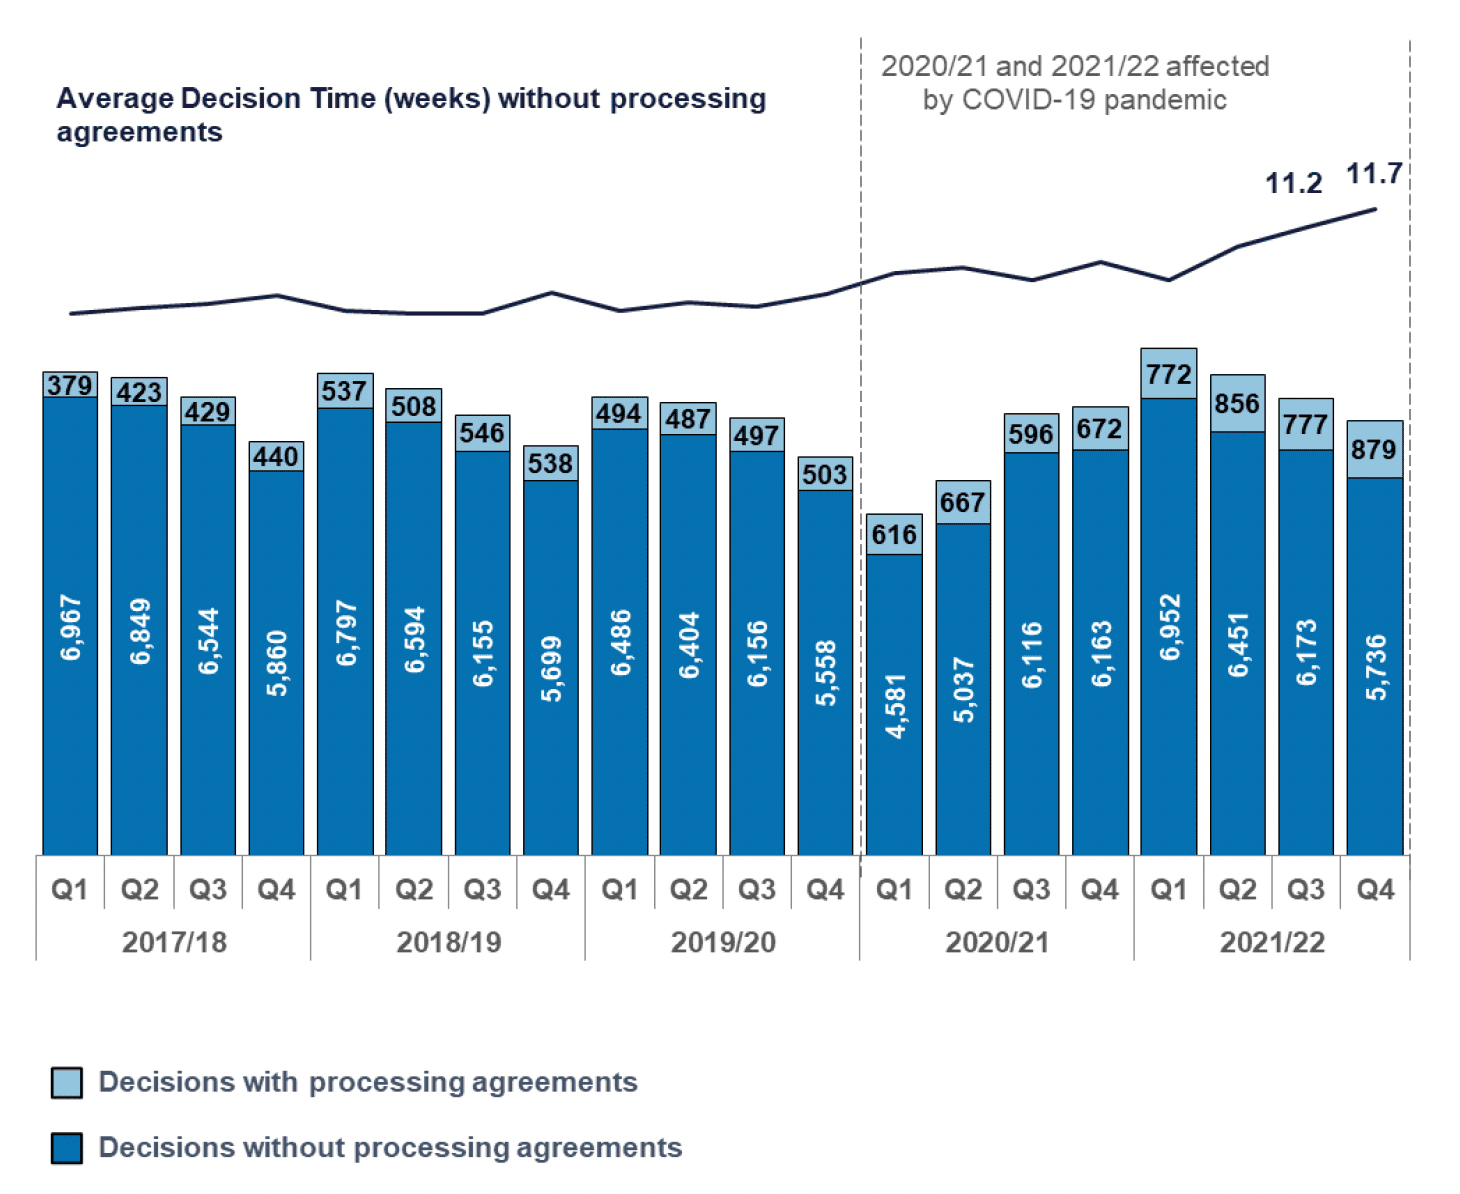
In quarter three there were 777 local development applications with processing agreements, three-quarters (74%) met agreed timescales that had been set between developers and local authorities. In quarter four there were 879 with 72% meeting the agreed timescales. Some authorities continued to use more processing agreements for local applications than had been used in the past.
1.2. Local Housing Developments
There were 1,935 local housing developments not subject to processing agreements decided during the last two quarters of 2021/22. This was a return to the levels of 2019/20. The average decision time rose in Q3 and Q4 to 17.1 weeks in Q4. The percentage of decisions made in less than two months was 43% in Q3 and fell to a low of 40% in Q4. Almost two thirds of 362 applications with processing agreements met agreed timescales.
2. Applications for Major Developments
2.1. All Major Developments
There were 159 decisions on major developments in the last two quarters of 2021/22. The average decision times for Q3 and Q4 returned to similar values as those seen prior to the COVID-19 pandemic.
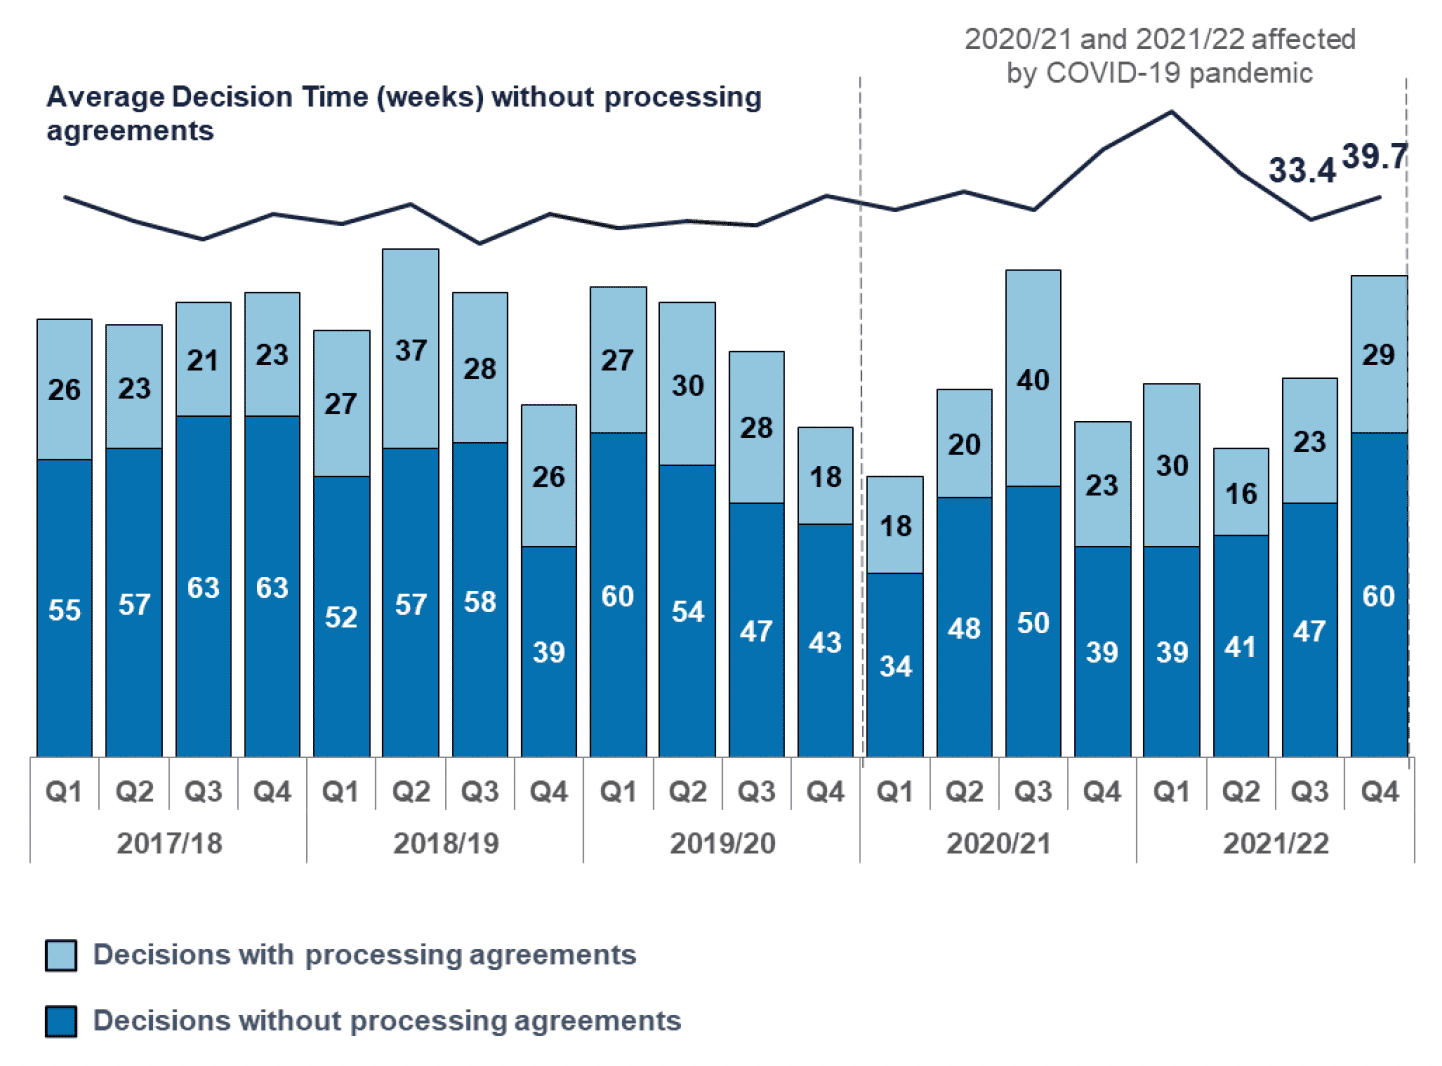
In quarter three there were 23 major development applications with processing agreements, less than half (48%) met agreed timescales that had been set between developers and local authorities. In quarter four there were 29, 62% meeting the agreed timescales.
2.2. Major Housing Developments
There were 47 major housing developments not subject to processing agreements decided during the last two quarters of 2021/22. The average decision times were 36.9 weeks in Q3 and 46.1 weeks in Q4. These were more in line with pre-pandemic decision times. There were 27 applications with processing agreements and timescales were met for 36% in Q3 and 63% in Q4.
Contact
Email: Planning_Stats@gov.scot