Bird stomach contents analysis - final report: Goosander and Cormorant diet on four Scottish rivers 2019 to 2020
This study analysed the stomach contents of goosanders and cormorants collected from the Rivers Tweed, Dee, Nith and Spey during 2019 and 2020 in order to to assess whether there was evidence of substantial changes in the diets of these species of fish-eating birds since the 1990s.
5. Estimated Salmon length frequencies
(a) Smolt run period
Not all historical length frequencies for Salmon were available and so comparisons were made between the current smolt run period samples from spring 2019 and those from similar times of year in 1991, 1995 and 1996 (see Table 14).
| River | Bird species | Sample date | No. Salmon | Fish length: range (mm) |
|---|---|---|---|---|
| Dee | Goosander | Mar/May 2019 | 142 | 39 - 109 |
| Spring 1996 | 26 | 44 – 142 | ||
| Mar/Apr 1995 | 70 | 48 – 127 | ||
| Nith | Goosander | Mar/May 2019 | 22 | 52 – 112 |
| Mar/Apr 1995 | 17 | 52 – 127 | ||
| Tweed | Goosander | Apr/May 2019 | 21 | 64 – 148 |
| April 1995 | 56 | 52 – 142 | ||
| April 1991 | 44 | 72 - 144 | ||
| Spey | Goosander | Mar/Apr 2019 | 33 | 52 – 133 |
| April 1996 | 41 | 36 – 127 | ||
| Tweed* | Cormorant | Apr/May 2019 | 39 | 70 – 112 |
| Mar/Apr 1995 | 19 | 59 – 142 |
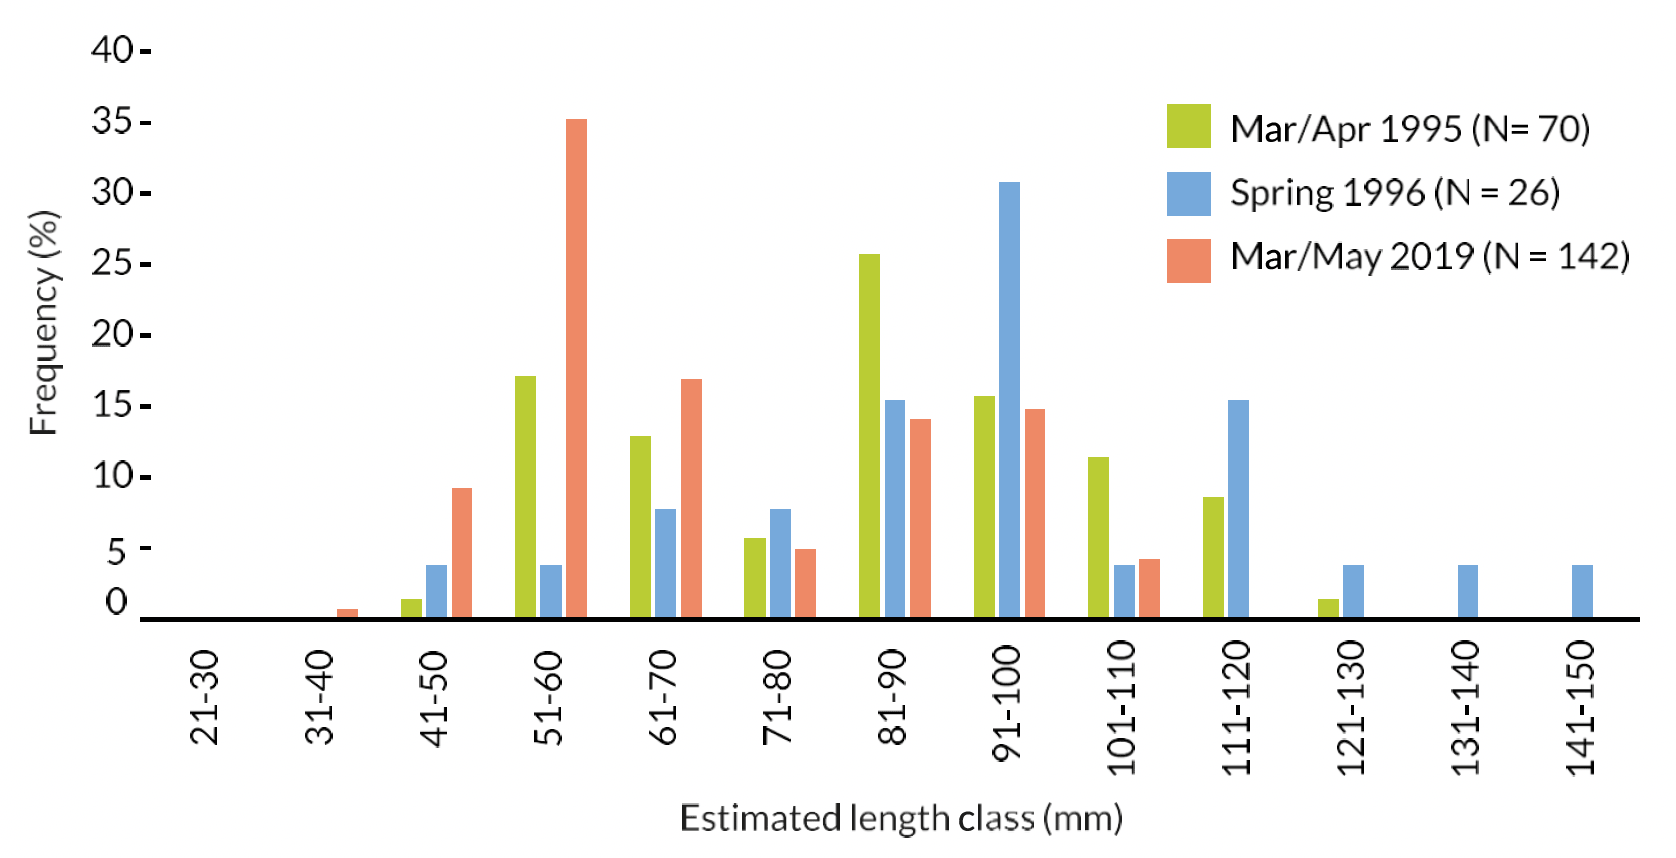
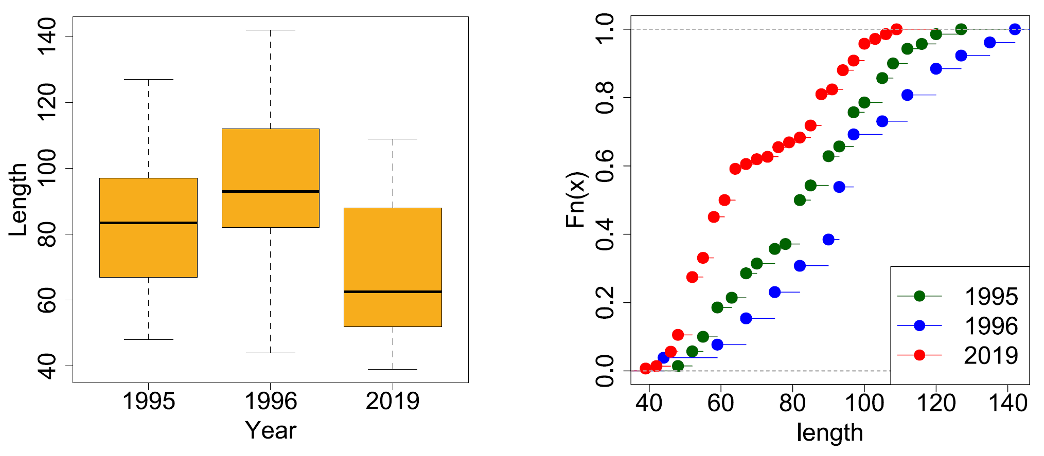
5a.1 River Dee Goosanders
Salmon from the 2019 R. Dee Goosander sample were significantly smaller than those recorded from the spring 1996 sample (K-S test, D = 0.45, P = 1.26e-13). These Salmon from the 2019 R. Dee Goosander sample were also significantly smaller than those recorded from the Mar-Apr 1995 sample (K-S test, D = 0.32, P = 1.12e-13).
The frequency distributions of the estimated Salmon lengths for these three Dee Goosander samples are shown in Figure 23, boxplots for them in Figure 24a, and ecdf plots in Figure 24b. As can be seen in the boxplots, Salmon in the stomachs of Dee Goosanders in 2019 had a median length of 63mm, the median length of the Mar-April 1995 sample was 2cm longer at 83mm, and that for the spring 1996 sample was 3cm longer at 93mm.
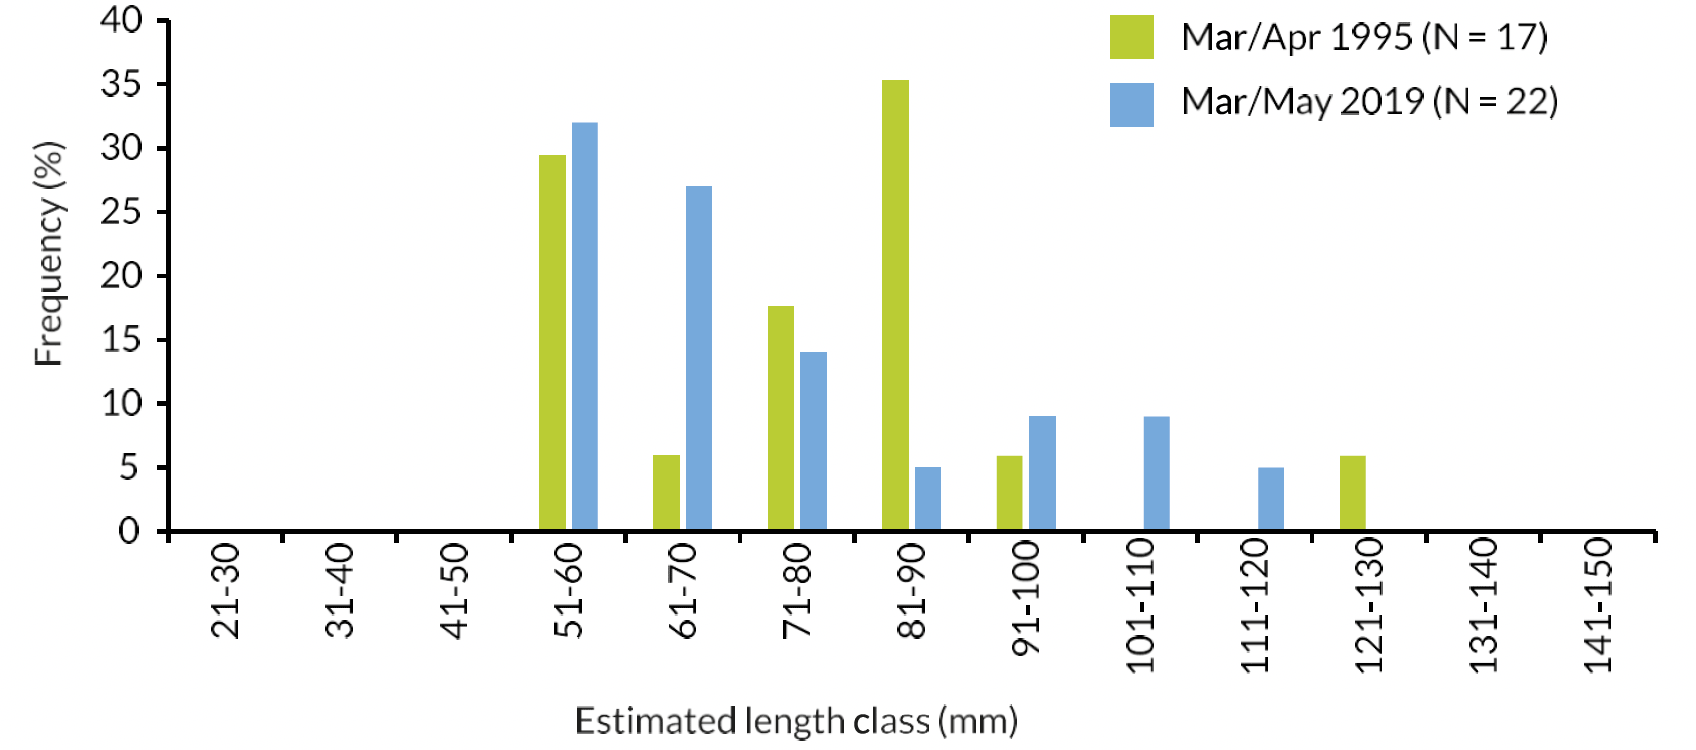
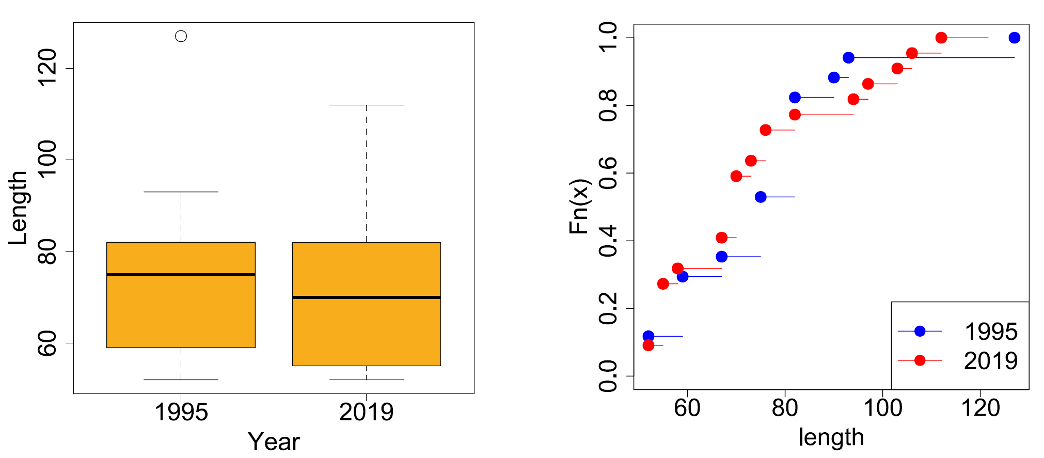
5a.2 River Nith Goosanders
Salmon from the 2019 R. Nith Goosander sample were not significantly different in length to those recorded from the Mar-Apr 1995 sample (K-S test, D = 0.17, P = 0.21).
The frequency distributions of the estimated Salmon lengths for these two Nith Goosander samples are shown in Figure 25, boxplots for them in Figure 26a, and ecdf plots in Figure 26b. As can be seen in the boxplots, Salmon in the stomachs of Nith Goosanders in 2019 had a median length of 70mm, the median length of the Mar-April 1995 sample was 0.5cm longer at 75mm.
5a.3 River Tweed Goosanders
Salmon from the 2019 R. Tweed Goosander sample were not significantly different in length than those recorded from the April 1995 sample (K-S test, D = 0.20, P = 0.20). These Salmon from the 2019 R. Dee Goosander sample were however significantly smaller than those recorded from the April 1991 sample K-S test, D = 0.48, P = 6.96e-06).
The frequency distributions of the estimated Salmon lengths for these three Tweed Goosander samples are shown in Figure 27, boxplots for them in Figure 28a, and ecdf plots in Figure 28b. As can be seen in the boxplots, Salmon in the stomachs of Tweed Goosanders in 2019 had a median length of 79mm, the median length of the April 1995 sample was 3mm longer at 82mm, and that for the April 1991 sample was 2.5cm longer at 104mm.
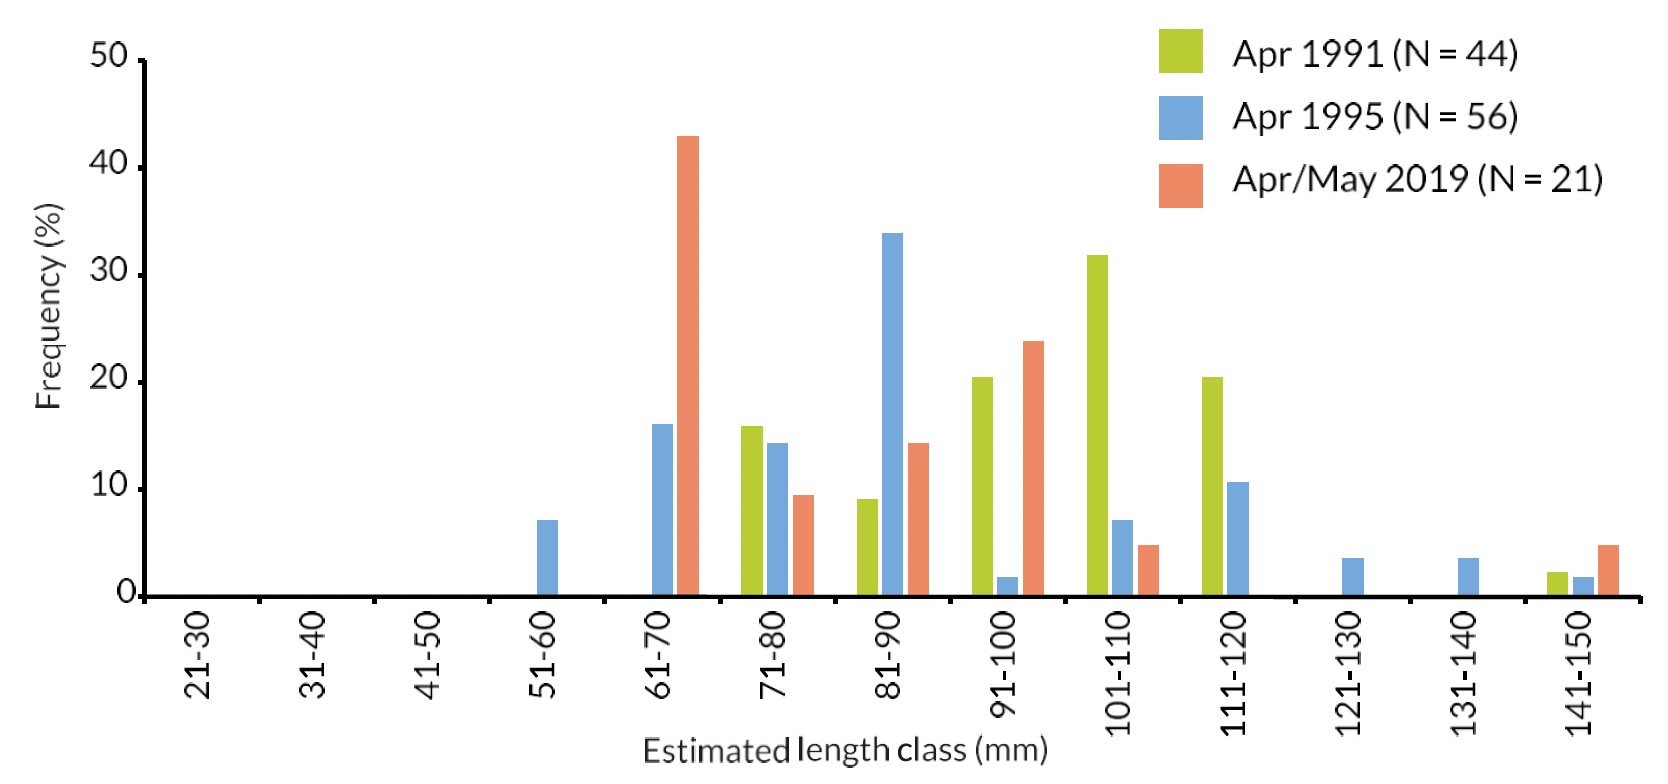
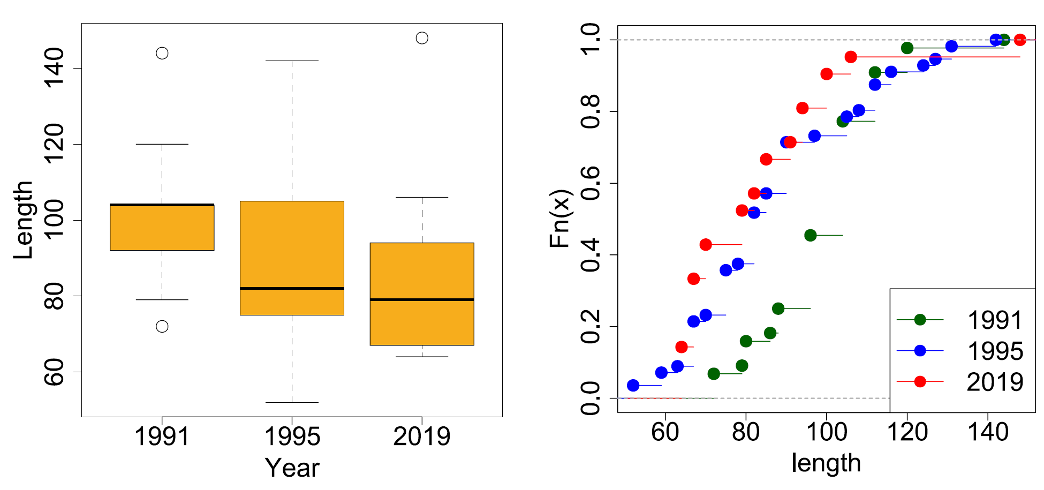
Further sample details in Figure 27, note on boxplot presentation in Methods.
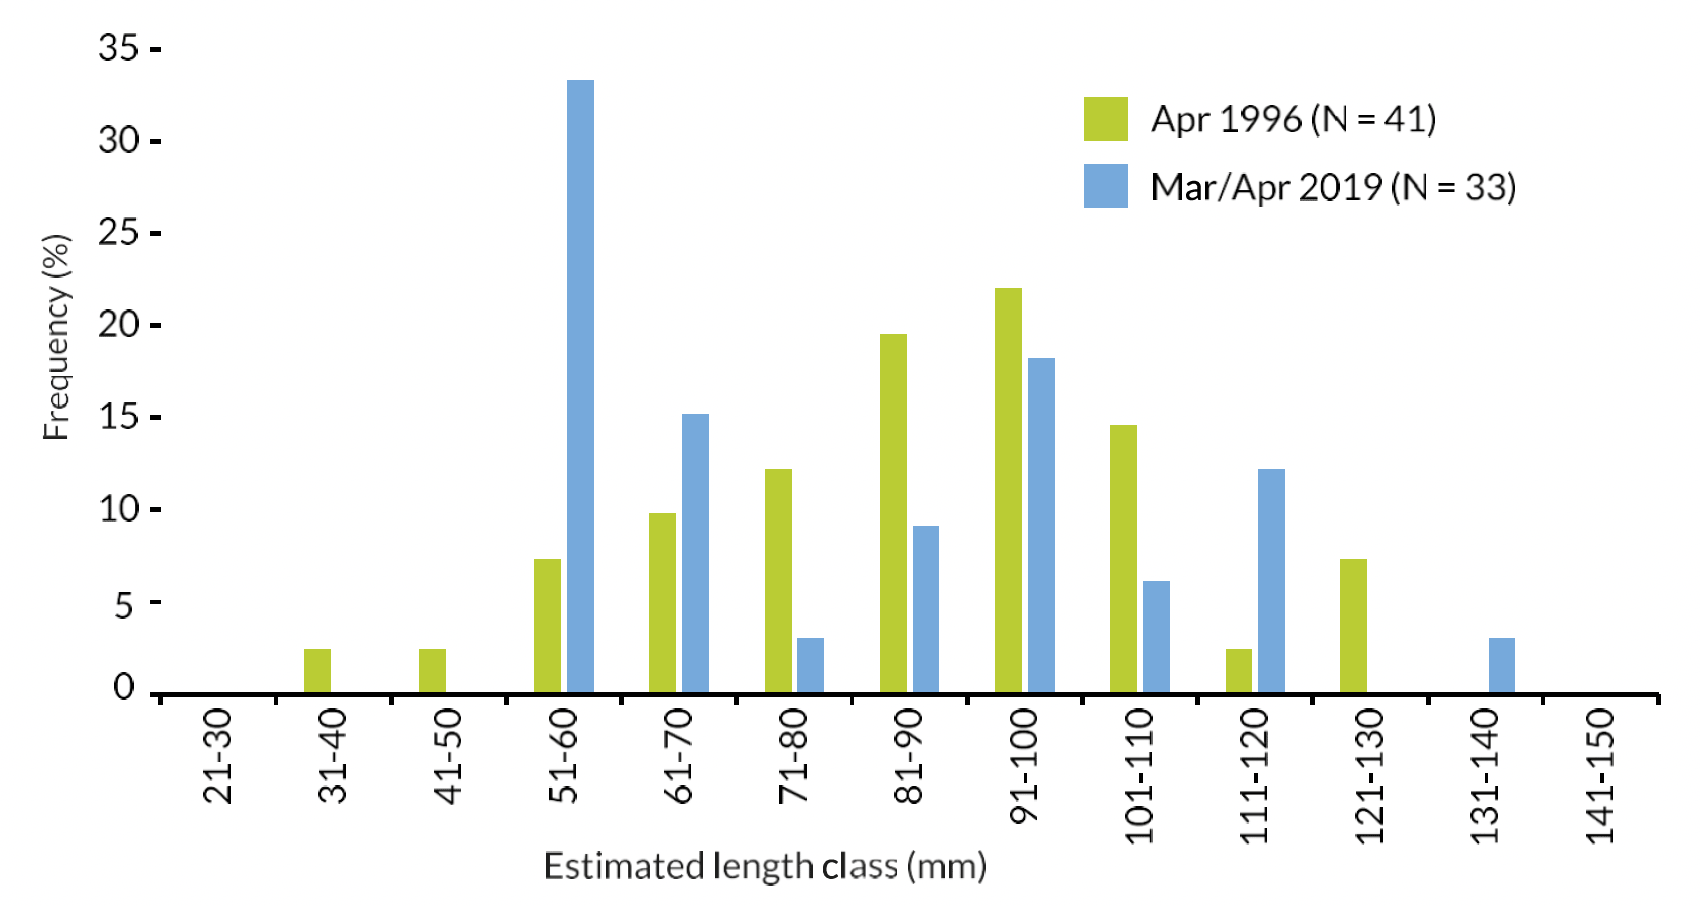
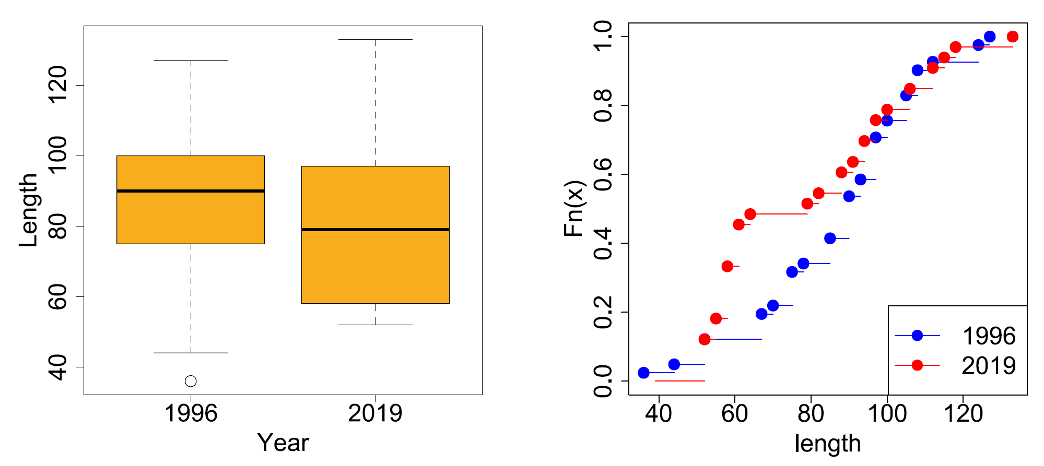
5a.4 River Spey Goosanders
Salmon from the 2019 R. Spey Goosander sample were significantly smaller than those recorded from the April 1996 sample (K-S test, D = 0.29, P = 2.274e-3).
The frequency distributions of the estimated Salmon lengths for these two Spey Goosander samples are shown in Figure 29, boxplots for them in Figure 30a, and ecdf plots in Figure 30b. As can be seen in the boxplots, Salmon in the stomachs of Spey Goosanders in 2019 had a median length of 79mm, the median length of the April 1996 sample was 1.1cm longer at 90mm.
5a.5 River Dee Cormorants
No birds were sampled during the smolt run period. No Salmon length frequency analysis was therefore possible.
5a.6 River Nith Cormorants
Only three birds were sampled during the smolt run period. No Salmon length frequency analysis was therefore possible.
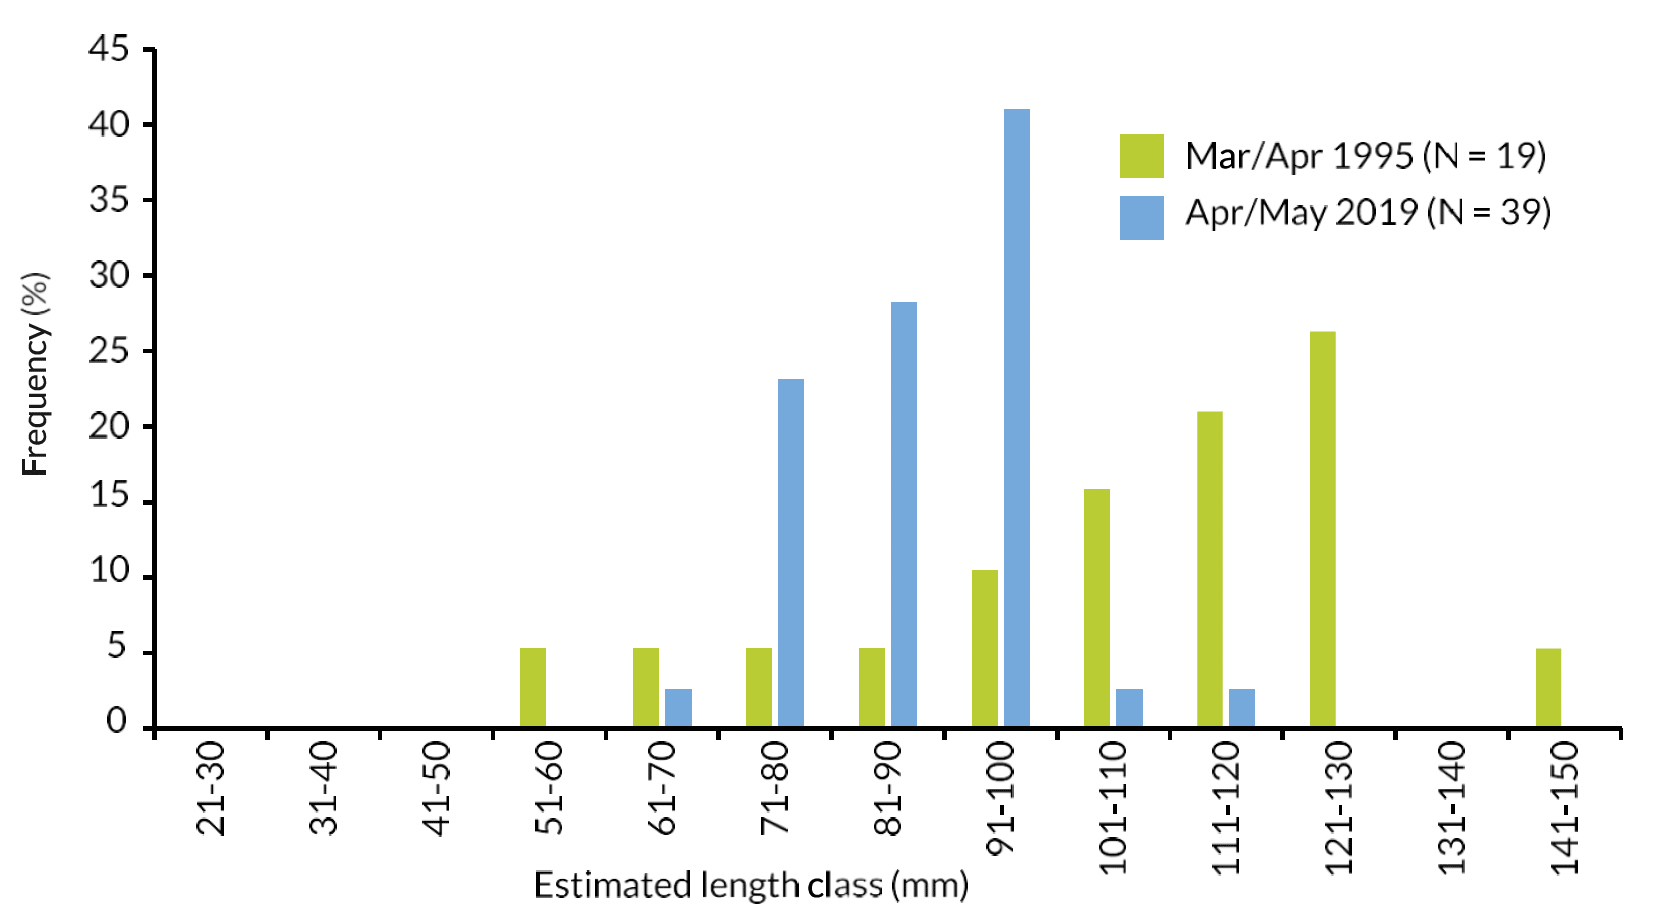
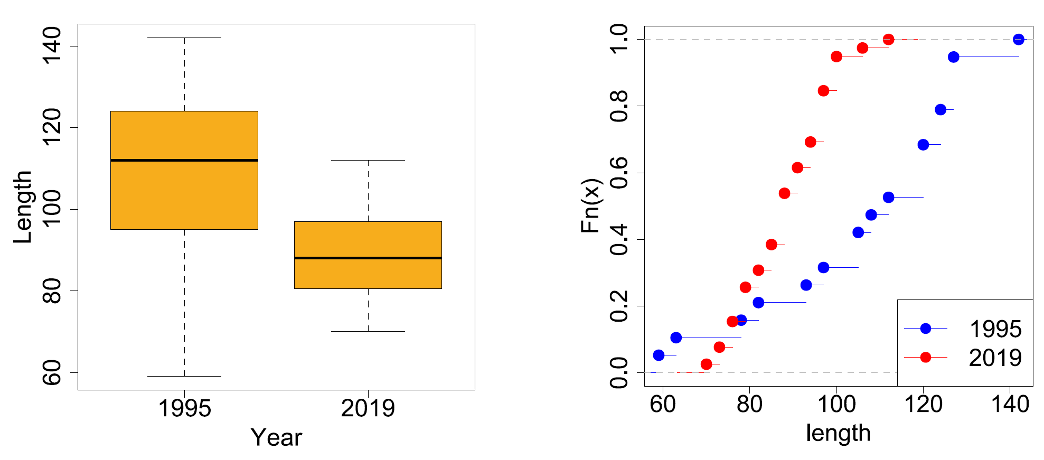
5a.7 River Tweed Cormorants
Salmon from this R. Tweed Cormorant sample were significantly smaller than those recorded from the Mar-Apr 1995 sample (K-S test, D = 0.53, P = 3.03e-11).
The frequency distributions of the estimated Salmon lengths for these two Tweed Cormorant samples are shown in Figure 31, boxplots for them in Figure 32a, and ecdf plots in Figure 32b. As can be seen in the boxplots, Salmon in the stomachs of Tweed Cormorants in 2019 had a median length of 88mm, the median length of the Mar-April 1995 sample was 2.4cm longer at 112mm.
5a.8 River Spey Cormorants
Only a single bird was sampled during the smolt run period. No Salmon length frequency analysis was therefore possible.
(b) Autumn-winter period
The lengths of Salmon from the current autumn-winter 2019/20 samples are given in Table 15).
| River | Bird species | Sample date | No. Salmon | Fish Length range (mm) |
|---|---|---|---|---|
| Dee | Goosander | Nov 2019 | 33 | 52 - 124 |
| Nith | Goosander | Oct 19-Feb 20 | 11 | 67 – 130 |
| Tweed | Goosander | Sep-Nov 2019 | 36 | 64 – 127 |
| Spey | Goosander | Sep-Dec 2019 | 57 | 48 – 124 |
| Nith | Cormorant | Nov 19-Feb 20 | 8 | 94 - 127 |
| Tweed | Cormorant | Sep-Nov 2019 | 26 | 73 – 157 |
Only two possible comparisons could be made between the current autumn-winter 2019/20 samples and those from a similar period in earlier years (i.e. Tweed Goosanders, Tables 22[k] and 22[v] of Appendix 5.1 in Marquiss et al. 1998, see also Figure 14 for general diet comparison). This was because either no samples were available at all in most cases, or sample sizes were very small (i.e. three samples each with only 3-4 stomachs containing food). Unfortunately, Salmon fork length data were not available for either of these relevant earlier material and so no comparisons could be made with previous historic samples.
Given this, the only possible comparisons that could be made in the current study are between these autumn-winter Salmon length frequencies and those from the preceding smolt run period in the spring of 2019. However, in relation to Salmon lengths from both sampling periods, it is important to note that samples may be compromised by small numbers of stomachs containing Salmon or small numbers of Salmon, or a combination of both. The precise influence of both sample size (i.e. number of stomachs containing Salmon) or the location of sampling on our confidence in the wider applicability of the resulting Salmon length frequencies is currently unknown (see Discussion).
In order to start a preliminary exploration of the data, an arbitrary decision was made to restrict comparisons to those samples where 12 or more stomachs contained Salmon and/or where 20 or more Salmon had been recorded. This number of stomachs corresponds to the minimum needed to estimate of the diet of Goosanders and Cormorants from Scottish salmon rivers (Marquiss & Carss 1997). However, it should be noted that whilst this sample size is adequate for determining the fish species composition of birds' diet, it is not known whether it is appropriate for determining the complete length frequency distributions of any of those fish species that are eaten (see Discussion). The choice to include samples with 20 or more Salmon was more arbitrary and was primarily determined by the desire to exclude those samples containing very few (in this case 11 or fewer) Salmon.
For six samples (38%), neither selection criteria (number of stomachs or of Salmon) was satisfied and these (and their associated pairing) were excluded from further analysis. Furthermore, for no pairing of smolt run period vs autumn-winter samples were selection criteria met in every instance. Consequently, samples where at least one criteria was met in each of the seasonal pairings were considered. Thus, with the caveat that one element of each seasonal pairing was unlikely to provide information on Salmon lengths to a high degree of confidence, comparisons are made for three Goosander samples (Dee, Tweed, Spey) and for Tweed Cormorants (see Table 16)
| River and bird species | Smolt run period 2019 | Autumn-winter 2019/2020 | |||
|---|---|---|---|---|---|
| No. stomachs | No. Salmon | No. stomachs | No. Salmon | ||
| (i) | Dee Goosander | 18(1) | 142(1) | 2(2) | 33(1) |
| (ii) | Nith Goosander(3) | 11(2) | 22(1) | 8(2) | 11(2) |
| (iii) | Tweed Goosander | 7(2) | 21(1) | 14(1) | 36(1) |
| (iv) | Spey Goosander | 12(1) | 33(1) | 6(2) | 57(1) |
| (v) | Dee Cormorant(3) | 0(2) | 0(2) | 3(2) | 0(2) |
| (vi) | Nith Cormorant(3) | 3(2) | 22(1) | 6(2) | 8(2) |
| (vii) | Tweed Cormorant | 5(2) | 39(1) | 11(2) | 26(1) |
| (viii) | Spey Cormorant(3) | 1(2) | 0(2) | 1(2) | 1(2) |
(1) Samples with 12 or more stomachs containing Salmon or of 20 or more Salmon
(2) Samples without 12 or more stomachs containing Salmon or of 20 or more Salmon
(3) Paired samples excluded from analysis because no samples met selection criteria
5b.1 River Dee Goosanders
Thirty-three Salmon from only 2 stomachs were available from the Nov 2019 R. Dee Goosander sample. These were significantly larger than those recorded from the smolt run period in Mar- May 2019 (K-S test, D = 0.38, P = 9.63e-14).
The frequency distributions of the estimated Salmon lengths for these two Dee Goosander samples are shown in Figure 33, boxplots for them in Figure 34a, and ecdf plots in Figure 34b. As can be seen in the boxplots, Salmon in the stomachs of Dee Goosanders in Mar-May 2019 had a median length of 62mm, the median length of the Nov 2019 sample was 0.5cm longer at 67mm.
5b.2 R. Nith goosanders
Only 11 Salmon from 8 stomachs were available from the Oct 2019-Feb 2020 R. Nith goosander sample. These fish had a median length of 85mm (range: 67-130mm).
5b.3 River Tweed Goosanders
Twenty-one Salmon from only 7 stomachs were available from the Apr-May 2019 R. Tweed Goosander sample. These were not significantly different in length to those recorded from the Sep-Nov 2019 sample (K-S test, D = 0.21, P = 0.16).
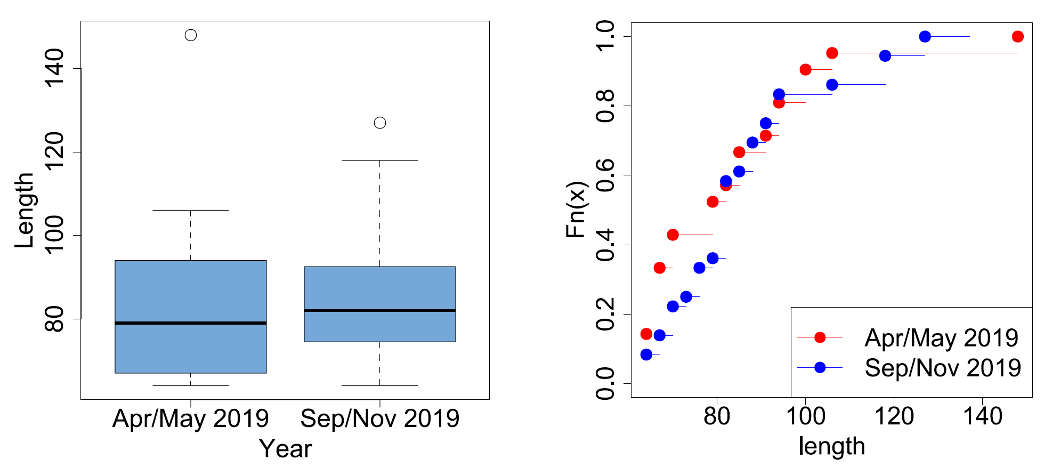
The frequency distributions of the estimated Salmon lengths for these two Tweed Goosander samples are shown in Figure 35, boxplots for them in Figure 36a, and ecdf plots in Figure 36b. As can be seen in the boxplots, Salmon in the stomachs of Tweed Goosanders in Apr-May 2019 had a median length of 79mm, the median length of the Sep-Nov 2019 sample was 0.53cm longer at 82mm.

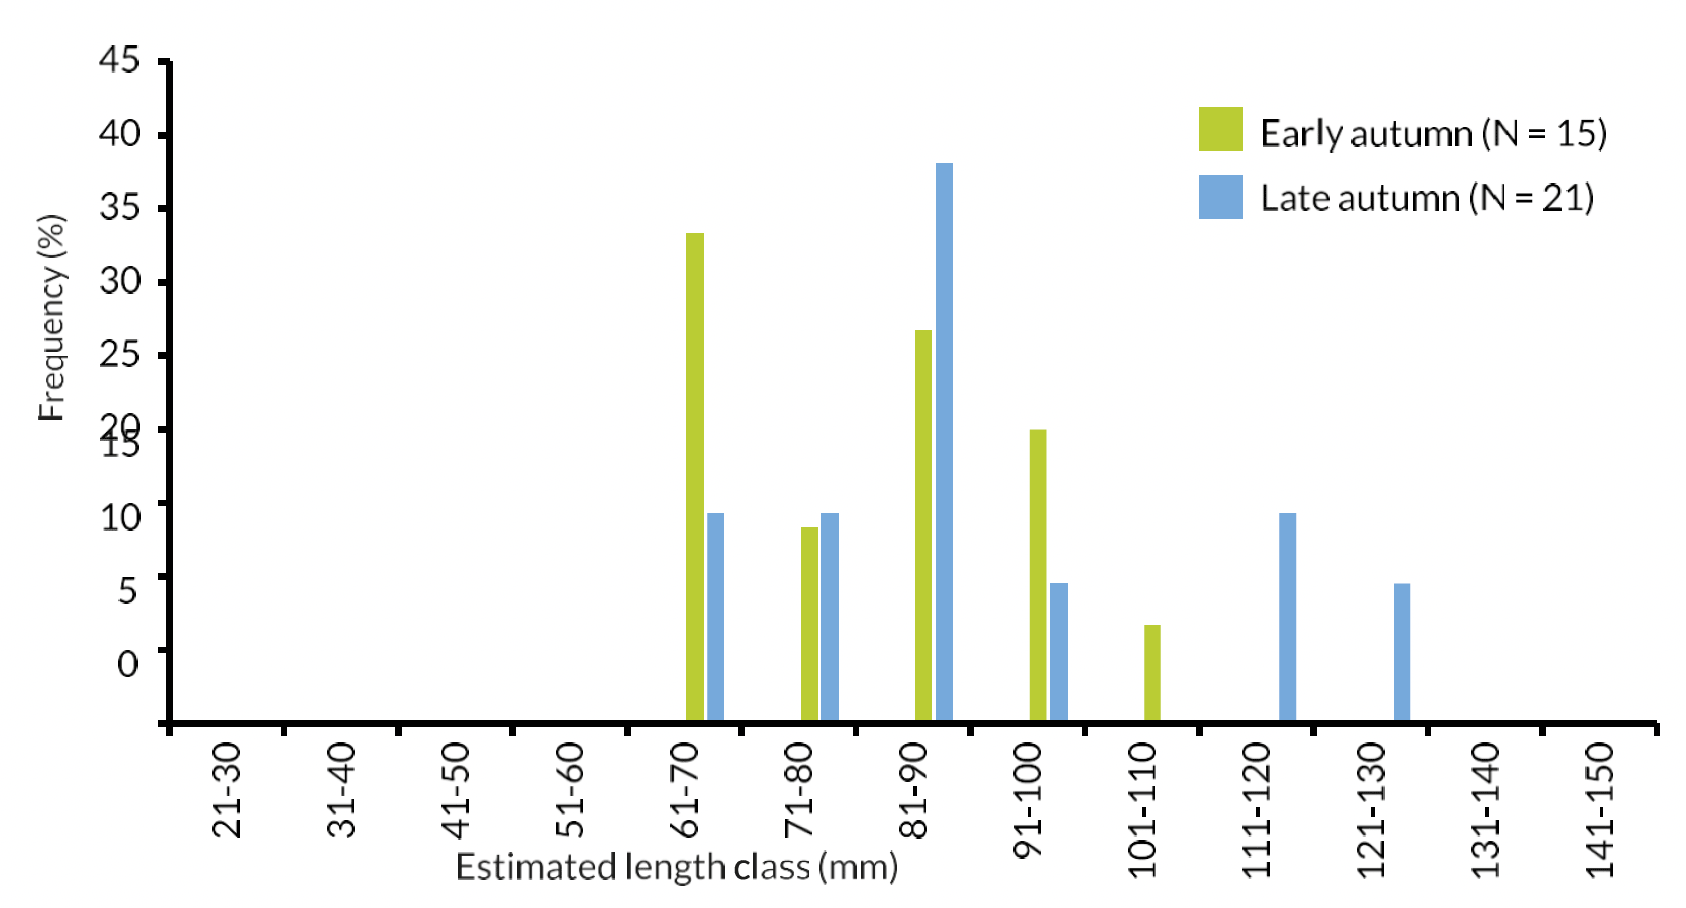
The autumn R. Tweed Goosander sample could be split into 'early' (Sep-Oct 2019) and 'late' (Nov 2019) periods based on the 36 Salmon from 14 stomachs that were available. Care must be taken as the number of stomachs containing Salmon in each sample are small (also, no account is taken of possible differences in sampling locations between the two periods), but comparisons between early and late autumn samples are clearly of interest.
Salmon from the early autumn R. Tweed Goosander sample were not significantly different in length to those recorded from the late autumn sample (K-S test, D = 0.23, P = 0.23).
Five birds contained 15 Salmon in the early autumn sample and nine stomachs contained 21 Salmon in the late autumn one. The frequency distributions of the estimated Salmon lengths for these two Tweed Goosander samples are shown in Figure 37, boxplots for them in Figure 38a, and ecdf plots in Figure 38b. As can be seen in the boxplots, Salmon in the stomachs of Tweed Goosanders in early autumn had a median length of 82mm, as did those from the late autumn sample.
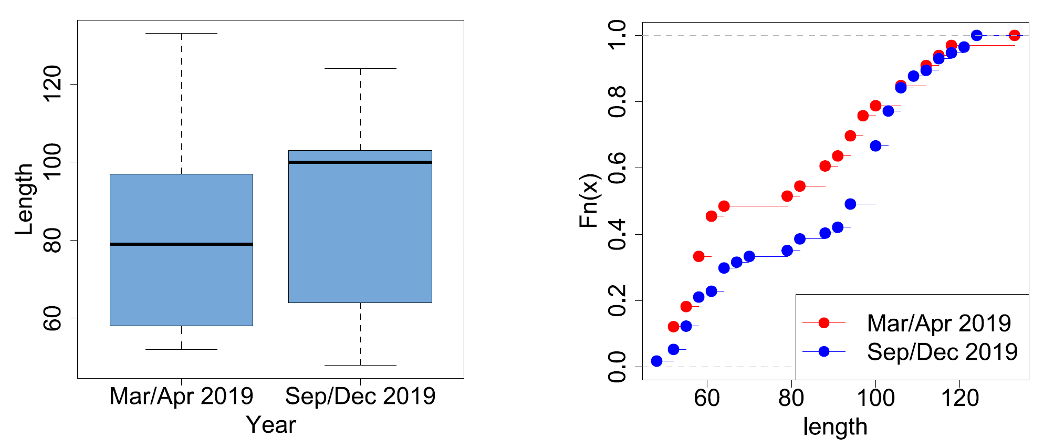
5b.4 River Spey Goosanders
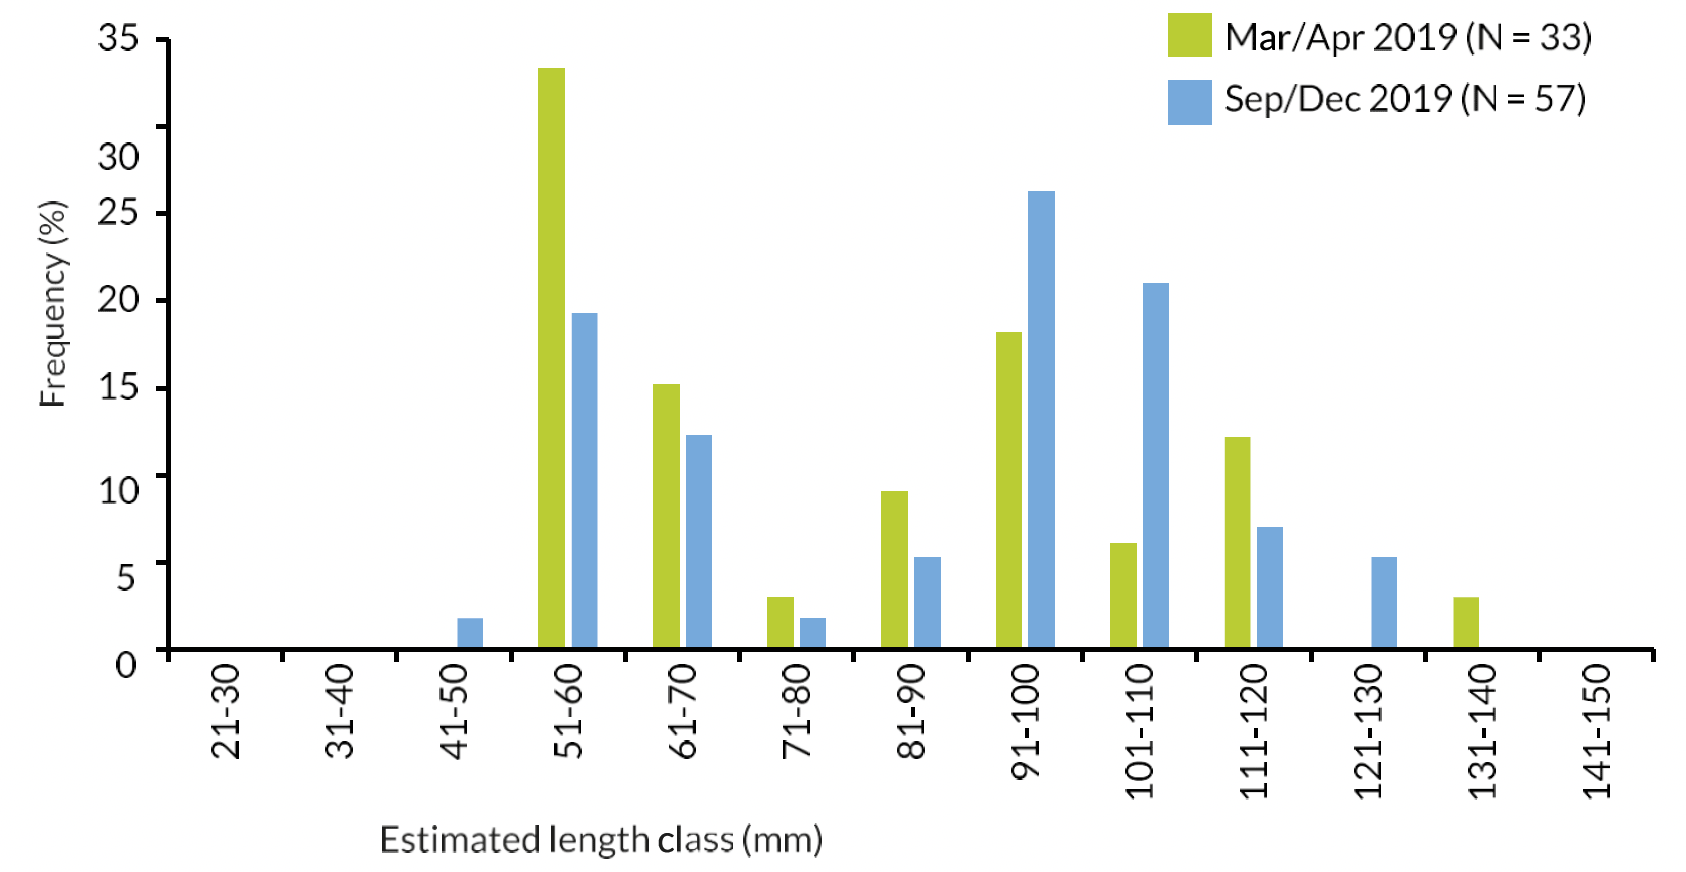
Fifty-seven Salmon from only 7 stomachs were available from the Sep-Dec 2019 R. Spey Goosander sample. These were significantly larger than those recorded from the smolt run period in Mar-Apr 2019 (K-S test, D = 0.23, P = 0.03).
The frequency distributions of the estimated Salmon lengths for these two Spey Goosander samples are shown in Figure 39, boxplots for them in Figure 40a, and ecdf plots in Figure 40b. As can be seen in the boxplots, Salmon in the stomachs of Spey Goosanders in Mar-Apr 2019 had a median length of 79mm, the median length of the Sep-Dec 2019 sample was 2.1cm longer at 100mm.
5b.5 River Dee Cormorants
No Salmon were recorded in any of the three Cormorant stomachs with food from the Dee in the winter sample (Dec 2019-Jan 2020).
5b.6 River Nith Cormorants
Only 8 Salmon from 8 stomachs were available from the Nov 2019-Feb 2020 R. Nith Cormorant sample. These fish had a median length of 112mm (range: 94 - 127mm).
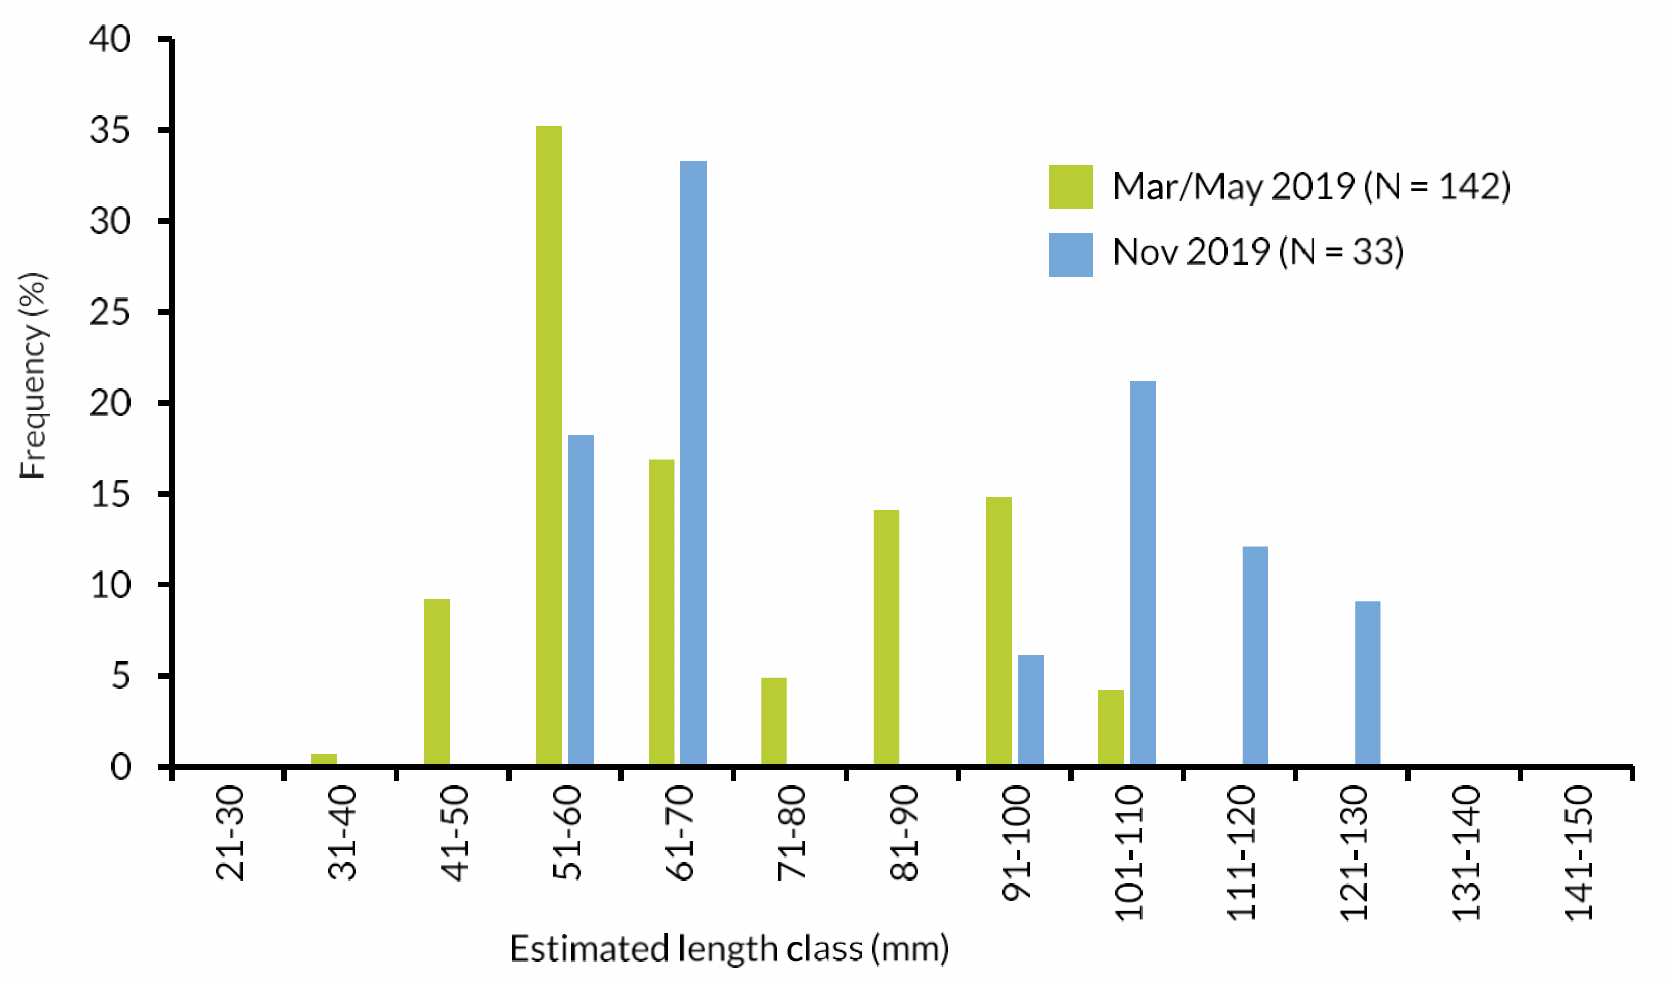
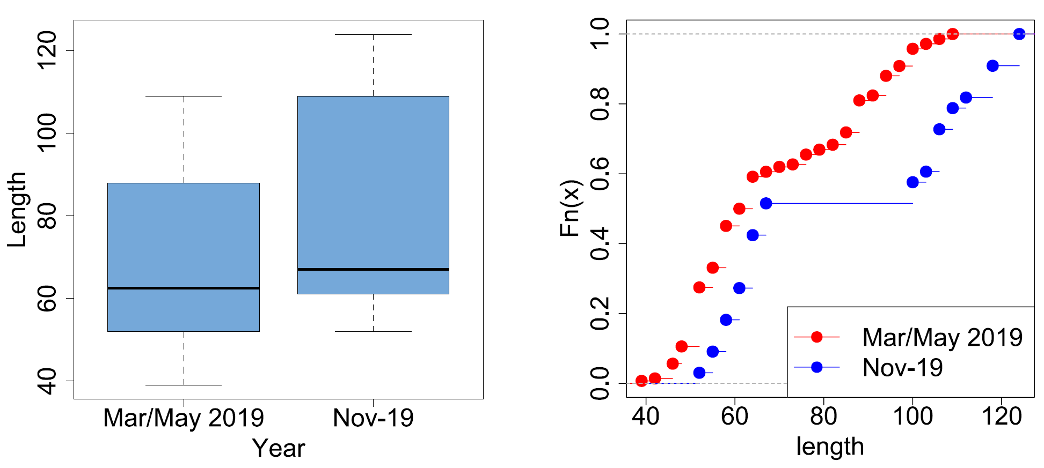
5b.7 River Tweed Cormorants
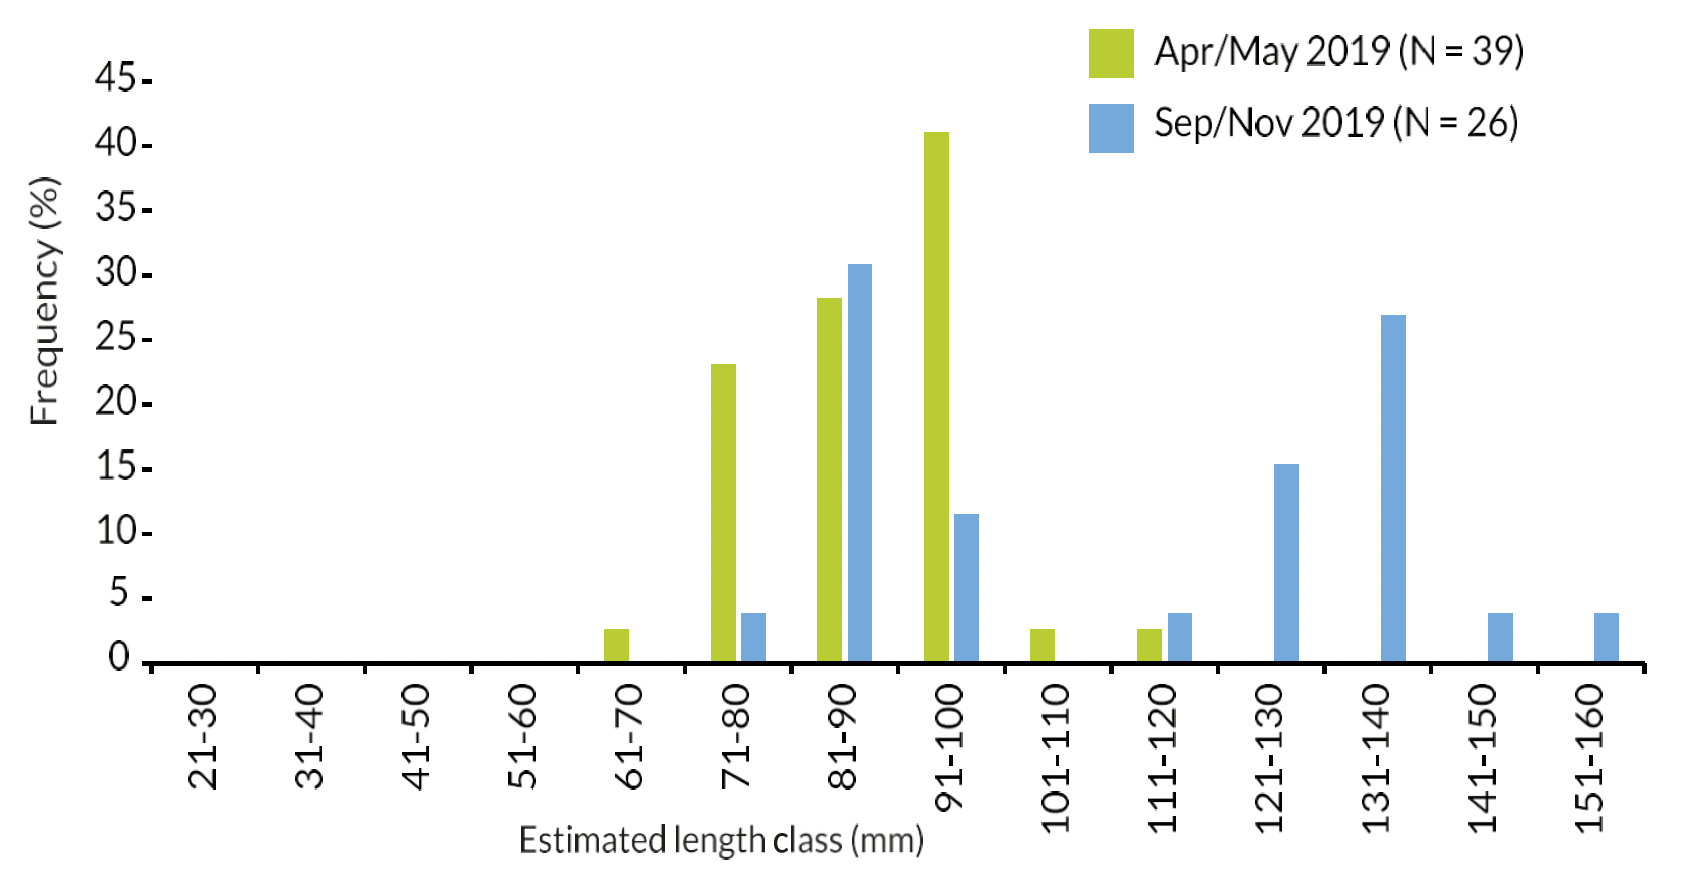
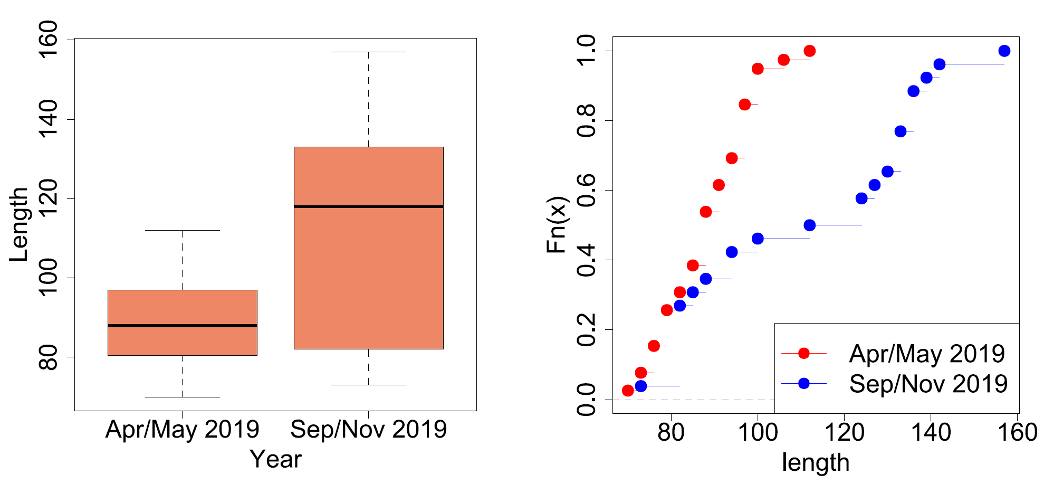
Twenty-six Salmon from only 11 stomachs were available from the autumn (Sep-Nov 2019) R. Tweed Cormorant sample. These were significantly larger than those recorded from the previous Apr-May 2019 sample (K-S test, D = 0.50, P = 6.41e-10).
The frequency distributions of the estimated Salmon lengths for these two Tweed Cormorant samples are shown in Figure 41, boxplots for them in Figure 42a, and ecdf plots in Figure 42b. As can be seen in the boxplots, Salmon in the stomachs of Tweed Cormorants in Apr-May 2019 had a median length of 88mm, the median length of the Sep-Nov 2019 sample was 3.0cm longer at 118mm.
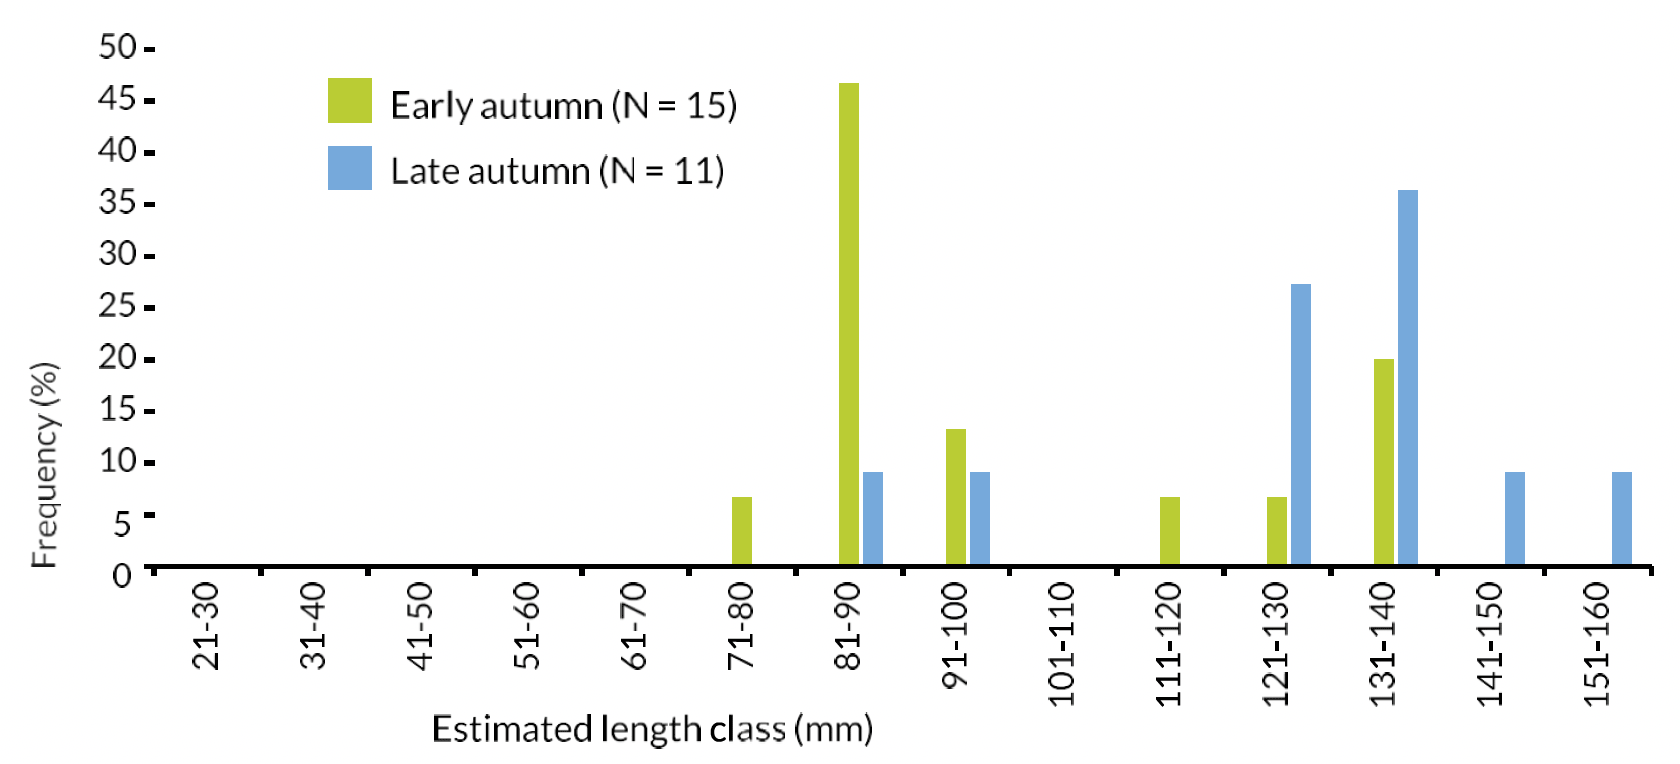
The autumn R. Tweed Cormorant sample could be split into 'early' (Sep-Oct 2019) and 'late' (Nov 2019) periods based on the 26 Salmon from 11 stomachs that were available. Care must be taken as the number of stomachs containing Salmon in each sample are small (also, no account is taken of possible differences in sampling locations between the two periods), but comparisons between early and late autumn samples are clearly of interest.
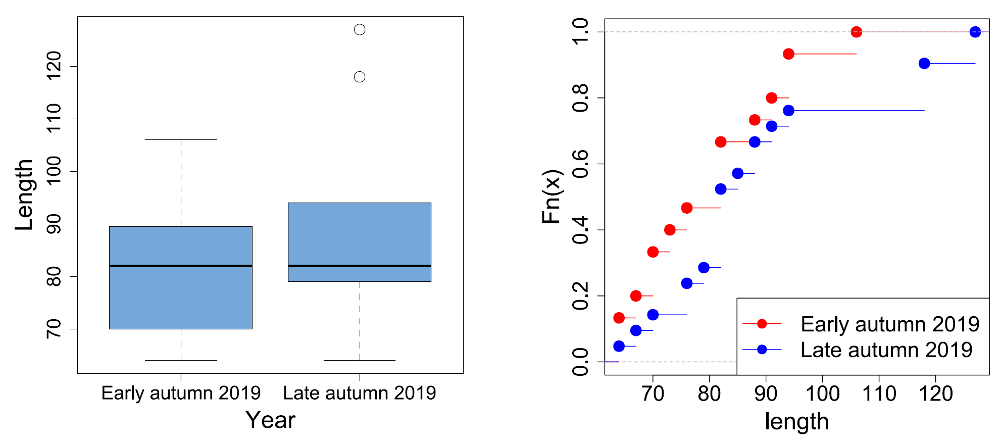
Salmon from the early autumn R. Tweed Cormorant sample were significantly smaller than those recorded from the late autumn sample (K-S test, D = 0.48, P = 2.13e-04).
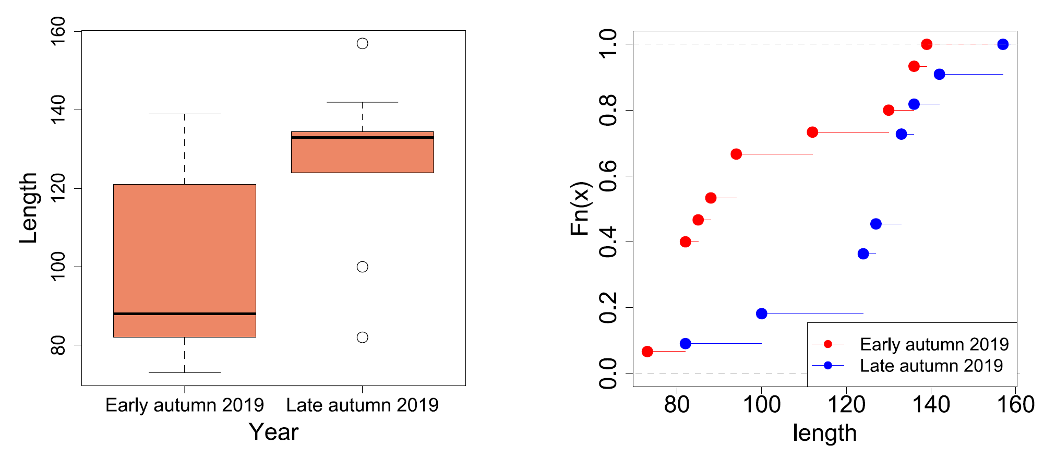
Six birds contained 15 Salmon in the early autumn sample and five stomachs contained 11 Salmon in the late autumn one. The frequency distributions of the estimated Salmon lengths for these two Tweed Goosander samples are shown in Figure 43, boxplots for them in Figure 44a, and ecdf plots in Figure 44b. As can be seen in the boxplots, Salmon in the stomachs of Tweed Goosanders in early autumn had a median length of 88mm, the median length of the late autumn sample was 4.5cm longer at 133mm.
5b.8 River Spey Cormorants
Only one Salmon (estimated FL = 91mm) from one stomach was available from the winter (Dec-Feb 2020) R. Spey Cormorant sample.