Bird stomach contents analysis - final report: Goosander and Cormorant diet on four Scottish rivers 2019 to 2020
This study analysed the stomach contents of goosanders and cormorants collected from the Rivers Tweed, Dee, Nith and Spey during 2019 and 2020 in order to to assess whether there was evidence of substantial changes in the diets of these species of fish-eating birds since the 1990s.
4. Assessments of general diet
Monthly details of smolt run and autumn-winter period samples are show in Figures 2 and 3 and a full chronology is given in Appendix 3. The scientific names of all prey species are given in Appendix 4.
(a) Smolt run period
4a.1 River Dee Goosanders
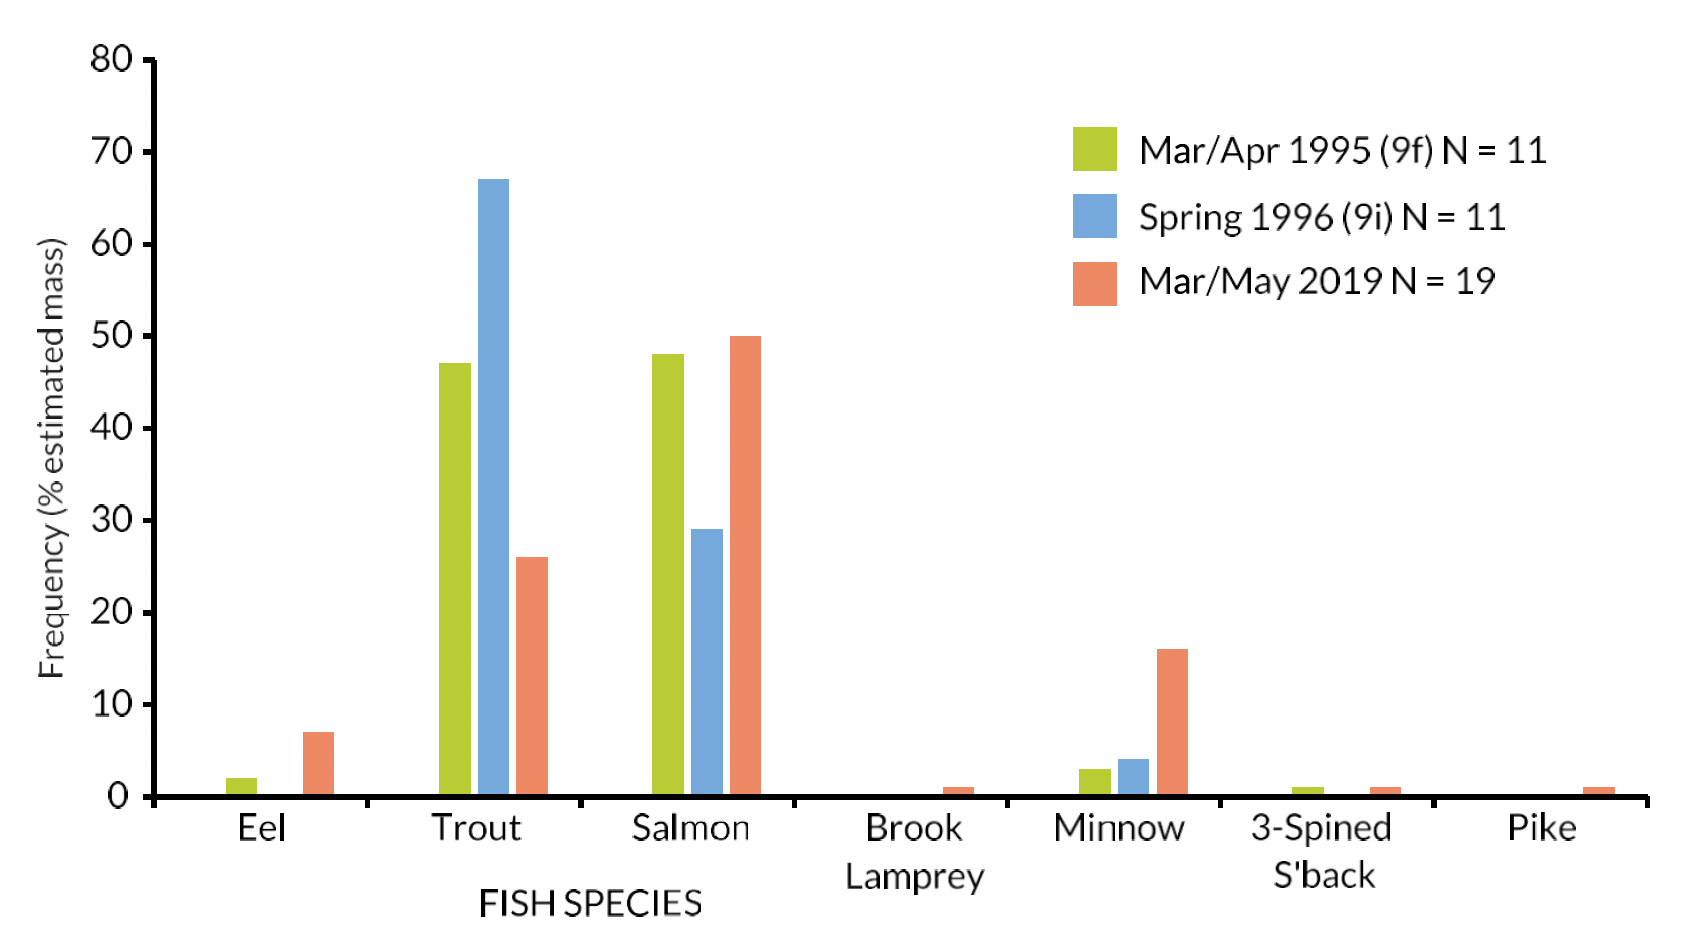
Twenty carcases were available, 19 of them had stomach contents. Of these, all but one stomach contained Salmon (95%) and three quarters contained Trout (74%). Over half of stomachs contained Minnow (61%) and about a quarter contained 3-Spined Stickleback (28%). Two stomachs contained Eel (11%) and single stomachs each contained Lamprey and Pike (6% each, Table 3).
| No. (%) of Goosanders | Fish species | No. fish | Estimated mass (g) | % by mass |
|---|---|---|---|---|
| 18 (95%) | Salmon | 142 | 588 | 50 |
| 14 (74%) | Trout | 44 | 313 | 26 |
| 12 (61%) | Minnow | 161 | 176 | 16 |
| 2 (11%) | Eel | 2 | 85 | 7 |
| 1 (6%) | Pike | 1 | 15 | 1 |
| 5 (28%) | 3-Spined Stickleback | 22 | 7 | <1 |
| 1 (6%) | Brook Lamprey | 1 | 2 | <1 |
| N = 19 birds | Totals | 373 | 1186 |
Comparisons with relevant historical samples (by time of year) from Marquiss et al. (1998) are given in Figure 8.
4a.2 River Nith Goosanders
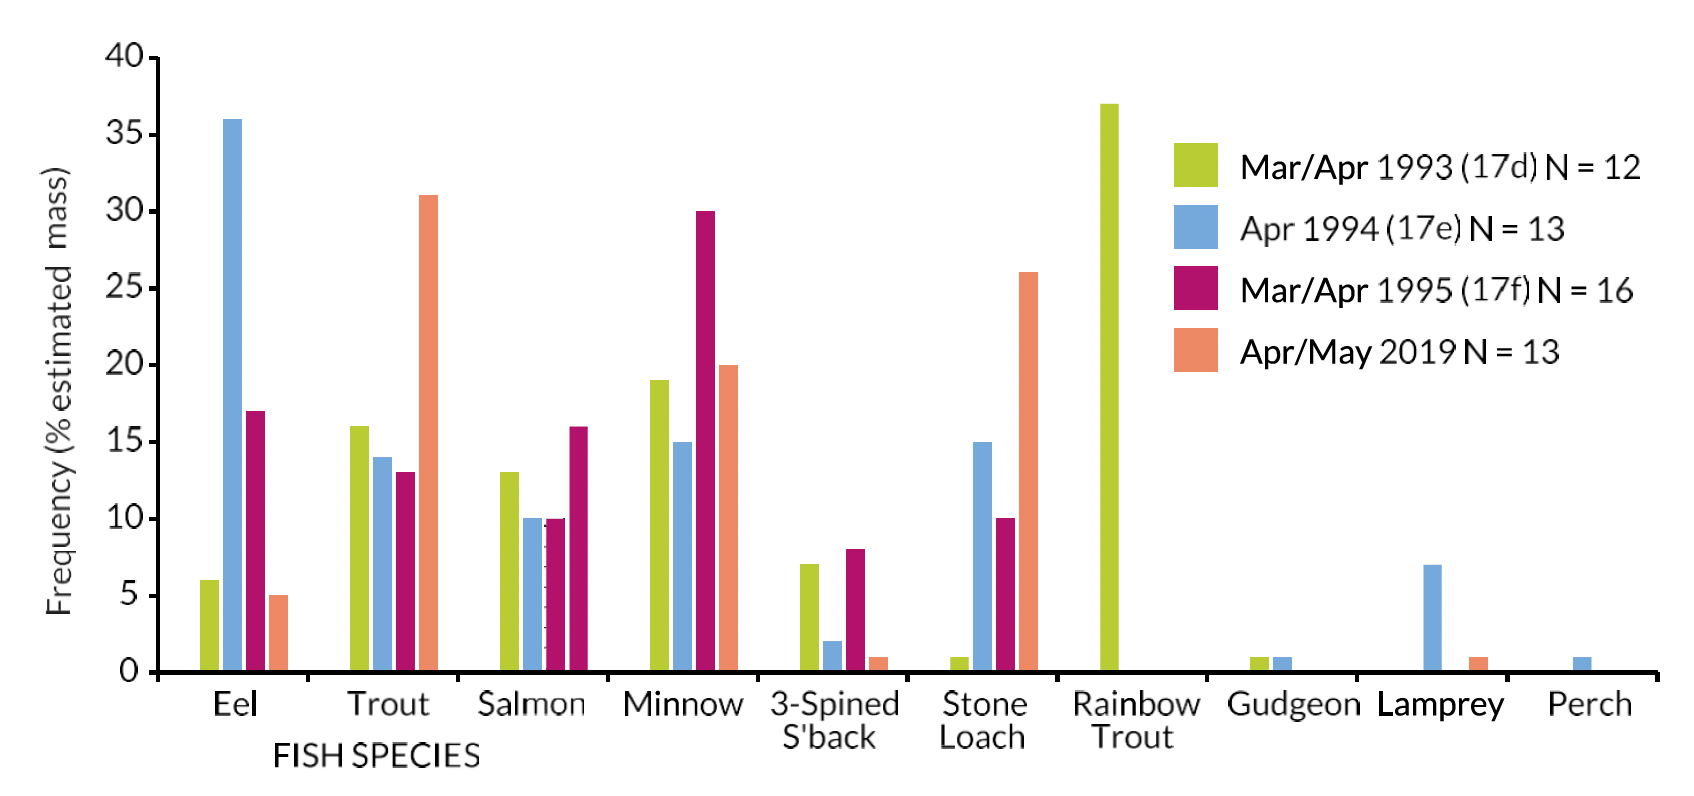
Fifteen carcases were available, 13 of them had stomach contents. Of these, all stomachs contained Stone Loach and most contained Minnow (92%), Trout and Salmon (85% each). Just under half of stomachs contained 3-Spined Stickleback (46%) and single stomachs contained Eel and Lamprey (8% each), Table 4.
| No. (%) of Goosanders | Fish species | No. fish | Estimated mass (g) | % by mass |
|---|---|---|---|---|
| 11 (85%) | Trout | 21 | 207 | 31 |
| 13 (100%) | Stone Loach | 59 | 174 | 26 |
| 12 (92%) | Minnow | 117 | 136 | 20 |
| 11 (85%) | Salmon | 22 | 105 | 16 |
| 1 (8%) | Eel | 2 | 36 | 5 |
| 1 (8%) | River Lamprey | 1 | 7 | 1 |
| 6 (46%) | 3-Spined Stickleback | 9 | 3 | <1 |
| N = 13 birds | Totals | 231 | 668 |
Comparison with relevant historical samples (by time of year) from Marquiss et al. (1998) are given in Figure 9.
4a.3 River Tweed Goosanders
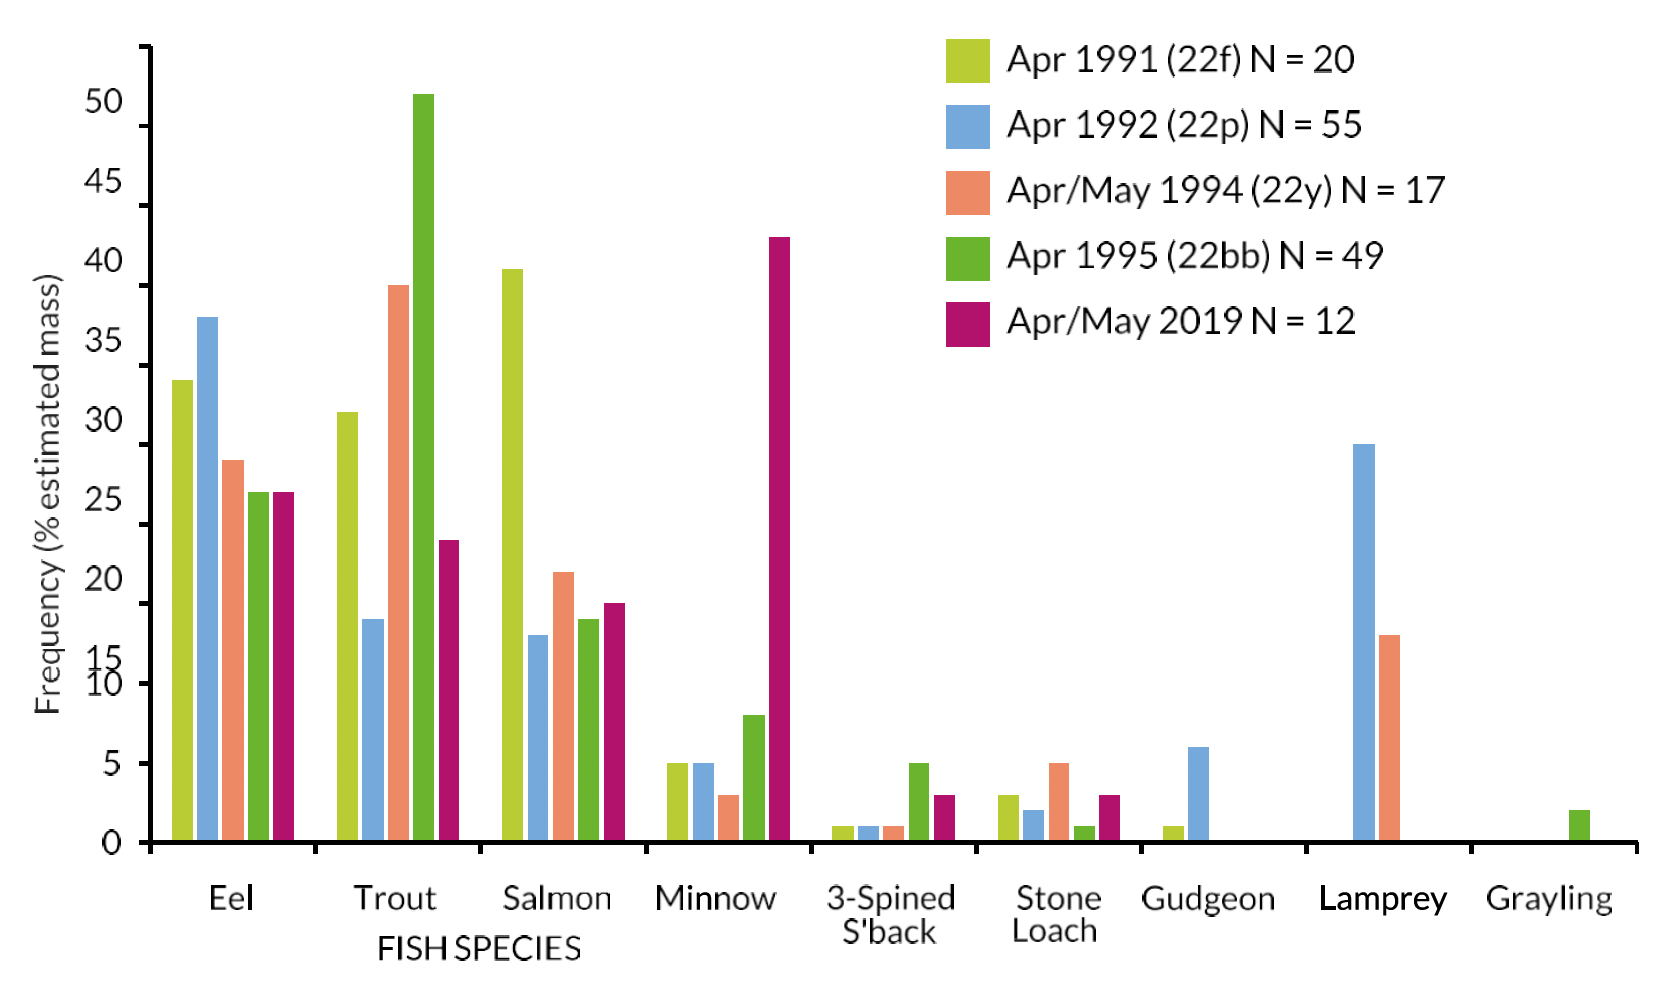
Fourteen carcases were available, 12 of them had stomach contents. Of these, all stomachs contained Minnow, three-quarters contained Salmon (75%), and half contained Trout. Under half the stomachs contained 3-Spined Stickleback (42%), and around a third each contained Eel and Stone Loach (33% each, Table 5).
| No. (%) of Goosanders | Fish species | No. fish | Estimated mass (g) | % by mass |
|---|---|---|---|---|
| 12 (100%) | Minnow | 155 | 305 | 38 |
| 4 (33%) | Eel | 6 | 174 | 22 |
| 6 (50%) | Trout | 15 | 147 | 19 |
| 9 (75%) | Salmon | 21 | 120 | 15 |
| 5 (42%) | 3-Spinedd Stickleback | 45 | 26 | 3 |
| 4 (33%) | Stone Loach | 5 | 22 | 3 |
| N = 12 birds | Totals | 224 | 794 |
Comparison with relevant historical samples (by time of year) from Marquiss et al. (1998) are given in Figure 10.
4a.4 River Spey Goosanders
Fifteen carcases were available, 13 of them had stomach contents. Of these, most stomachs contained Salmon (92%) and Trout (92%), just less than half contained Minnow (46%), just less than a third each contained Eel and 3-Spined Stickleback (31% each), and one stomach contained Lamprey (8%, Table 6).
| No. (%) of Goosanders | Fish species | No. fish | Estimated mass (g) | % by mass |
|---|---|---|---|---|
| 12 (92%) | Trout | 31 | 245 | 40 |
| 12 (92%) | Salmon | 33 | 219 | 36 |
| 4 (31%) | Eel | 4 | 87 | 14 |
| 4 (31%) | 3-Spined Stickleback | 42 | 34 | 6 |
| 6 (46%) | Minnow | 32 | 27 | 4 |
| 1 (8%) | Brook Lamprey | 4 | 3 | <1 |
| N = 13 birds | 146 | 615 |
Comparison with relevant historical samples (by time of year) from Marquiss et al. (1998) are given in Figure 11.
4a.5 River Dee Cormorants
No birds sampled in spring 2019.
4a.6 River Nith Cormorants
March/April 2019
Six carcasses were available, one was likely to have regurgitated its stomach contents (only a single [32mm/0.3g] 3-Spined Stickleback was found in the gullet), and two were categorised as 'empty' containing only a few, very eroded bones (sea fishes in one stomach and probably a large Salmonid in the other). The remaining three stomachs with food contained:
3 Perch (42% by mass), 12 Trout (20%), 22 Salmon (19%), 1 unidentified Flatfish sp. (11%), 2 Grayling (6%), 1 Stone Loach (<1%), and 2 Minnow (<1%). All three stomachs contained Trout and Salmon, two stomachs contained Minnow (66%), and one stomach each contained Perch, Flatfish, Grayling, and Stone Loach (33% each).
Due to the constraints of small samples (current and historical), no comparison is possible with previous data.
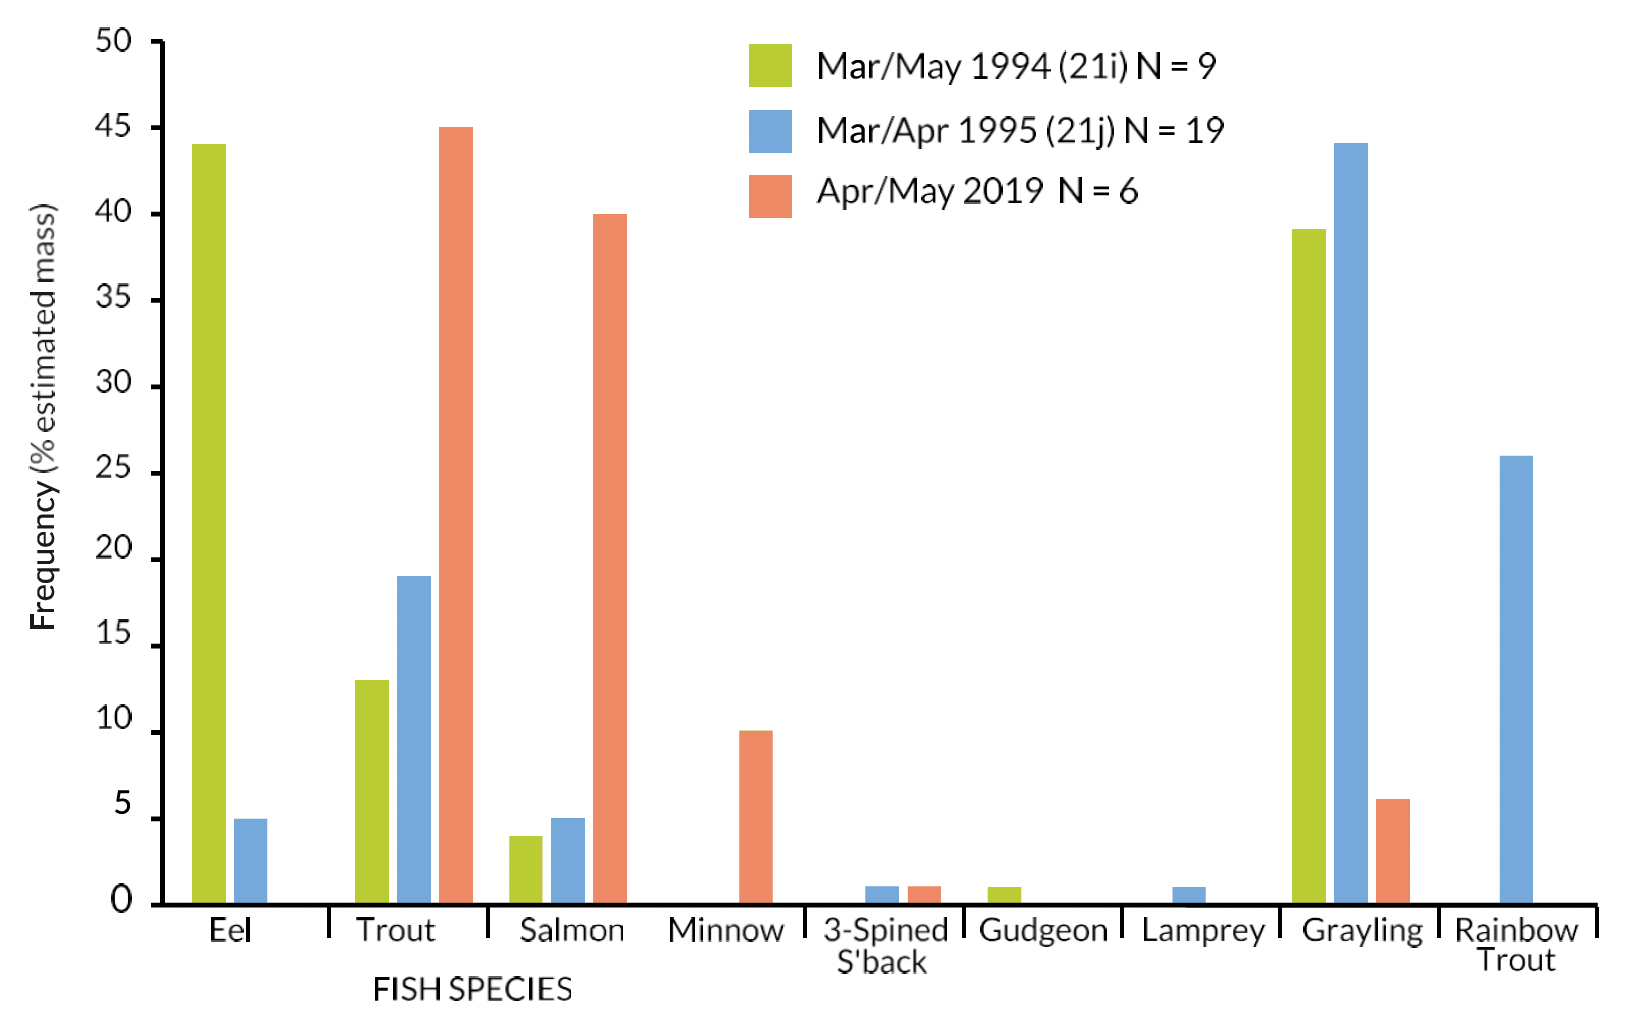
4a.7 River Tweed Cormorants
April/May 2019
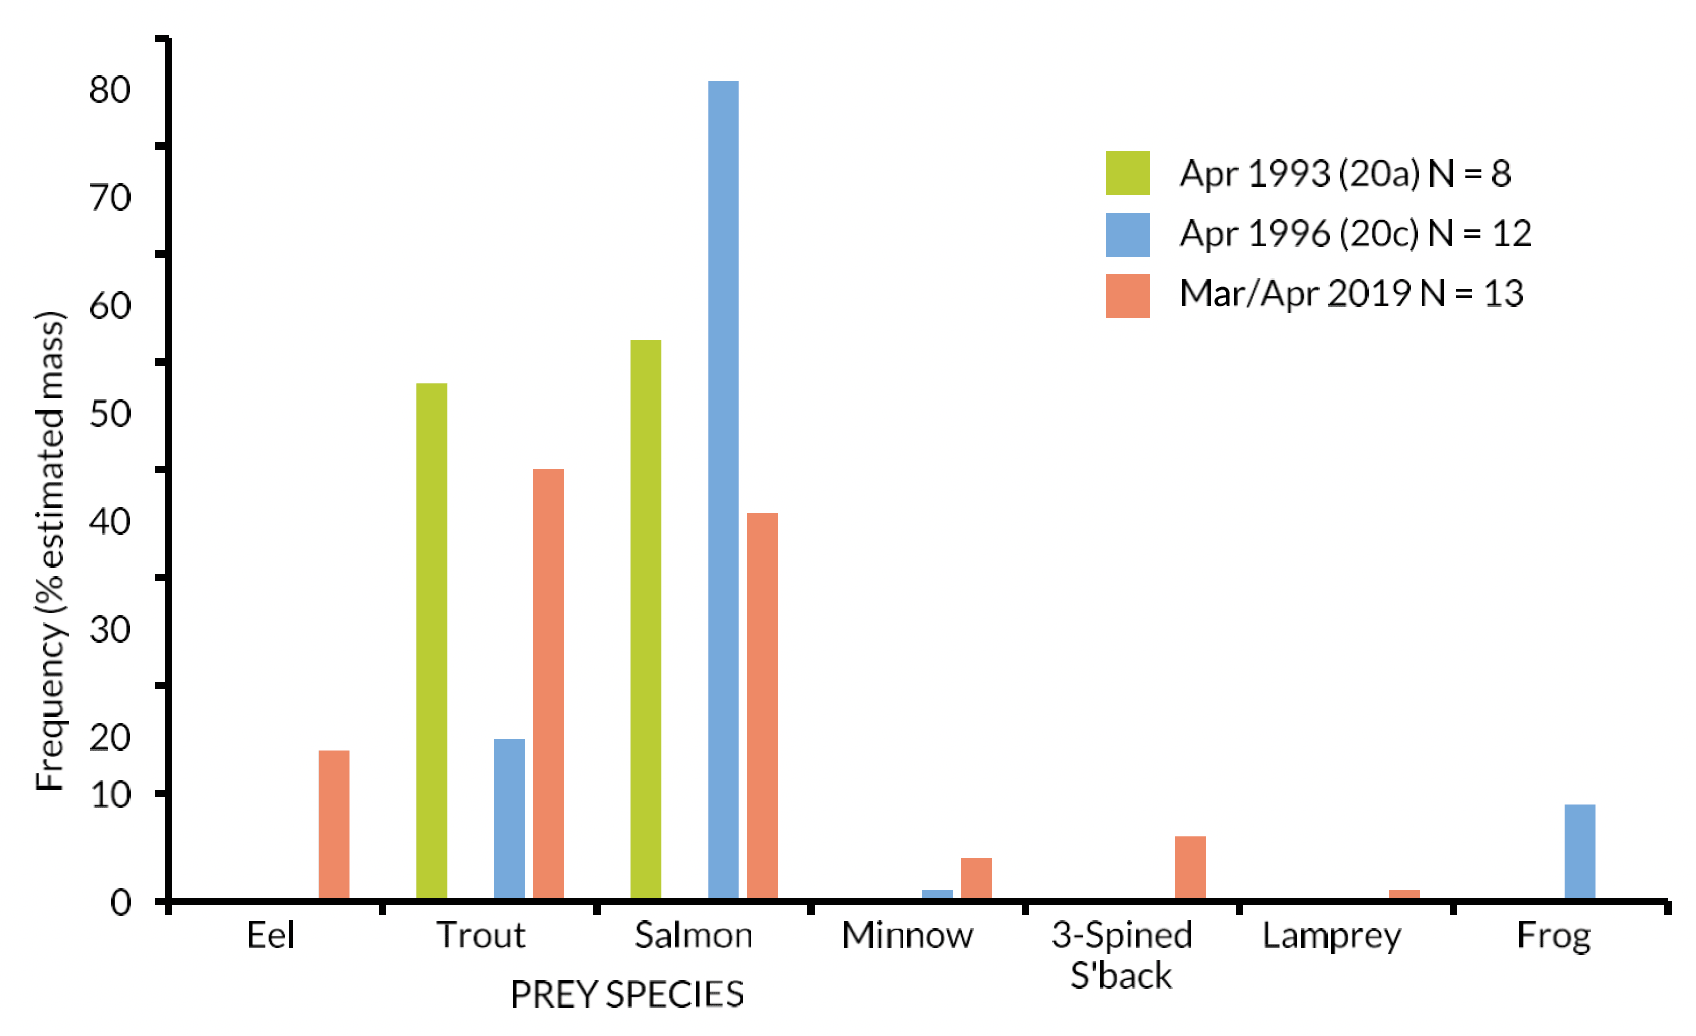
Nine carcasses were available, 6 of them had stomach contents. Of these, most contained Trout and Salmon (83% each), two-thirds contained Minnow, and single stomachs each contained Grayling and 3-Spined Stickleback (17% each, Table 7).
| No. (%) of Cormorants | Fish species | No. fish | Estimated mass (g) | % by mass |
|---|---|---|---|---|
| 5 (83%) | Trout | 27 | 323 | 45 |
| 5 (83%) | Salmon | 39 | 289 | 40 |
| 4 (67%) | Minnow | 41 | 71 | 10 |
| 1 (17%) | Grayling | 1 | 42 | 6 |
| 1 (17%) | 3-Sp Stickleback | 2 | 1 | <1 |
| N = 6 birds | Totals | 110 | 726 |
Some samples of Cormorants with food from the R. Tweed were small (including the April/ May 2019 one) and therefore too small to be sure they are representative of general diet. Nevertheless, the comparison with historical samples is of interest (Figure 12).
4a.8 River Spey Cormorants
April 2019
One carcase contained:
1 Salmon kelt (estimated FL = 47.5cm, estimated wt. = 907g).
(b) Autumn-winter period
4b.1 River Dee Goosanders
Two carcases during autumn 2019, 2 with stomach contents contained:
33 Salmon (estimated mass 259g, 72% by biomass), 8 Trout (93g, 26%), and 3 Minnow (7g, 2%).
Both stomachs contained Salmon and Trout, one of them contained Minnow.
Due to the constraints of small samples (current and historical), no comparison is possible with previous data, including that from the 2019 smolt run period.
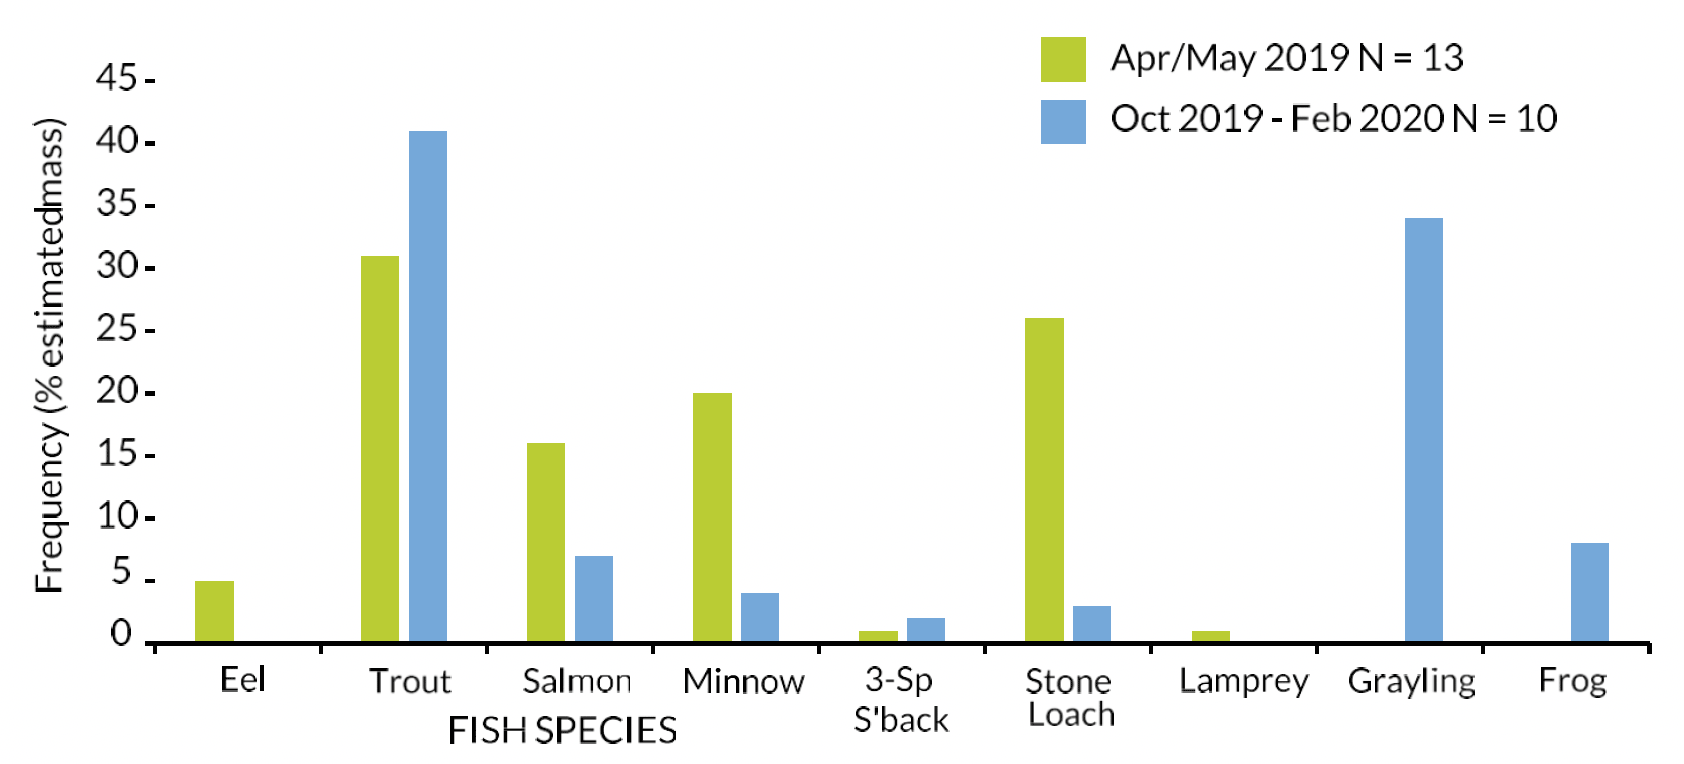
4b.2 River Nith Goosanders
Ten carcases during autumn-winter 2019/20 were available, 10 of them had stomach contents. Of these, all contained Trout and most contained Salmon (80%), followed by Minnow and 3-Spined Stickleback (70% each). Over half the stomachs contained Grayling (60%) under half contained Stone Loach (40%), and two contained Common Frogs (20%, Table 8).
| No. (%) of Goosanders | Fish species | No. fish | Estimated mass (g) | % by mass |
|---|---|---|---|---|
| 10 (100%) | Trout | 81 | 546 | 41 |
| 6 (60%) | Grayling | 20 | 458 | 34 |
| 2 (20%) | Common Frog | 3 | 111 | 8 |
| 8 (80%) | Salmon | 11 | 98 | 7 |
| 7 (70%) | Minnow | 74 | 54 | 4 |
| 4 (40%) | Stone Loach | 10 | 37 | 3 |
| 7 (70%) | 3-Sp Stickleback | 64 | 25 | 2 |
| N = 10 birds | Totals | 200 | 1329 |
Due to the constraints of small samples (current and historical), no comparison is possible with historical data. Although the autumn-winter stomachs containing food is <12, a comparison is nevertheless made with data from the 2019 smolt run period (presented in Table 4) in Figure 13.
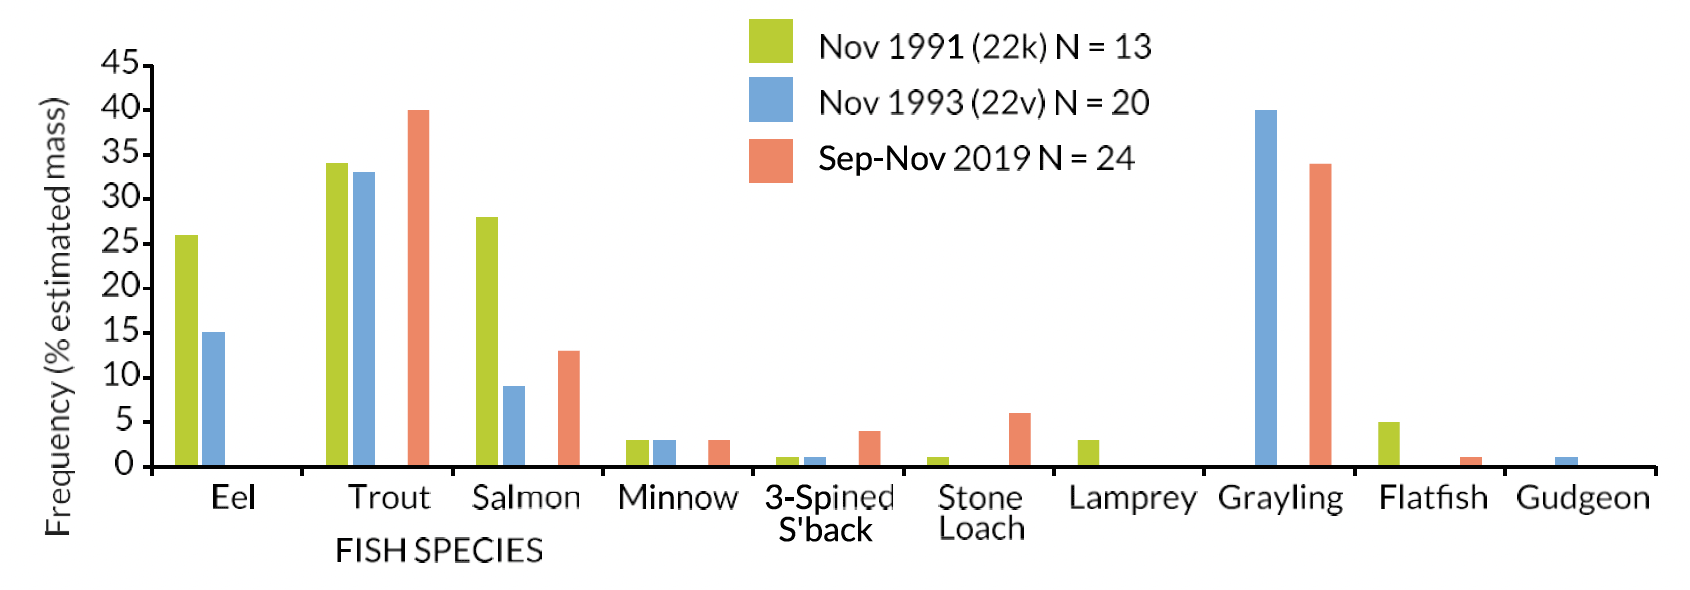
4b.3 River Tweed Goosanders
Twenty-four carcases during autumn 2019 were available, 24 of them had stomach contents. Of these, almost three-quarters contained 3-Spined Stickleback, and rather fewer contained Minnow (62%), and Trout and Salmon (58% each). Fewer than a third of stomachs (29%) contained Grayling, even fewer contained Stone Loach (21%), and one stomach (4%) contained Flatfish (Table 9).
| No. (%) of Goosanders | Fish species | No. fish | Estimated mass (g) | % by mass |
|---|---|---|---|---|
| 14 (58%) | Trout | 37 | 699 | 40 |
| 7 (29%) | Grayling | 18 | 606 | 34 |
| 14 (58%) | Salmon | 36 | 229 | 13 |
| 5 (21%) | Stone Loach | 22 | 99 | 6 |
| 17 (71%) | 3-Sp Stickleback | 177 | 75 | 4 |
| 15 (62%) | Minnow | 40 | 47 | 3 |
| 1 (4%) | Flatfish | 2 | 7 | <1 |
| N = 24 birds | Totals | 332 | 1762 |
Comparison with relevant historical samples (by time of year) from Marquiss et al. (1998) are given in Figure 14.
For the sampling periods of the current study, it was also possible to compare the autumn diet of Goosanders on the R. Tweed with data from previous smolt run period (presented in Table 7) in Figure 15.
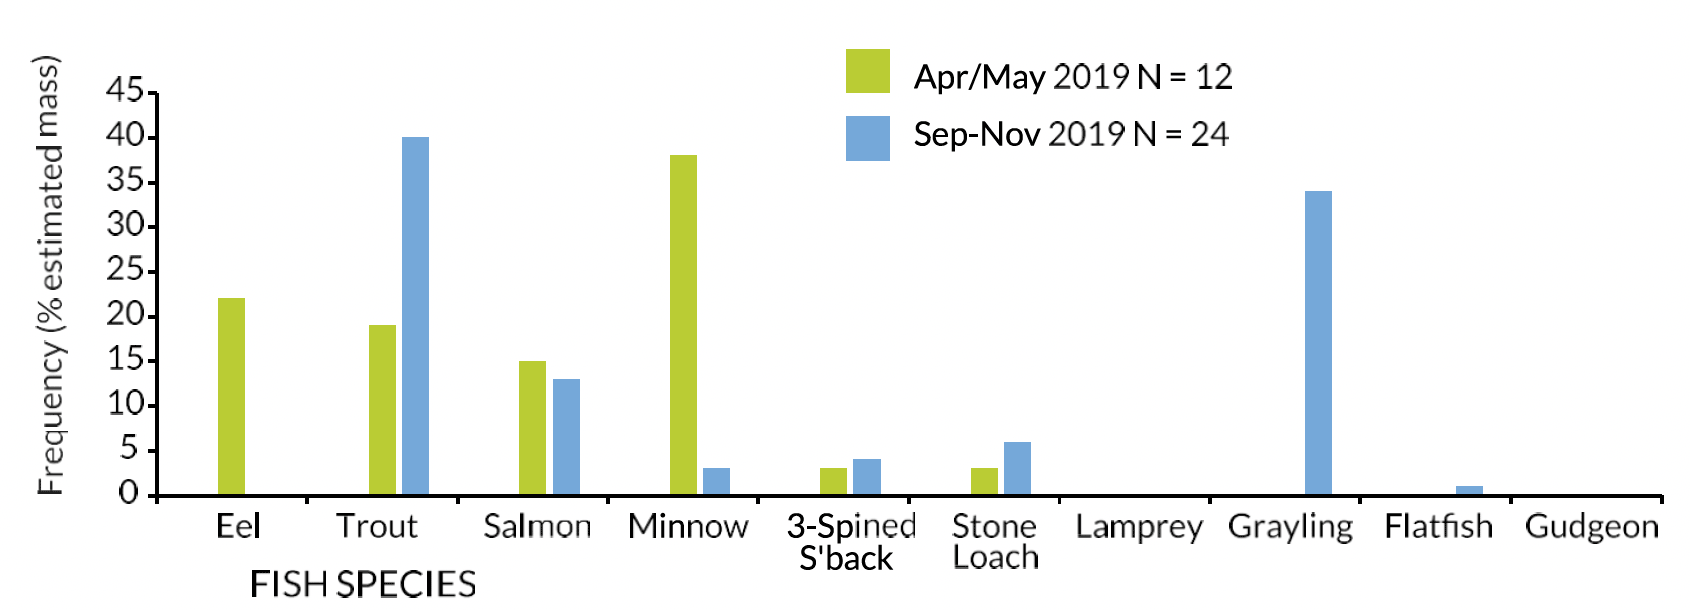
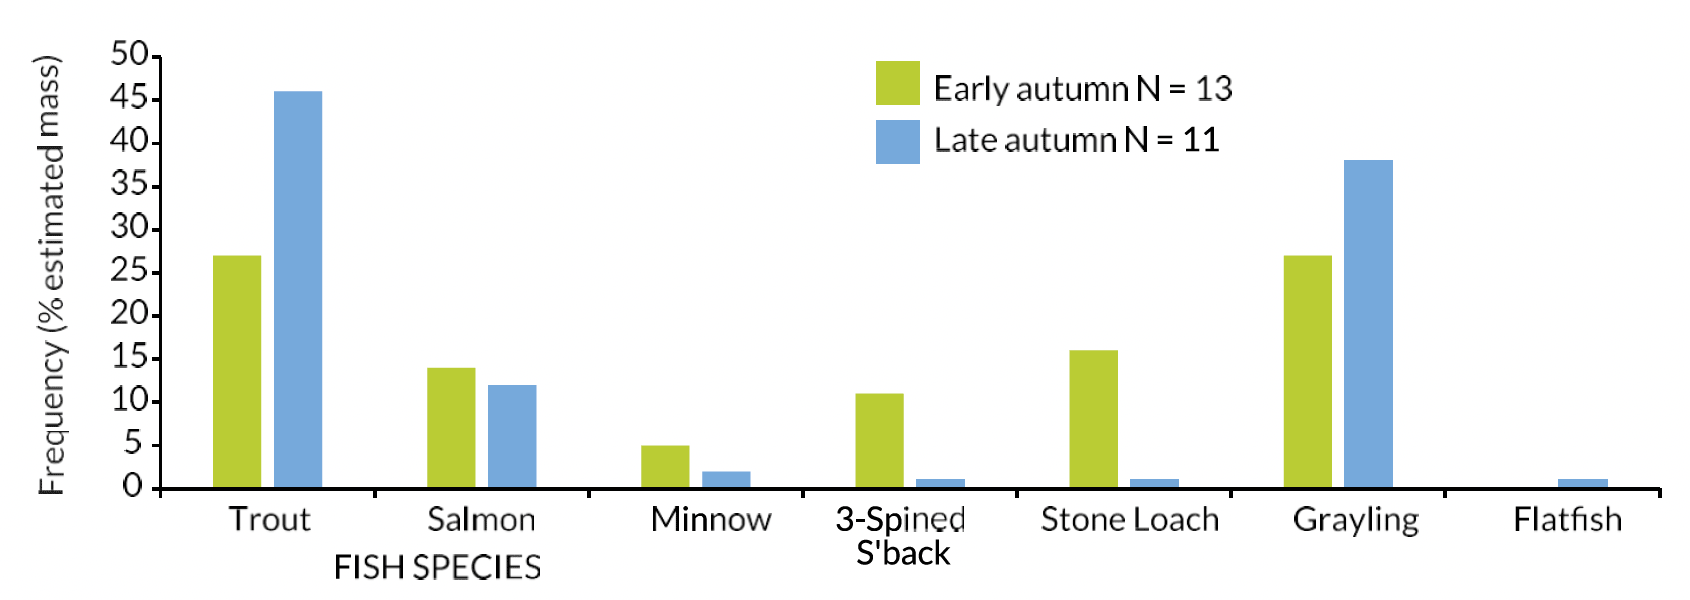
Sample sizes of Goosanders from the R. Tweed were large enough in the current study to look for differences in diet between early and late autumn (Sep-Oct vs Nov 2019, respectively), as shown in Figure 16.
4b.4 River Spey Goosanders
Eight carcases were available, 7 of them had stomach contents contained:
57 Salmon (estimated mass 450g, 64% by biomass), 23 Trout (240g, 34%), and 13 Minnow (17g, 2%). All stomachs contained Trout, most contained Salmon (89%), and around a third contained Minnow (29%, 2 birds).
Due to the constraints of small samples (current and historical), no comparison is possible with previous data, including that from the 2019 smolt run period.
4b.5 River Dee Cormorants
Four carcases during winter 2019/20 were available, 3 of them had stomach contents contained: 1 adult Salmon (estimated mass 1020g, 60% by biomass), and 2 Pike (668g, 40%). One stomach contained an adult Salmon and the other two each contained a single Pike.
Due to the constraints of small samples (current and historical), no comparison is possible with previous data, including that from the 2019 smolt run period.
4b.6 River Nith Cormorants
Twelve carcases during autumn-winter 2019/20 were available, 12 of them had stomach contents. Three quarters of stomachs contained Grayling and most contained Minnow (58%). Half the stomachs contained Trout and Salmon, and a third contained 3-Spined Stickleback and adult Salmon. Single Rainbow Trout, Grey Mullet, and Stone Loach were each found in one stomach (8%, Table 10).
| No. (%) of Cormorants | Fish species | No. fish | Estimated mass (g) | % by mass |
|---|---|---|---|---|
| 4 (33%) | Adult Salmon | 4 | 1748 | 37 |
| 9 (75%) | Grayling | 48 | 1599 | 34 |
| 6 (50%) | Trout | 22 | 753 | 16 |
| 1 (8%) | Rainbow Trout | 1 | 432 | 9 |
| 6 (50%) | Salmon | 8 | 111 | 2 |
| 7 (58%) | Minnow | 24 | 54 | 1 |
| 4 (33%) | 3-Sp Stickleback | 21 | 8 | <1 |
| 1 (8%) | Grey Mullet | 1 | 8 | <1 |
| 1 (8%) | Stone Loach | 1 | 3 | <1 |
| N = 12 birds | Totals | 130 | 4716 |
Due to a lack of historical samples and a small sample from the 2019 smolt run period, no comparisons are possible with previous data.
4b.7 River Tweed Cormorants
Twenty-seven carcases during autumn 2019 were available, 24 of them had stomach contents. Most stomachs contained Trout (58%) and just over half contained 3-Spined Stickleback. Just less than half of the stomachs contained Salmon and Minnow (46% each) or Grayling (42%). A single large Salmonid, adult Salmon, large Trout, Flatfish, and Gudgeon were each found in one stomach (4%, Table 11). Due to a lack of historical samples, no comparisons are possible with previous data.
| No. (%) of Cormorants | Fish species | No. fish | Estimated mass (g) | % by mass |
|---|---|---|---|---|
| 14 (58%) | Trout | 35 | 1292 | 26 |
| 1 (4%) | Large Salmonid | 1 | 1020 | 20 |
| 1(4%) | Adult Salmon | 1 | 694 | 14 |
| 10 (42%) | Grayling | 20 | 572 | 11 |
| 1 (4%) | Large Trout | 1 | 481 | 10 |
| 11 (46%) | Minnow | 215 | 446 | 9 |
| 11 (46%) | Salmon | 26 | 401 | 8 |
| 1 (4%) | Flatfish | 1 | 108 | 2 |
| 13 (54%) | 3-Sp Stickleback | 54 | 18 | <1 |
| 1 (4%) | Gudgeon | 1 | 18 | <1 |
| N = 24 birds (100%) | Totals | 355 | 5050 |
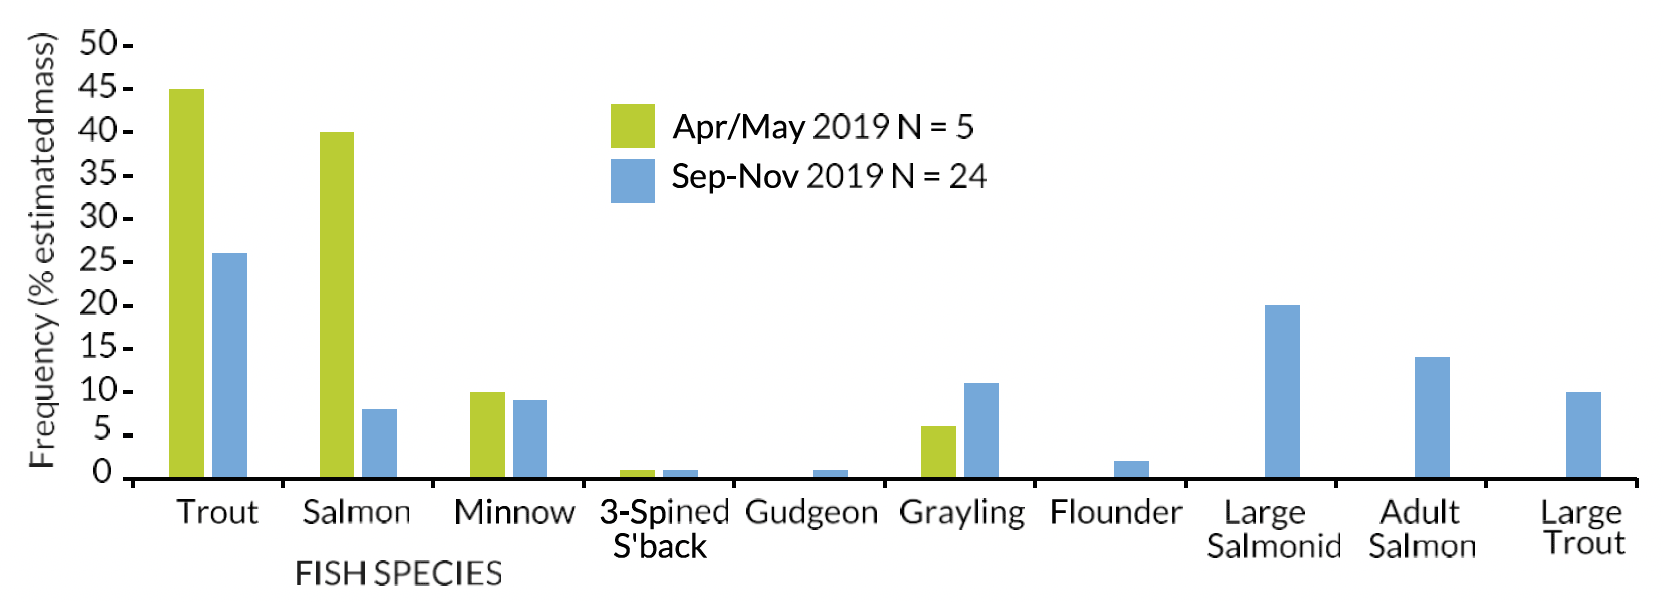
For the sampling period of the current study, it was possible to compare the autumn diet of Cormorants on the R. Tweed with data from the previous smolt run period (presented in Table 6), as shown in Figure
17. However, any interpretation must be made with caution as the latter sample (n = 5 stomach with food) is likely to be too small to be representative of general diet.
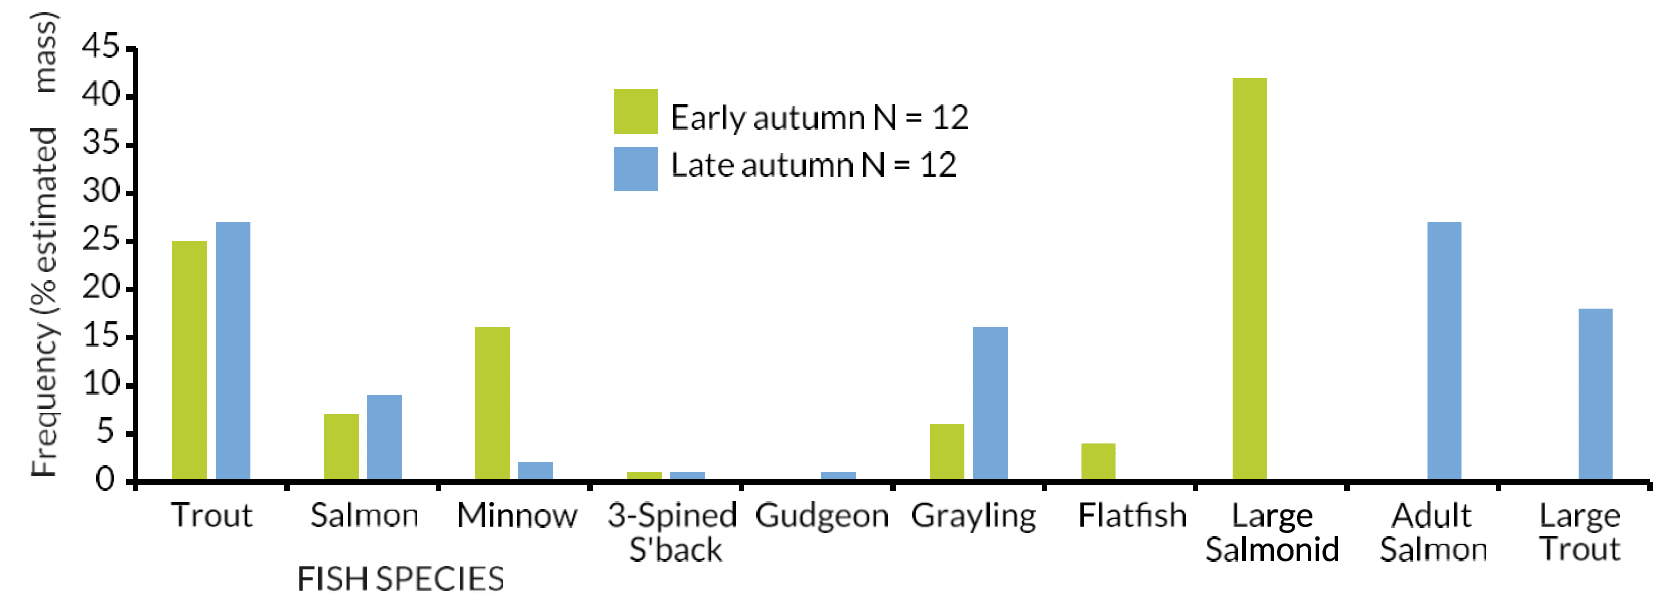
Sample sizes of Goosanders from the R. Tweed were large enough in the current study to look for differences in diet between early and late autumn 2019 (Sep-Oct vs Nov, respectively), as shown in Figure 18.
4b.8 River Spey Cormorants
Thirteen carcases during winter 2019/20 were available, 8 of them had stomach contents contained:
7 large Trout (estimated mass 4856g, 59% by biomass), 2 adult Salmon (2245g, 27%), 1 large Salmonid (1148g, 14%), 1 Salmon (7g, <1%), and 1 Minnow (3g (<1%). Most stomachs contained large Trout (88%), two (25%) contained adult Salmon, and single stomachs (12.5%) each contained a single large Salmonid, Salmon, and Minnow.
Due to the constraints of small samples (current and historical), no comparison is possible with previous data, including that from the 2019 smolt run period.
(c) Statistical analysis for some stomach contents samples
For a limited number of samples, it was possible to investigate statistically any differences in diet assessments (using K-S tests as described in section 2) with the dietary data under comparison being the estimated mass of each fish species recorded in each stomach that contained food. Historical data in the required form (i.e. mass of each prey species per stomach with food) were only available for a single previous sample (Tweed Goosanders, April 1992, N = 55 birds containing food). Consequently, statistical comparisons of general diet were made between samples of Tweed Goosanders in the smolt run period 2019, spring 1992, autumn 2019, and both early and late autumn 2019 separately.
Statistical comparisons between pairs of samples could not be made if all of the stomachs in either sample contained no records of a particular species: this was the case for Lamprey, Gudgeon, Flatfish and Grayling. Statistical comparisons were possible for one of the pairs of Eel samples and some of the Stone Loach ones but none were significant. In this necessarily restricted analysis, significant dietary differences were found for Salmon, Trout, Minnow, and 3-Spined stickleback (Table 12).
| Tweed Goosander | Salmon | Trout | Minnow | 3-Sp s'back | |||||
|---|---|---|---|---|---|---|---|---|---|
| Sample1 | Sample2 | D | p | D | p | D | p | D | p |
| April 1992 | Apr/May 2019 | 0.24 | 0.24 | 0.11 | 0.87 | 0.72 | 1.9e-7 | 0.27 | 0.03 |
| Apr/May 2019 | Autumn 2019 | 0.17 | 0.37 | 0.21 | 0.13 | 0.71 | 6.3e-13 | 0.29 | 0.01 |
| Apr/May 2019 | Autumn 2019 E | 0.37 | 0.02 | 0.13 | 0.64 | 0.76 | 1.0e-8 | 0.35 | 0.02 |
| Apr/May 2019 | Autumn 2019 L | 0.20 | 0.51 | 0.47 | 3.8e-3 | 0.75 | 4.8e-7 | 0.24 | 0.17 |
Salmon
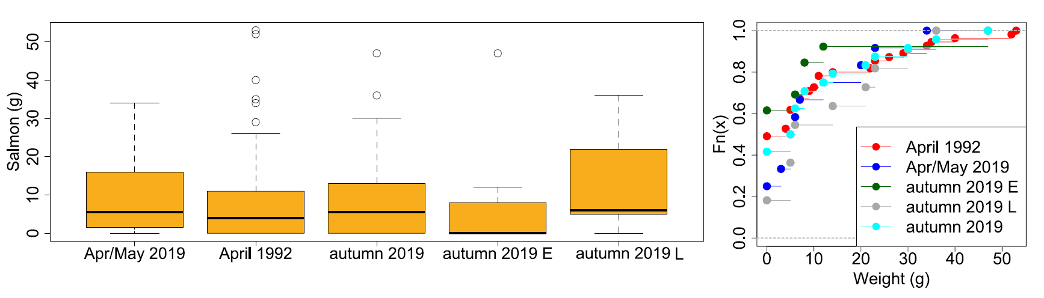
The only significant difference for the Salmon component of the Tweed Goosander diet samples was between those from Apr-May 2019 and early Autumn 2019 (Table 12).
Boxplots for the mass (g) of Salmon in stomachs for the Tweed Goosander samples are shown in Figure 19a and ecdf plots in Figure 19b. As can be seen in the boxplots, the Salmon component of the diet in the Apr-May 2019 sample had a median mass of 5.5g, higher than the median mass of the early Autumn 2019 sample which was 0g.
Trout
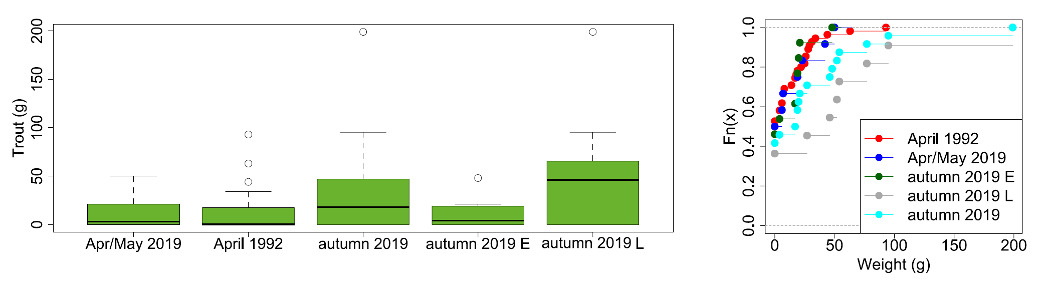
The only significant difference for the Trout component of the Tweed Goosander diet samples was between those from Apr-May 2019 and late Autumn 2019 (Table 12).
Boxplots for the mass (g) of Trout in stomachs for the Tweed Goosander samples are shown in Figure 20a and ecdf plots in Figure 20b. As can be seen in the boxplots, the Trout component of the diet in Apr-May 2019 sample had a median mass of 3g, lower than the median mass of the late Autumn 2019 sample which was 46g (see also Figure 15).
Minnow
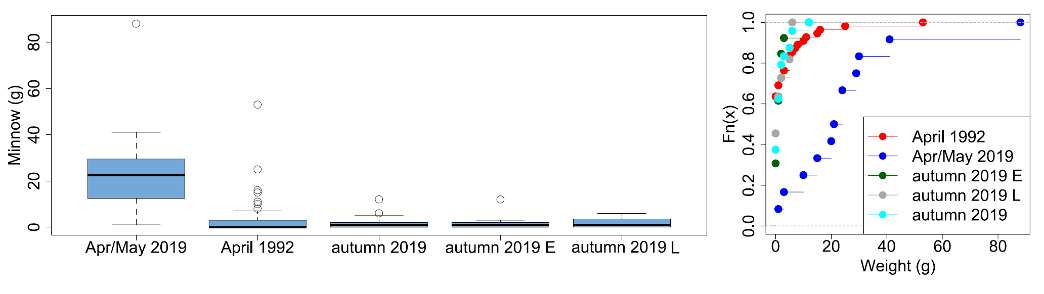
There were significant differences for the Minnow component of the Tweed Goosander diet samples for all comparisons (Table 12).
Boxplots for the mass (g) of Minnow in stomachs for the Tweed Goosander samples are shown in Figure 21a and ecdf plots in Figure 21b. As can be seen in the boxplots, the Minnow component of the diet in the Apr-May 2019 sample had a median mass of 22.5g, higher than the median mass of the April 1992 sample which was 0g (see also Figure 10), and of the Autumn 2019 sample when it was 1g (see also Figure 15), as it was in both early and late autumn samples.
3-Spined stickleback
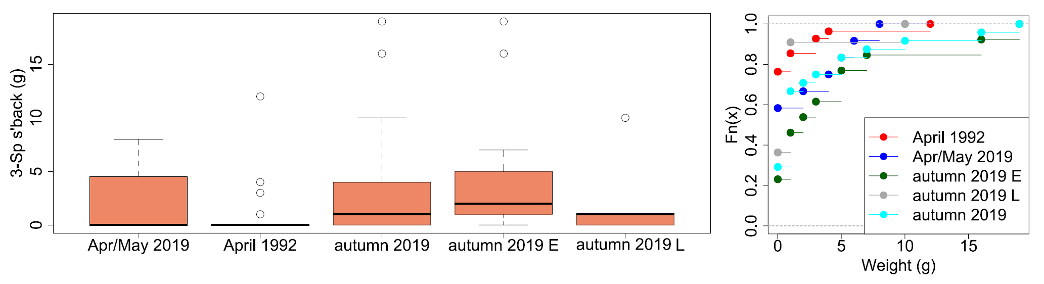
There were three significant differences for the 3-Spined stickleback component of Tweed Goosander diet samples (Table 12).
Boxplots for the mass (g) of 3-Spined stickleback in stomachs for the Tweed Goosander samples are shown in Figure 22a and ecdf plots in Figure 22b. As can be seen in the boxplots, the 3-Spined stickleback component of the diet in both the smolt run period 2019 and April 1992 samples had a median mass was 0g, the median mass in Autumn 2019 was 1g, and in early autumn 2019 sample it was 2g.
(d) Broad summary: proportions of Salmon in the diet
Overall, samples for the two bird species on each of the four study rivers, collected over two time periods (the smolt run and autumn-winter), give a total of 16 samples (Table 13). However, three 'samples' (3/16 = 19%, indicated in red in Table 13) were void, either because there were no birds sampled (N/a) or no Salmon were recorded in those birds that did contain food (None).
Fewer than half of these samples (7/16 = 44%, indicated in green in Table 13) were large enough to be confident that they were representative of general diet (i.e. at least 12 stomachs with food, Marquiss & Carss, 1997). This proportion was highest for diet assessments during the smolt run period for Goosanders from all study rivers, and the autumn-winter period for both Goosanders and Cormorants from the R. Tweed, and Cormorants from the R. Nith. Some dietary information was available for the remaining samples (6/16 = 38%, indicated in amber in Table 13) and, although samples were small, it appeared to follow the patterns described below for other samples.
From Table 13, the proportions of Salmon in Goosander stomach contents from the smolt run period sample were highest from the Dee (50% by mass), followed by the Spey (36%), Nith (16%), and Tweed (15%). At this time of year, Salmon comprised the highest proportion of diet by mass on the Dee, and the second highest after Trout (36%) on the Spey. On the Nith and Tweed, four species were taken in higher proportions than Salmon (Trout, Stone Loach, Minnow on the Nith; Minnow, Eel, Trout on the Tweed).
Proportions of Salmon were low in the autumn-winter samples of Tweed Goosanders (13% by mass) and Cormorants (8%), and of Nith Cormorants (2%). In none of these samples were Salmon the main species in the diet by mass. Two species (Trout, Grayling) were taken in higher proportions by Tweed Goosanders, six others (Trout, large Salmonid, adult Salmon, Grayling, large Trout, Minnow) by Tweed Cormorants, and four others (adult Salmon, Grayling, Trout, Rainbow Trout) by Nith Cormorants.
Clearly, Cormorant diet in autumn-winter was often dominated by large Salmonids – presumably adult Salmon and Trout around the spawning period. In general, apart from the Dee sample in the spring and those (albeit with small sample size) from the Dee and Spey in autumn, the proportions of Salmon in Goosander stomach contents in either the smolt run or autumn-winter periods were not particularly high, and Salmon seldom comprised the highest proportion of the diet, other species often being consumed in larger proportions by mass. The same was true for the two autumn-winter Cormorant samples from the Tweed and Nith.
| River and bird species | Smolt run period | Autumn-winter period | ||
|---|---|---|---|---|
| Proportion of Salmon in diet assessment | ||||
| By mass | In relation to other species | By mass | In relation to other species | |
| Dee Goosander | 50%(1) | Highest proportion(1) | 72%(2) | Highest proportion(2) |
| Nith Goosander | 16%(1) | 4th after Trout, Stone Loach, Minnow(1) | 7%(2) | 4th after Trout, Grayling, Common Frog(2) |
| Tweed Goosander | 15%(1) | 4th after Minnow, Eel, Trout(1) | 13%(1) | 3rd after Trout, Grayling(1) |
| Spey Goosander | 36%(1) | 2nd after Trout(1) | 64%(2) | Highest proportion(2) |
| Dee Cormorant | N/a(3) | - (3) | None(3) | - (3) |
| Nith Cormorant | 19%(2) | 3rd after Perch, Trout(2) | 2%(1) | 5th after adult Salmon, Grayling, Trout, Rainbow Trout(1) |
| Tweed Cormorant | 40%(2) | 2nd after Trout(2) | 8%(1) | 7th after Trout, large Salmonid, adult Salmon, Grayling, large Trout, Minnow(1) |
| Spey Cormorant | None(3) | - (3) | 1%(2) | 4th after large Trout, adult Salmon, large Salmonid(2) |
(1) Samples of 12 or more stomachs with food
(2) Samples with fewer than 12 stomachs with food
(3) Samples with either no birds or no Salmon