Agricultural tenancy data collection for Scotland: methodology report
This report explains the research methods used to develop and test improved agricultural tenancy questions, including reviews, interviews, workshops and surveys that informed the final recommendations.
Part of
Appendix C: Survey results for Set C
This section presents selected survey results for Set C: JAC (Branching logic), focusing on the questions that captured user feedback. The table below indicates which findings are included.
| Section | Reported | Description |
|---|---|---|
| Section 1: Question testing | Not included | In this section, respondents were asked to complete the Set C tenancy questions as accurately as possible. |
| Section 2: User experience | Yes | This section captured respondents’ feedback on Set C, including general impressions, comprehension, and perceived accuracy. |
| Section 3: Alternative approaches | Yes | Respondents were presented with Set A and Set B and asked to provide indirect feedback to enable high-level comparison, including which set they considered easiest to complete and most user-friendly. |
| Section 4: Demographics | Included in main report | Optional demographic questions collected information about respondents and their agricultural holdings. This data was used solely to monitor the diversity of responses. |
This survey received 5 responses. Note that due to the small sample size, results are presented as raw counts rather than percentages. As referenced in the main report, these findings were not used in isolation but triangulated with evidence from other research activities to validate and test emerging insights. For a consolidated summary of conclusions, please refer to the accompanying Findings Report.
Set C: Results for Section 2: User experience
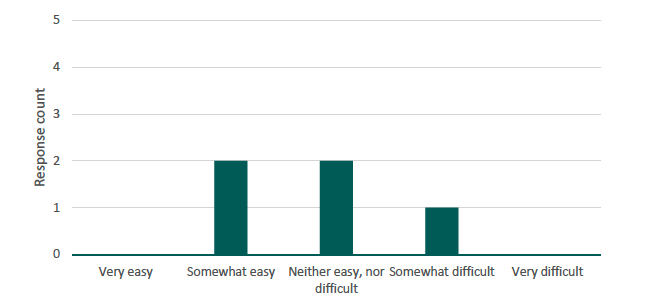
Question 1: Overall, how easy or difficult was it to answer the form displayed in the previous section?
Most respondents did not find it easy to fill in the Set C form. More specifically, out of the 5 respondents, 2 found it “Somewhat easy,” 2 “Neither easy, nor difficult,” and 1 “Somewhat difficult.”
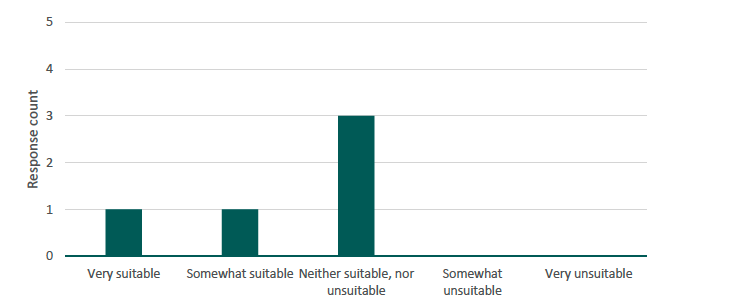
Question 2: How suitable did you find the length of the form?
The majority of respondents (3/5) did not find the length of Set C questions suitable. More specifically, out of the 5 respondents, 1 found it “Very suitable,” 1 “Somewhat suitable,” and 3 “neither suitable, nor unsuitable.”
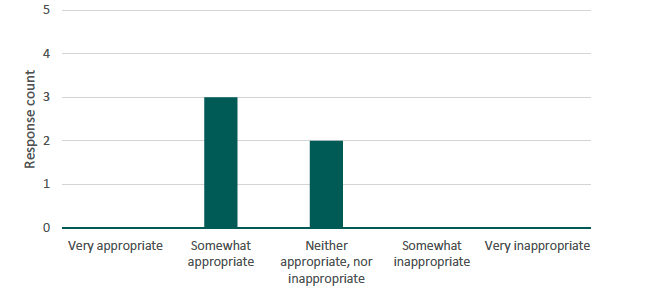
Question 3: How appropriate did you find the level of detail in the form?
The majority of respondents (3/5) found Set C questions’ level of detail appropriate. More specifically, out of the 5 respondents, 3 found it “Somewhat appropriate” and 2 “neither appropriate, nor inappropriate.”
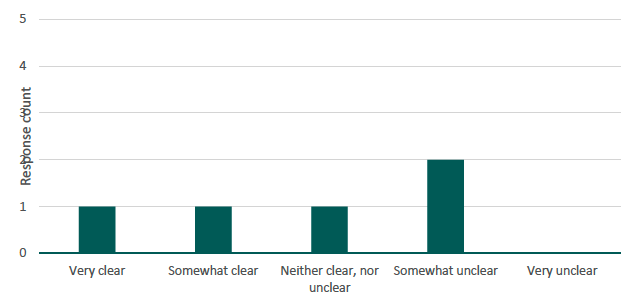
Question 4: How clear were the instructions for completing the form?
The majority of respondents (3/5) did not find the instructions for completing Set C questions clear. More specifically, out of the 5 respondents, 1 found it “Very clear,” 1 “Somewhat clear,” 1 “Neither clear, nor unclear,” while 2 found it “Somewhat unclear.”
Question 5: Approximately, how many minutes did it take you to complete the form?
The median for form completion was 5 minutes, and the average completion time was 6.2 minutes. Responses ranged from 3 to 10 minutes.
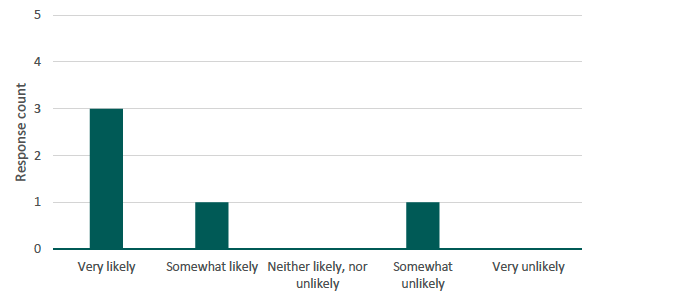
Question 6: If these questions were included in the June Agricultural Census, how likely would you be to complete them each year?
The majority of respondents (4/5) indicated that if questions were included in the June Agricultural Census as shown in Set C, they would be likely complete them each year. More specifically, out of the 5 respondents, 3 found it “Very likely,” 1 “Somewhat likely,” and 1 “Somewhat unlikely.”
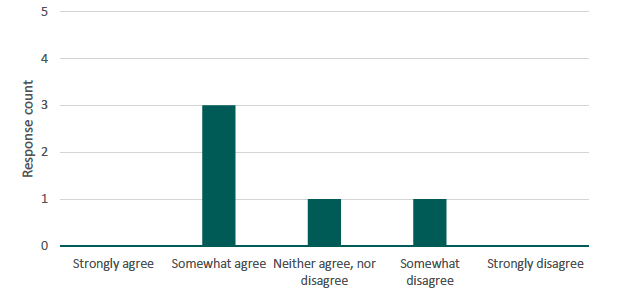
Question 7: To what extent do you agree with the following statement? “The wording of questions was easy to understand.”
The majority of respondents (3/5) found the wording of the questions easy to understand. More specifically, out of the 5 respondents, 3 reported that they “Somewhat agree,” 1 that they “Neither agree, nor disagree,” while 1 that they “Somewhat disagree.”
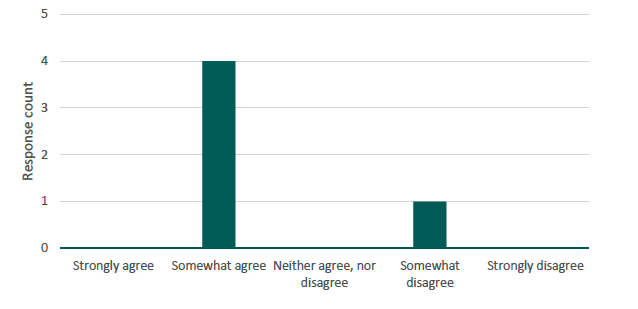
Question 8: To what extent do you agree with the following statement? “I was confident about what information to enter in each question.”
The majority of respondents (4/5) reported confidence about the information they should enter in each question. More specifically, out of the 5 respondents, 4 reported that they “Somewhat agree,” while 1 that they “Somewhat disagree.”
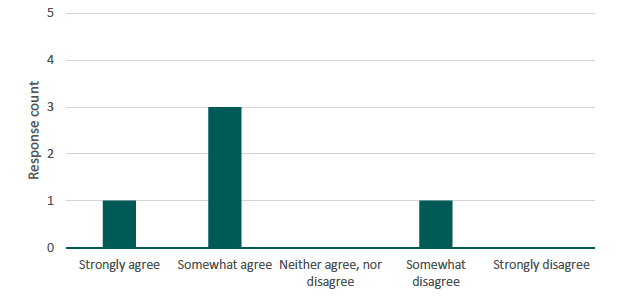
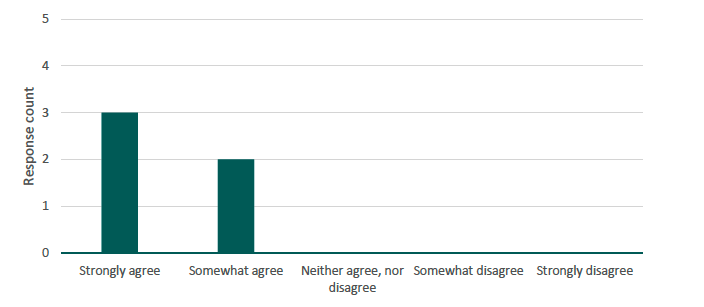
Question 9: To what extent do you agree with the following statement? “I felt confident about the information I provided in each question.”
The majority of respondents (4/5) reported confidence about the information they provided in each question. More specifically, out of the 5 respondents, 1 reported that they “Strongly agree,” 3 that they “Somewhat agree,” while 1 that they “Somewhat disagree.”
Question10: To what extent do you agree with the following statement? “I understood the definitions of tenancy types and other technical terms used in the form.”
All respondents (5/5) reported confidence in understanding the definitions of tenancy types and other technical terms used in the form. More specifically, out of the 5 respondents, 3 reported that they “Strongly agree” and 2 that they “Somewhat agree.”
Question 11: How easy or difficult was it to identify the tenancy type(s) you hold?
Most respondents (4/5) found it easy to identify the tenancy type(s) they hold. More specifically, out of the 5 respondents, 2 found it “Very easy,” 2 “Somewhat easy,” while 2 respondents found it “Neither easy, nor difficult.”
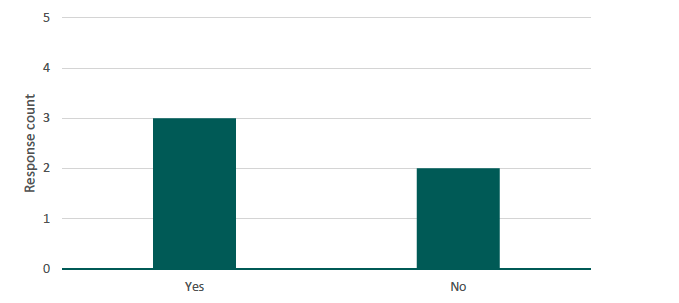
Question 12: Were there any terms or categories that felt unclear?
Most respondents (3/5) found terms or categories unclear.
The lack of clarity arose from the use of unfamiliar terminology (e.g., “seasonal lets” and “land let”), combined with one respondent completing the questionnaire from a landlord’s perspective, while the questions were designed for tenants.
Set C: Results for Section 3: Alternative approaches
Set C respondents were presented with Set A first and then Set B, and were asked to hypothetically compare with Set C.
Performance versus Set A: JAC (Targeted refinements)
Set C respondents were presented with the rationale for Set A with the following text and the accompanying guidance (Appendix E):
“This approach would follow the same format as the original June Agricultural Census, with small enhancements to improve the clarity of wording and the level of detail in the instructions. In addition, a two-page supporting guidance document would be provided for respondents who are unsure about some or all their tenancy type(s). A sample of this guidance is included below.”
They were then asked to compare this approach with Set C, while also answering some questions regarding its usability.
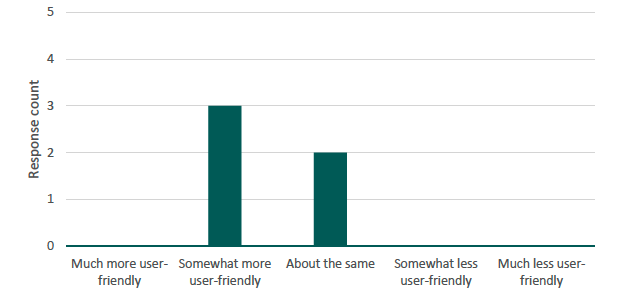
Question 13: Compared to the form you filled in Part 1, does this approach sound more or less user-friendly?
Half of the respondents (3/5) found the Set A format more user-friendly than Set C. More specifically, out of the 10 respondents, 3 reported that they find it “Somewhat more user-friendly,” and 2 that they find it “About the same.”
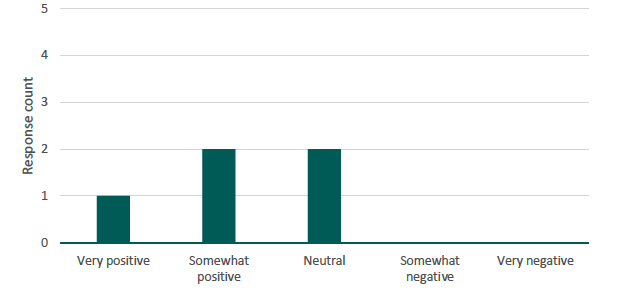
Question 14: What do you think of this approach?
Half of the respondents (3/5) had a positive view towards the Set A format. More specifically, out of the 5 respondents, 1 reported that they are “Very positive,” 2 that they are “Somewhat positive,” and 2 that they find it “Neutral.”
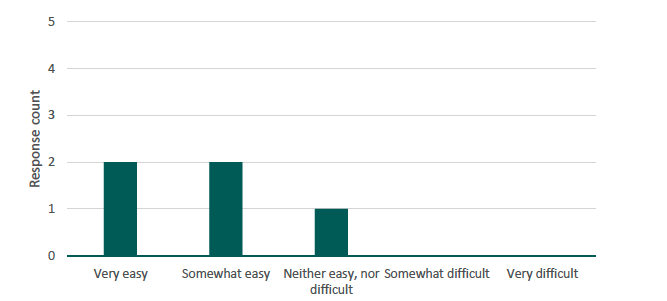
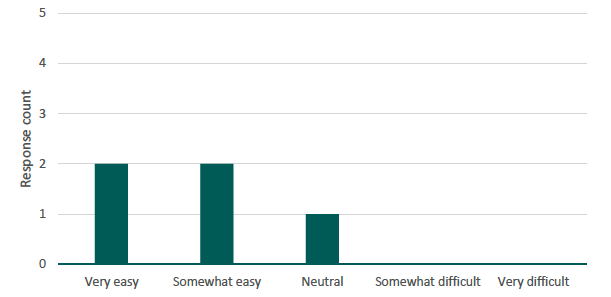
Question 15: How easy would it be for you to identify your tenancy type(s) using this approach?
The majority of respondents (4/5) reported that it would be easy to identify their tenancy type(s) using the Set A format. More specifically, out of the 5 respondents, 2 reported that it would be “Very easy,” 2 that it would be “Somewhat easy,” and 1 “Neutral.”
Performance versus Set B: SAF (Alternative vehicle)
Set C respondents were presented with the rationale for Set B, along with the following text:
“This approach would collect tenancy information using the Single Application Form, rather than reintroducing the questions into the June Agricultural Census. Embedding the questions in this form may make it easier for respondents to provide accurate information because:
- Respondents are more likely to have the relevant tenancy information readily available.
- Respondents can seek professional support if they are unsure about the details of their tenancy agreement(s).
In addition, this approach may improve the quality of tenancy data and capture information at a more detailed level, helping policymakers to provide more accurate and targeted support to farmers.”
They were then asked to compare this approach with Set C, while also answering some questions regarding its usability.
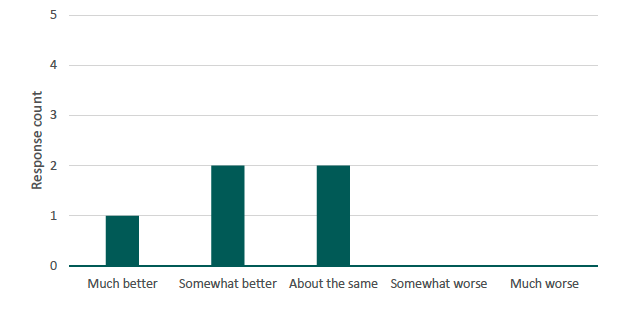
Question 16: Overall, how do you feel about this approach compared to the form you filled in Part 1?
The majority of respondents (3/5) found incorporating tenancy questions in the SAF to be a better format than Set C. More specifically, out of the 5 respondents, 1 reported that they find it “Much better,” 2 that they find it “Somewhat better,” and 2 that they find it “About the same.”
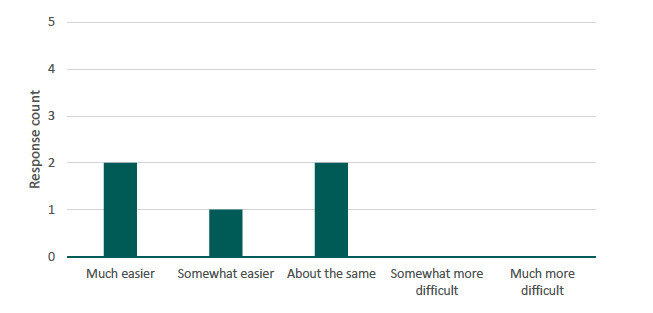
Question 17: Would embedding agricultural tenancy questions in the Single Application Form make it easier for you to provide accurate information?
The majority of respondents (3/5) found embedding tenancy questions in the SAF form as a way to make it easier for them to report information. More specifically, out of the 5 respondents, 2 reported that it would make it “Much easier,” 1 that it would make it “Somewhat easier,” and 2 that it would be “About the same.”
Figure 32: Perceived accuracy improvement using SAF as a vehicle
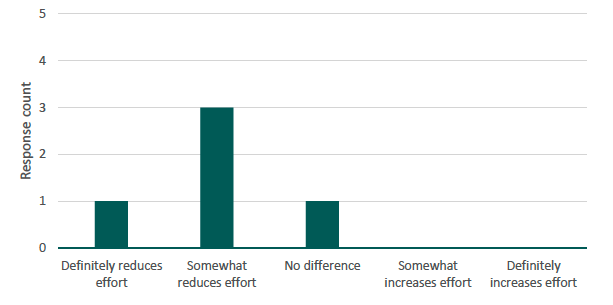
Question 18: Would asking agricultural tenancy questions in the Single Application Form reduce the effort needed to answer these questions, compared to the other approaches?
The majority of respondents (4/5) felt that incorporating tenancy questions within the SAF form would reduce the effort required to answer, compared with the other formats. More specifically, out of the 5 respondents, 1 reported that it “Definitely reduces effort,” 3 that it “Somewhat reduces effort,” and 1 that it makes “No difference.”
Contact
Email: agric.stats@gov.scot