Achievement of Curriculum for Excellence levels: 2021/22
Achievement of Curriculum for Excellence (CfE) Levels 2021/22 provides information on national performance in literacy and numeracy, based on all pupils in publicly funded Primary 1, Primary 4, Primary 7 and Secondary 3 classes, and for all pupils based in special schools/units.
Part of
Chapter 3: Achievement of CfE Levels by Deprivation
Key Findings
- The gap between the proportion of primary pupils (P1, P4 and P7 combined) from the most and least deprived areas who achieved their expected level in literacy decreased from 24.7 percentage points in 2020/21 to 21.3 percentage points in 2021/22.
- The gap between the proportion of primary pupils (P1, P4 and P7 combined) from the most and least deprived areas who achieved their expected level in numeracy decreased from 21.4 percentage points in 2020/21 to 17.8 percentage points in 2021/22.
- For both primary literacy and primary numeracy, the gap remained wider than in 2018/19 and for primary numeracy, the size of the gap in 2021/22 was larger than at any point between 2016/17 and 2018/19.
- In 2021/22, the gap between the proportion of S3 pupils from the most and least deprived areas who achieved Third Level or better increased in both literacy and numeracy compared to 2018/19, and was the largest since 2016/17.
This chapter provides an overview of Achievement of CfE Levels by pupils based on the deprivation level of the area they live in, as measured by the Scottish Index of Multiple Deprivation (SIMD). It provides information on literacy and numeracy for P1, P4 and P7 combined and for S3. Full details (including all stages, organisers and SIMD quintile categories) are available in the supplementary tables.
When considering data by SIMD as a measure of multiple deprivation, it is important to note that the data show the difference between young people living in the most and least deprived areas. What SIMD does not show is the difference between young people from poor or rich backgrounds.
The figures shown in Charts 1, 2, 3 and 4 (see pages 13, 14, 15, and 16) provide four of the 11 key National Improvement Framework measures used to measure the poverty-related attainment gap. These key measures are:
- Percentage of P1, P4 and P7 pupils combined achieving expected Level in Literacy;
- Percentage of P1, P4 and P7 pupils combined achieving expected Level in Numeracy;
- Percentage of S3 pupils achieving Third Level or better in Literacy and;
- Percentage of S3 pupils achieving Third Level or better in Numeracy.
The charts show Achievement of CfE Levels by SIMD since 2016/17, with the pp abbreviation indicating percentage point difference between most and least deprived (referred to as the attainment gap). Please note, 2016/17 to 2018/19 figures are based on SIMD 2016, whereas 2020/21 and 2021/22 figures are based on SIMD 2020. Caution should be exercised if making comparisons over time; for more information see Section 9.1.4.3.
3.1 Achievement of CfE Levels by Deprivation – P1, P4 and P7 pupils
Chart 1 provides information on the percentages of P1, P4 and P7 pupils combined who achieved the expected levels in literacy.
The attainment gap between pupils from the most and least deprived areas decreased from 24.7 percentage points in 2020/21 to 21.3 percentage points in 2021/22. This is wider than in 2018/19 (20.7 percentage points) but slightly narrower than in 2017/18 (21.6pp) or 2016/17 (22.1pp).
The proportions of P1, P4 and P7 pupils combined achieving the expected level in literacy increased in 2021/22 compared to 2020/21 for pupils in both the most and least deprived areas. The proportion increased more for pupils from the most deprived areas which has led to narrowing the gap.
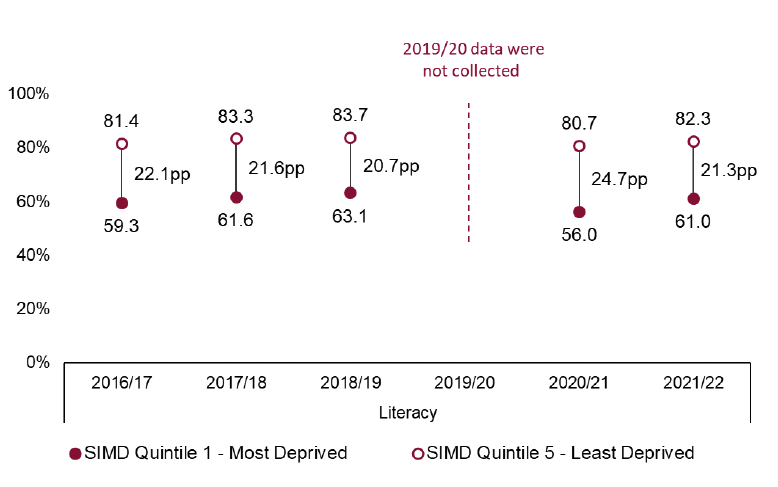
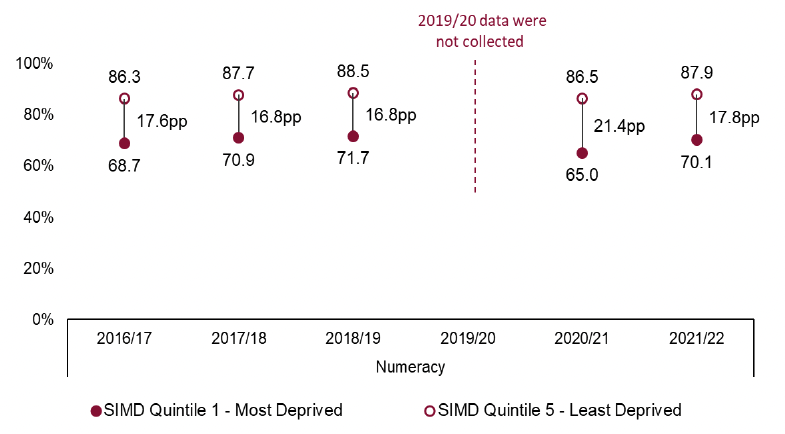
Chart 2 provides information for P1, P4 and P7 pupils combined who achieved the expected levels in numeracy.
The numeracy attainment gap decreased from 21.4 percentage points in 2020/21 to 17.8 percentage points in 2021/22. This remains slightly wider than it was between 2016/17 and 2018/19.
Compared to 2020/21, the proportions of P1, P4 and P7 pupils combined achieving the expected numeracy levels have increased for both pupils in the most and least deprived areas in 2021/22. The gap has narrowed as the proportion increased more for pupils from the most deprived areas.
3.2 Achievement of CfE Levels by Deprivation – S3 pupils
Chart 3 shows the proportion of S3 pupils who achieved Third Level or better in literacy, for pupils in the most and least deprived areas.
The chart shows that the proportion of S3 pupils who achieved Third Level or better in literacy remained broadly stable between 2016/17 and 2018/19, for pupils from both the most and the least deprived areas.
In 2021/22, for both the most and least deprived areas, the proportions of S3 pupils who achieved Third Level or better are lower than in earlier years. The difference is greater amongst pupils from the most deprived areas and, as a result, the S3 pupils attainment gap in literacy has increased to 16.3 percentage points – the largest gap observed since 2016/17.
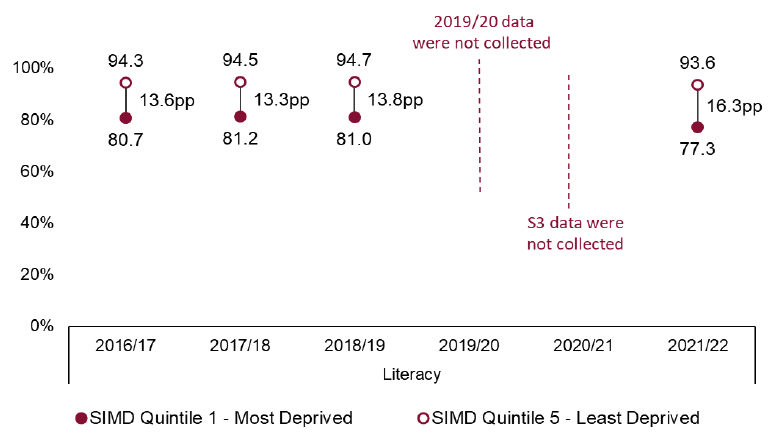
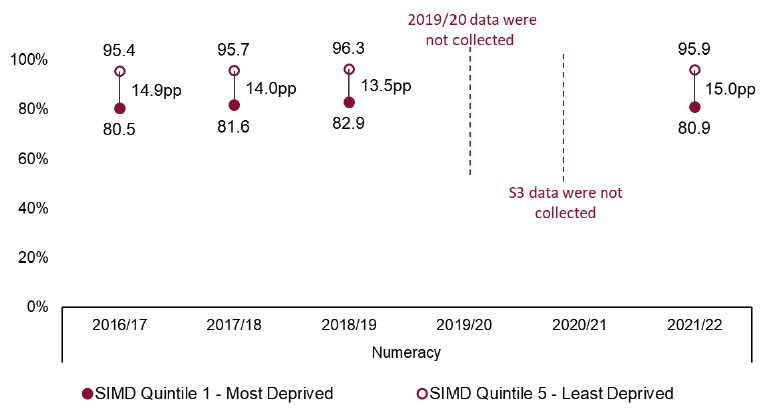
Chart 4 shows the proportion of S3 pupils who achieved Third Level or better in numeracy, for pupils in the most and least deprived areas.
The S3 pupils attainment gap for Third Level or better in numeracy reduced from 14.9 percentage points in 2016/17 to 14.0 percentage points in 2017/18 and to 13.5 percentage points in 2018/19 (see Chart 4 below). In 2021/22, the gap stands at 15.0 percentage points and was the widest since 2016/17 (the first year for which comparable data is available).
The proportion of S3 pupils who achieved Third Level or better in numeracy in 2021/22 is lower than in 2018/19 for pupils from both the most and the least deprived areas. The difference is greater amongst those from the most deprived areas.
Contact
Email: school.stats@gov.scot