Achievement of Curriculum for Excellence (CfE) Levels 2020-21
Results of the achievement of curriculum for excellence (CFE) levels 2020 to 2021.
Part of
Chapter 6: Achievement of CfE Levels by local authority
If making comparisons between local authorities we recommend keeping in mind the context of the authorities and their approach to assessment. See Chapter 8.1.4.4 for more information.
This chapter describes the range of data reported by local authorities, and comparisons to the national level results. Full achievement of CfE levels by local authority (2016/17 to 2020/21) can be found in the supplementary tables.
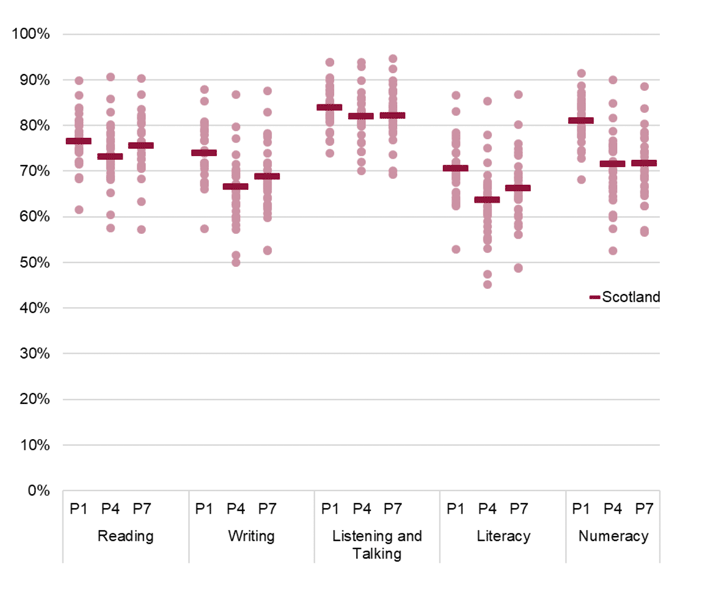
Chart 15, illustrates the range in results between local authorities and organisers for P1, P4 and P7. The largest range in results across the four separate organisers (i.e. excluding literacy) can be seen in numeracy at P4 (ranging from 53 per cent to 90 per cent) and in writing at P4 (ranging from 50 per cent to 87 per cent) – both differences of 37 percentage points.
The smallest range in results by local authority across the four separate organisers (i.e. excluding literacy) is for listening and talking. The range in performance (between highest and lowest) in listening and talking is 20 percentage points at P1, 24 percentage points at P4 and 25 percentage points at P7.
In both literacy, and in numeracy, the range of results between local authorities has increased, at all three stages, between 2018/19 and 2020/21. In literacy, the range for P1 increased from 24 percentage points in 2018/19 to 34 percentage points in 2020/21, for P4 from 30 percentage points in 2018/19 to 40 percentage points in 2020/21 and for P7 from 32 percentage points in 2018/19 to 38 percentage points in 2020/21.
A similar pattern can be observed for numeracy, with the range increasing for all three stages (P1, P4 and P7) from 2018/19 to 2020/21.
There could be a number of reasons for these increases in the ranges across local authorities. They may partly reflect a variation of the impact of the COVID-19 pandemic on children across the country. They may also partly reflect some of the data quality concerns that some local authorities reported (see Chapter 1.3).
Results for local authorities by SIMD quintiles are available in the supplementary tables.
Contact
Email: Andrew.White@gov.scot