Achievement of Curriculum for Excellence (CfE) Levels 2020-21
Results of the achievement of curriculum for excellence (CFE) levels 2020 to 2021.
Part of
Chapter 3: Achievement of CfE Levels by Deprivation
- The gap between the proportion of primary pupils (P1, P4 and P7 combined) from the most and least deprived areas who achieved their expected level in literacy has increased from 20.7 percentage points in 2018/19 to 24.7 percentage points in 2020/21.
- The gap between the proportion of primary pupils (P1, P4 and P7 combined) from the most and least deprived areas who achieved their expected level in numeracy increased from 16.8 percentage points in 2018/19 to 21.4 percentage points in 2020/21.
- For both primary literacy and primary numeracy the sizes of the gaps in 2020/21 were larger than at any previous point since 2016/17 (the first year for which comparable data is available).
This chapter provides an overview of achievement of CfE Levels by pupils based on the deprivation level of the area they live in, as measured by the Scottish Index of Multiple Deprivation (SIMD). It provides information on literacy and numeracy for P1, P4 and P7 as well as for P1, P4 and P7 combined. Full details (including all organisers and all SIMD quintile categories) are available in the supplementary tables.
When considering data by SIMD as a measure of multiple deprivation, it is important to note that the data shows the difference between young people living in the most and least deprived areas. What SIMD data does not show is the difference between young people from poor or rich backgrounds.
The figures shown in Chart 7 and Chart 8 (see pages 19 and 20) provide two of the 11 key National Improvement Framework measures used to measure the poverty related attainment gap. The key measures chosen include:
- Percentage of P1, P4 and P7 pupils combined achieving expected Level in Literacy;
- Percentage of P1, P4 and P7 pupils combined achieving expected Level in Numeracy;
- Percentage of S3 pupils achieving Third Level or better in Literacy and;
- Percentage of S3 pupils achieving Third Level or better in Numeracy.
The last two measures are not available in this report as data for S3 pupils were not collected in 2020/21; for more information see Chapter 1.3.
The charts below show Achievement of CfE Levels by SIMD since 2016/17.
3.1 Achievement of CfE Levels by Deprivation – P1 pupils
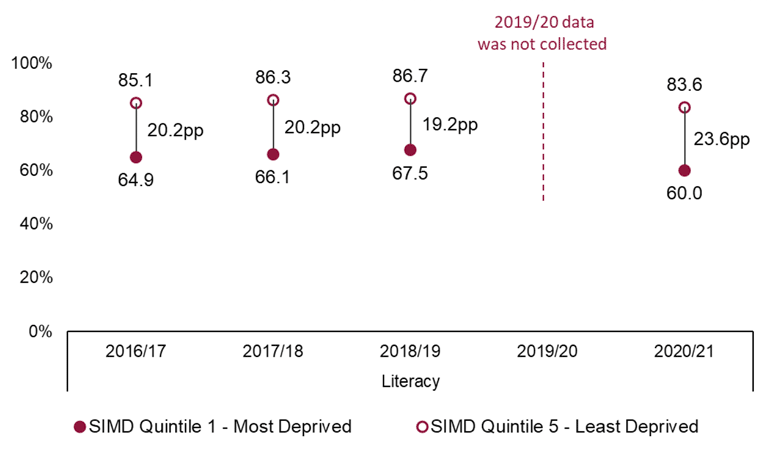
Chart 1 shows the proportion of P1 pupils who achieved the expected levels in literacy, for pupils in the most and least deprived areas.
After decreasing from 20.2 percentage points in 2016/17 and 2017/18 to 19.2 percentage points in 2018/19 the P1 attainment gap in literacy increased to 23.6 percentage points in 2020/21. The proportion of P1 pupils achieving the expected literacy level has decreased in 2020/21 for pupils in both the most and least deprived areas. The gap has widened because the decrease was greater for pupils from the most deprived areas.
Notes:
a. pp = percentage point difference between most and least deprived
b. Based on SIMD 2016 for 2016/17 to 2018/19 and on SIMD 2020 for 2020/21. More information can be found on Scottish Index of Multiple Deprivation.
c. Caution should be exercised if making comparisons over time; for more information see Chapter 8.1.4.3
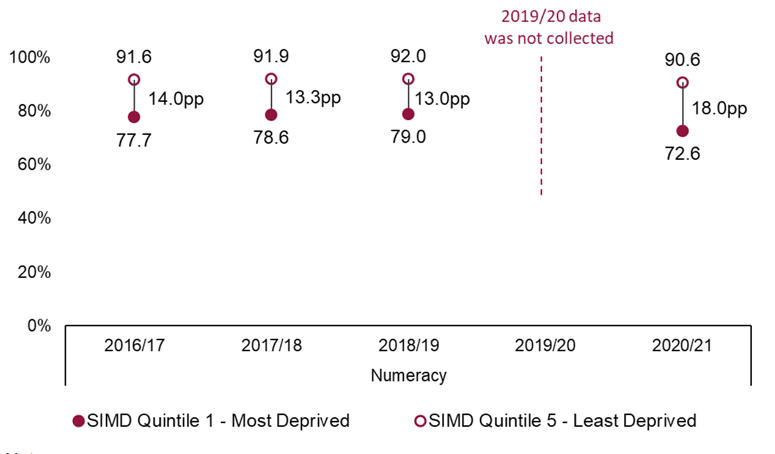
Chart 2 shows the proportion of P1 pupils who achieved the expected level in numeracy for pupils in the most and least deprived areas.
The P1 attainment gap in numeracy reduced slightly each year between 2016/17 and 2018/19 (from 14.0 percentage points in 2016/17 to 13.3 percentage points in 2017/18 and to 13.0 percentage points in 2018/19) and increased to 18.0 percentage points in 2020/21. The proportion of pupils achieving the expected numeracy levels has decreased for pupils in both the most and least deprived areas in 2020/21 compared to previous years.
Notes:
a. pp = percentage point difference between most and least deprived
b. Based on SIMD 2016 for 2016/17 to 2018/19 and on SIMD 2020 for 2020/21. More information can be found on Scottish Index of Multiple Deprivation.
c. Caution should be exercised if making comparisons over time; for more information see Chapter 8.1.4.3
3.2 Achievement of CfE Levels by Deprivation – P4 pupils
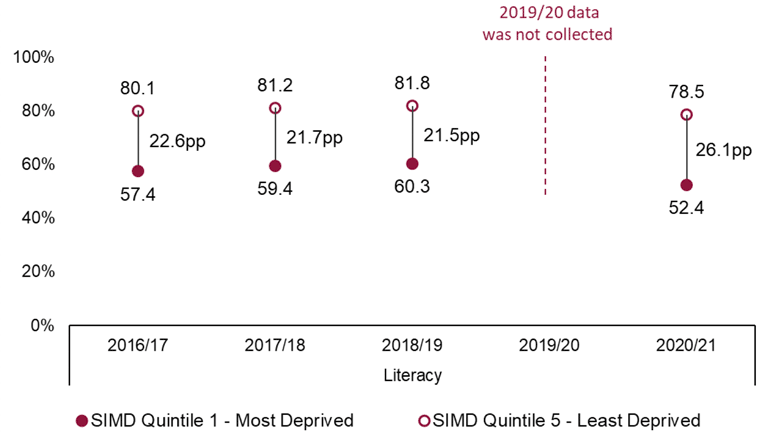
Chart 3 shows the proportion of P4 pupils who achieved the expected levels in literacy for pupils in the most and least deprived areas.
The P4 attainment gap in literacy reduced from 22.6 percentage points in 2016/17 to 21.7 percentage points in 2017/18 and to 21.5 percentage points in 2018/19. In 2020/21 the attainment gap increased to 26.1 percentage points. The proportion of P4 pupils achieving the expected literacy level has decreased for pupils in both the most and least deprived areas compared to previous years. The gap has widened because the proportion decreased by more for pupils from the most deprived areas than for those from the least deprived areas.
Notes:
a. pp = percentage point difference between most and least deprived
b. Based on SIMD 2016 for 2016/17 to 2018/19 and on SIMD 2020 for 2020/21. More information can be found on Scottish Index of Multiple Deprivation.
c. Caution should be exercised if making comparisons over time; for more information see Chapter 8.1.4.3
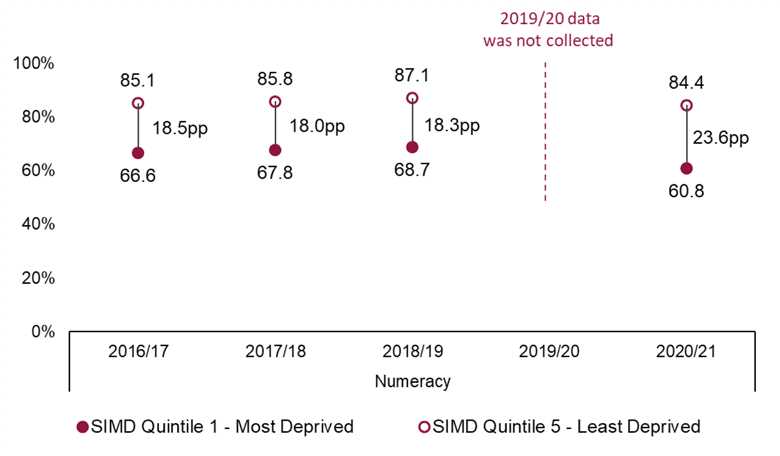
Chart 4 shows the proportion of P4 pupils who achieved the expected levels in numeracy for pupils in the most and least deprived areas.
The attainment gap in P4 numeracy remained broadly stable between 2016/17 and 2018/19 at around or just over 18 percentage points but increased to 23.6 percentage points in 2020/21. The proportion of pupils achieving the expected numeracy levels has decreased for both pupils in the most and least deprived areas in 2020/21 compared to previous years.
Notes:
a. pp = percentage point difference between most and least deprived
b. Based on SIMD 2016 for 2016/17 to 2018/19 and on SIMD 2020 for 2020/21. More information can be found on Scottish Index of Multiple Deprivation.
c. Caution should be exercised if making comparisons over time; for more information see Chapter 8.1.4.3
3.3 Achievement of CfE Levels by Deprivation – P7 pupils
Chart 5 shows the proportion of P7 pupils who achieved the expected levels in literacy for pupils in the most and least deprived areas.
The P7 attainment gap in literacy remained broadly stable between 2016/17 and 2017/18 before falling to 21.5 percentage points in 2018/19. In 2020/21 the gap has widened to 24.4 percentage points. The proportion of P7 pupils achieving the expected literacy levels in 2020/21 decreased from 2018/19 for pupils in both the most and least deprived areas. The gap has widened because the proportion decreased more for pupils from the most deprived areas.
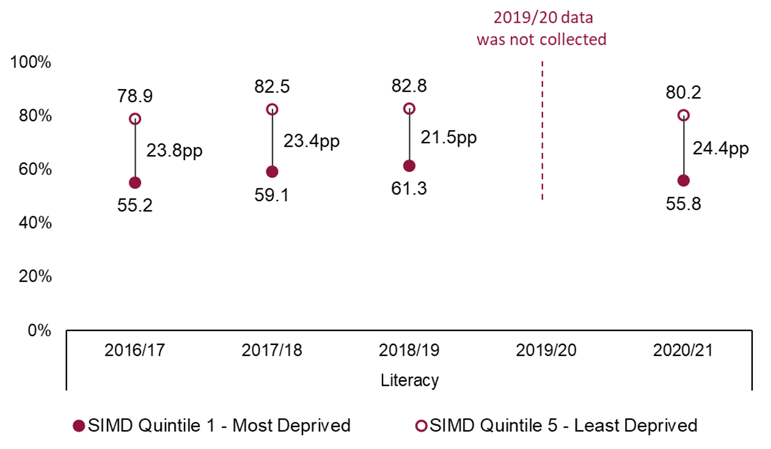
Notes:
a. pp = percentage point difference between most and least deprived
b. Based on SIMD 2016 for 2016/17 to 2018/19 and on SIMD 2020 for 2020/21. More information can be found on Scottish Index of Multiple Deprivation.
c. Caution should be exercised if making comparisons over time; for more information see Chapter 8.1.4.3
Chart 6 shows the proportion of P7 pupils who achieved the expected levels in numeracy for pupils in the most and least deprived areas.
The attainment gap in P7 numeracy reduced from 20.9 percentage points in 2016/17 to 19.7 percentage in 2017/18 and reduced slightly further in 2018/19 to 19.3 percentage points. In 2020/21 the attainment gap increased to 22.7 percentage points. The proportions achieving the expected numeracy levels in 2020/21 have decreased from 2018/19 for pupils from both the most and least deprived areas but the decrease has been greater for pupils from the most deprived areas.
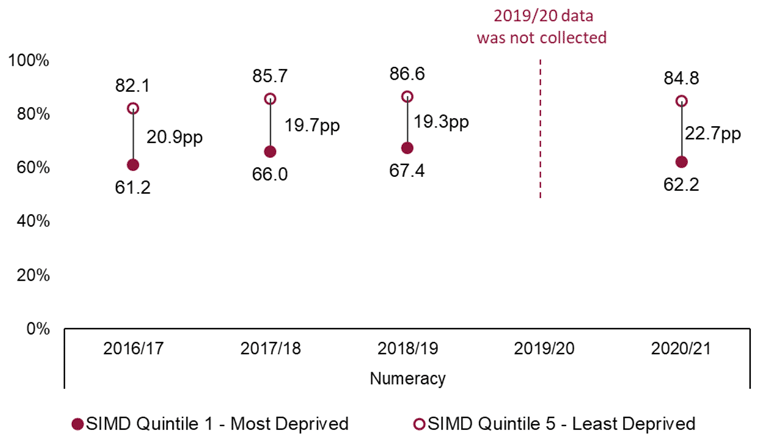
Notes:
a. pp = percentage point difference between most and least deprived
b. Based on SIMD 2016 for 2016/17 to 2018/19 and on SIMD 2020 for 2020/21. More information can be found on Scottish Index of Multiple Deprivation.
c. Caution should be exercised if making comparisons over time; for more information see Chapter 8.1.4.3
3.4 Achievement of CfE Levels by Deprivation – P1, P4 and P7 pupils
Chart 7 provides information for P1, P4 and P7 pupils combined who achieved the expected levels in literacy for pupils in the most and least deprived areas.
The attainment gap in literacy reduced from 22.1 percentage points in 2016/17 to 21.6 percentage points in 2017/18 and reduced further in 2018/19 to 20.7 percentage points. In 2020/21 the attainment gap increased to 24.7 percentage points - the largest the gap has been since 2016/17 (the first year for which comparable data is available).
The proportions of P1, P4 and P7 pupils combined achieving the expected level in literacy in 2020/21 have decreased for pupils in both the most and least deprived areas. The proportion decreased more for pupils from the most deprived areas which has led to a widening of the gap.
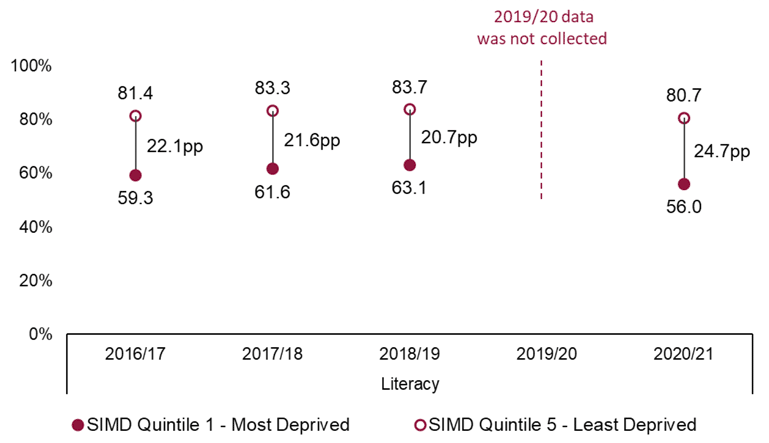
Notes:
a. pp = percentage point difference between most and least deprived
b. Based on SIMD 2016 for 2016/17 to 2018/19 and on SIMD 2020 for 2020/21. More information can be found on Scottish Index of Multiple Deprivation.
c. Caution should be exercised if making comparisons over time; for more information see Chapter 8.1.4.3
Chart 8 provides information for P1, P4 and P7 pupils combined who achieved the expected levels in numeracy.
The numeracy attainment gap for P1, P4 and P7 pupils combined reduced from 17.6 percentage points in 2016/17 to 16.8 percentage points in 2017/18 and remained at this level in 2018/19. In 2020/21 the numeracy attainment gap increased to 21.4 percentage points - the largest the gap has been since 2016/17 (the first year for which comparable data is available).
The proportions of P1, P4 and P7 pupils combined achieving the expected numeracy levels have decreased for both pupils in the most and least deprived areas in 2020/21. The gap has widened as the proportion decreased more for pupils from the most deprived areas.
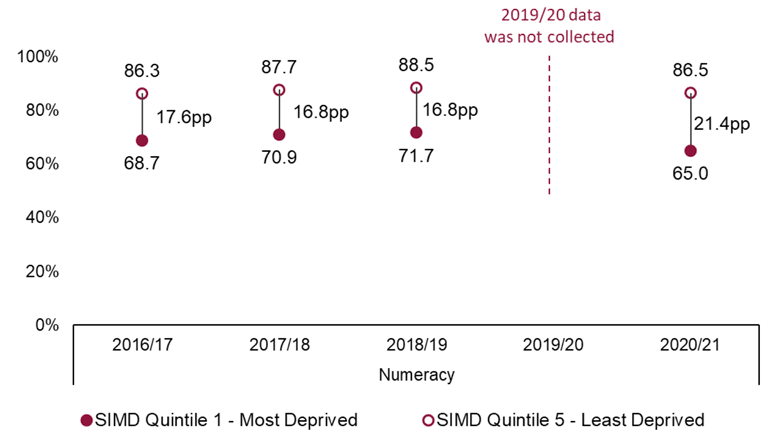
Notes:
a. pp = percentage point difference between most and least deprived
b. Based on SIMD 2016 for 2016/17 to 2018/19 and on SIMD 2020 for 2020/21. More information can be found on Scottish Index of Multiple Deprivation.
c. Caution should be exercised if making comparisons over time; for more information see Chapter 8.1.4.3
Contact
Email: Andrew.White@gov.scot