Private Sector Rent Statistics, Scotland, 2010 to 2022
This publication presents statistics on average private sector rent levels in Scotland by Broad Rental Market Area and size of property, for the years 2010 to 2022.
Part of
Private Sector Rent Statistics, Scotland, 2010 to 2022
Note that figures are based predominantly on advertised rents.
Main findings for average rent changes in the latest year (2021 to 2022):
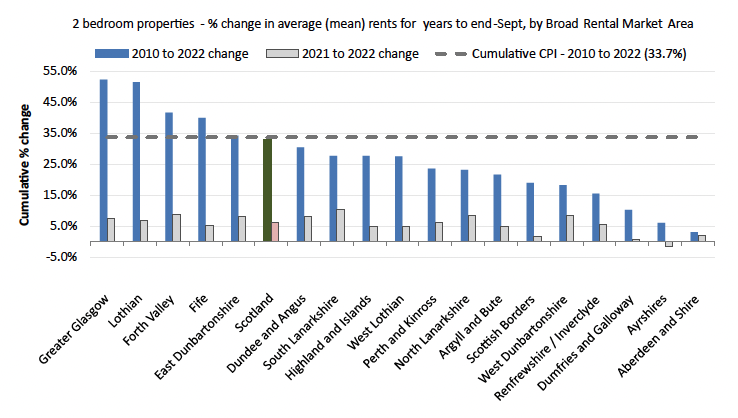
- In the year to end September 2022, average 2 bedroom rents increased in 17 out of 18 areas of Scotland compared with the previous year. Increases in 7 of these areas were above the average 12 month UK CPI inflation[1] rate of 7.6%, ranging from 7.7% in Greater Glasgow to 10.3% in South Lanarkshire. Meanwhile the average 2 bedroom rent in the Ayrshires decreased by 1.5%.
- These regional trends combine to show an estimated 6.2% annual increase in average 2 bedroom monthly rents at a Scotland level.
- Average rents increased at a Scotland level across all property size categories, with increases of 6.3%, 6.2%, 7.4%, 7.5% and 6.9% for 1 to 4 bedroom and 1 bedroom shared properties respectively.
Main findings for cumulative average rent changes between 2010 and 2022:
- Lothian and Greater Glasgow have seen increases in average rents above the rate of inflation between 2010 and 2022[2] across all property sizes.
- East Dunbartonshire, Forth Valley and Fife have seen increases in average rents above the rate of inflation for all property sizes except 1 bedroom shared properties.
- The Ayrshires, Dumfries and Galloway, North Lanarkshire and West Dunbartonshire have seen increases in average rents of less than the rate of inflation across all property sizes between 2010 and 2022.
Note that these statistics cover the 12 month period to end September 2022, and so largely pre-date the Programme for Government proposals for emergency cost of living rent freeze legislation announced on 6 September 2022.
In addition, the figures presented are based predominantly on advertised rents, and so do not represent rent changes for existing tenants to whom the rent freeze applies.
This publication presents statistics on private sector rent levels in Scotland over the years 2010 to 2022 (years to end September) for different property sizes across each of the 18 Broad Rental Market Areas in Scotland[3]. It contains information on average rents as well as rents at the higher and lower end of the market[4].
The publication uses data from the Rent Service Scotland market evidence database, which is collected for the purposes of determining annual Local Housing Allowance levels and Local Reference Rent.
The main users of this publication are likely to include those involved in housing policy and practice, researchers, tenants, landlords, letting agents, and other individuals with an interest in the private rented sector.
Note that the rental information contained in the market evidence database is largely based on advertised rents, therefore it is important to note that the statistics presented in this publication do not represent rent changes for existing tenants.
As with the previous publication, Scotland figures have been calculated using a weighted stock approach based on separate Scottish Household Survey estimates on the profile of rental stock by area and property size over time. Further information on this is available in Section 8 and Annex C.
Contact
Email: housingstatistics@gov.scot