Scottish Social Attitudes 2015: Attitudes to Government, the National Health Service, the Economy and Standard of Living
This report provides the findings of the core module of the Scottish Social Attitudes Survey 2015 on attitudes to government, the National Health Service, the economy and standard of living.
3. Views of government priorities, the National Health Service, the economy and the standard of living
3.1 This chapter describes the priorities of people for Scottish Government action and their views of the National Health Service, the economy and the standard of living in 2015[21]. It also explores trends over time. In particular the chapter examines:
- Views on the Scottish Government priorities for action
- Satisfaction with the National Health Service (NHS)
- Perceptions of whether the standard of the health service in Scotland has increased or fallen in the past 12 months
- Perceptions of whether the economy has weakened or strengthened and whether the standard of living in Scotland has increased or fallen in the past 12 months
- Who is viewed as responsible for changes in the health service, the economy, and the standard of living in Scotland
Priorities for government action
3.2 Since 2004, SSA has asked people to choose one policy area (from a list)[22] which they consider should be the highest priority for Scottish Government action. In 2015, 'help the economy to grow faster' topped the list, with 1 in 3 people (32%) choosing it as the highest priority.
3.3 It should be noted that the findings from 2015 are not directly comparable with those from previous years because of the addition of the response option 'reduce inequality' in 2015 (which was chosen by 4% of people).
3.4 Notwithstanding this, helping the economy to grow faster has been the most commonly chosen priority for Scottish Government action since the economic downturn of 2008 (see Table 3.1 below).
3.5 While some of the priority rankings have remained fairly constant over the time series, others have changed. Between 2007 and 2015, there was a significant increase in the proportion choosing 'improving standards of education', an increase from 12% to 22%. Improving people's health was selected most often as a priority between 2004-2006 when around 1 in 4 people chose it; in subsequent years it has been selected by around 1 in 6 people.
3.6 Prior to the economic downturn in 2008, 'cutting crime' was the option selected most often as the top priority for government (27% selected this option in 2007). However, since then, there has been a steady decrease in the proportion of people who have chosen cutting crime, and in 2015 just 4% of people selected this option.
Table 3.1: What should be the Scottish Government's* highest priority? (2004-2015, column %)[23]
| 2004 | 2005 | 2006 | 2007 | 2009 | 2010 | 2011 | 2013 | 2015 | |
|---|---|---|---|---|---|---|---|---|---|
| % | % | % | % | % | % | % | % | % | |
| Help the economy to grow faster | 16 | 18 | 14 | 16 | 33 | 37 | 36 | 35 | 32 |
| Cut crime | 22 | 23 | 24 | 27 | 17 | 18 | 17 | 10 | 4 |
| Improve people's health | 27 | 26 | 24 | 17 | 13 | 15 | 16 | 18 | 17 |
| Improve standards of education | 17 | 15 | 16 | 12 | 15 | 12 | 15 | 18 | 22 |
| Improve housing | 12 | 10 | 12 | 16 | 13 | 9 | 11 | 13 | 15 |
| Improve the environment | 4 | 4 | 6 | 5 | 3 | 3 | 2 | 1 | 1 |
| Improve public transport | 1 | 1 | 2 | 1 | 1 | 1 | * | 1 | 2 |
| Reduce inequality | n/a | n/a | n/a | n/a | n/a | n/a | n/a | n/a | 4 |
| Bases | 1637 | 1549 | 1594 | 1508 | 1482 | 1495 | 1197 | 1497 | 1288 |
Base: All respondents
* Prior to 2009, this question asked about the 'Scottish Executive'
3.7 Not all groups were equally likely to identify improving the economy as the highest priority for Scottish Government action. Those who were more likely to choose the economy in 2015 were:
- older people (38% of those aged 65 or over compared with 22% of those aged 18-29)
- those on the right of the political scale (40%) compared with those on the left (25%)
3.8 People living in the most deprived areas of Scotland[24] were less likely to select helping the economy to grow faster (22%) than those in all other areas (for example, 37% in the least deprived areas). Equal proportions of those who said they are living comfortably on their present income and those struggling on their present income chose helping the economy to grow faster as their highest priority for government action (30%). See Table A3.1 in Annex A for full details.[25]
Views on the NHS
3.9 Since 2005[26], SSA has asked a question about satisfaction with 'the way in which the National Health Service runs nowadays'. The level of satisfaction has steadily increased since then, when 40% of people were 'very' or 'quite' satisfied with 'the way the NHS runs nowadays in Scotland'. By 2013, the proportion who were satisfied had risen to 61% and has remained at a similarly high level in 2015 (62%). Conversely, the proportion of people who were dissatisfied with the NHS was at the highest level in 2005 (44%) and had halved by 2011, when 23% were dissatisfied. A similar proportion (24%) was dissatisfied in 2015 (see Figure 3.1 below).
Figure 3.1: Satisfaction with the way the health service runs nowadays in Scotland (1999 - 2015, %)

Base: All respondents
For details see Table A3.2 in Annex A
24 Measured by the Scottish Index of Multiple Deprivation (SIMD). SIMD 2012 measures the level of deprivation across Scotland - from the least deprived to the most deprived areas. It is based on 38 indicators in seven domains of: income, employment, health, education skills and training, housing, geographic access and crime.
25 There were no significant differences between subgroups for those who chose education and health as the highest priority.
26 The question was also asked in 1999 but then not again until 2005.
3.10 SSA also asks people whether they think that standards in the health service have increased or fallen in the last twelve months. In 2015, 39% said they thought that the standard of the health service had fallen 'a little' or 'a lot' over the last year.[27] This compared with 31% in 2011, the last year the question had been asked. In addition, fewer people in 2015 (12%) said that the standard of the health service had increased over the last year than did so in 2011 (22%). Between 1999 and 2011, the proportion of people in Scotland who thought that standards in the health service had increased 'a little' or 'a lot' ranged between 17%-26%. The 2015 figure is, therefore, the lowest since the time series began in 1999.
Figure 3.2: Whether the standards in the health service have increased or fallen (1999-2015, %)
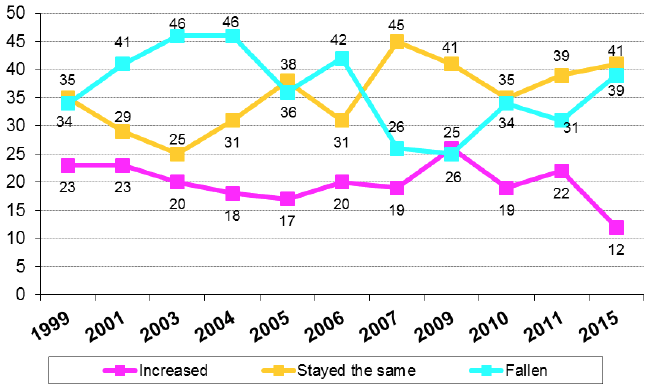
Base: All respondents
For details see Table A3.3 in Annex A
3.11 84% of those who thought that the standard of the health service in Scotland had increased were satisfied with the way the NHS runs nowadays and 77% of those who felt that the standard of the health service had stayed the same were satisfied with the NHS (see Table 3.2 below). Amongst those who said that the standard of the health service had fallen, nearly 2 in 5 were still satisfied with the NHS (39%).
3.12 Levels of satisfaction with the NHS are not always directly related to views that the standard of the health service has increased or fallen. For example, those aged 65 and over were the most likely to say that standards of the health service have fallen, but were also the most satisfied with the way the NHS is run.
Table 3.2: Satisfaction with health service by changes in NHS standards (2015, column %) [23]
| Increased | Stayed the same | Fallen | All | |
|---|---|---|---|---|
| % | % | % | % | |
| Very/quite satisfied | 84 | 77 | 39 | 62 |
| Neither satisfied nor dissatisfied | 5 | 12 | 17 | 14 |
| Very/quite dissatisfied | 11 | 10 | 44 | 24 |
| Bases (weighted) | 150 | 532 | 504 | 1288 |
| Bases (unweighted) | 148 | 537 | 510 | 1288 |
Variations in attitudes to the NHS
3.13 Attitudes towards the health service in Scotland in 2015 varied by both demographic factors and political attitudes (see Tables A3.4 and A3.5 in Annex A for full details). The groups who were more likely to be satisfied with the way the NHS runs nowadays were:
- Those aged 65 and over (70% compared with 59% of those aged 18 to 64).
- Men (67% compared with 58% of women)
- Those living in the least deprived areas (67% compared with 60% of those living in the most deprived areas)
- Labour and Conservative supporters (69% and 70% respectively) compared with SNP supporters (58%)
- 67% of those living comfortably on present income compared with 45% of those struggling on present income
The groups that were more likely to be dissatisfied with the standard of the NHS were:
- Those on the left of the political spectrum (30% compared with 21% of those in the centre and 21% on the right)
- Those struggling on their present income (37% compared with 21% of those living comfortably on present income)
3.14 There were no significant differences between subgroups among those who thought that the standard of the health service had increased in the last twelve months. Those who were more likely to say that the standard of the health service in Scotland had fallen were:
- Older people - 49% of those aged 65 and over compared with 32% of those aged 18-29
- Women (42%) compared with men (36%)
- Those with lower levels of education - 48% of those with no formal qualifications compared with 35% of those educated to degree level
- Those households earning below £26,000 p.a. (47%) compared with those earning £26,000 or above p.a. (34%)
- Those on the left of the political spectrum (47%) compared with those on the right (33%)
Who do people think is responsible for the changes to the health service?
3.15 In addition to asking whether people felt standards in the NHS in Scotland had increased or fallen, SSA has also tracked people's attitudes on whether the Scottish Government or the UK Government's policies are viewed as responsible for these changes or whether there was 'some other reason'. SSA can therefore provide data on who is getting 'the credit'[28] when things are seen to be going well and who is getting 'the blame' from those who think standards have fallen. (For full details, see Tables A3.6 and A3.7 in Annex A).
3.16 Figure 3.3 below shows which government people 'blamed' for falling standards in the health service. Nearly half (48%) of those in 2015 who said there had been a fall in the standard of the health service 'blamed' it on UK Government policies, compared with 19% who 'blamed' the Scottish Government. One in five (20%) said the fall in standards was due to 'some other reason'.[29] The proportion of people blaming the UK Government for the decline in standards of the health service increased significantly between 2009 and 2011 (from 41% to 54%), but there has been a slight decrease between 2011 and 2015 to 48%.[30]
Figure 3.3: Which government policies are responsible for the fall in the standard of the health service in the past 12 months? (2006-2015,%)

Base: All who said the standard of the health service has fallen
Unweighted - 510, weighted - 504
Views on Scotland's economy and the standard of living
3.17 In 2015, 26% of people thought that Scotland's economy had grown stronger in the last 12 months.[31] In 2007, prior to the economic downturn 31% thought that Scotland's economy had strengthened in the previous 12 months. This figure fell dramatically in 2009 to 8% but has been increasing gradually ever since (see Figure 3.4 below). However, in 2015 a higher proportion thought that Scotland's economy had weakened than thought it had strengthened (35%[32] compared with 26%). This figure is substantially higher than proportions recorded in the years preceding the economic downturn when it ranged from 11%-27% (2004-2007) and significantly lower than in 2009 (when it was 72%).
3.18 Views on the general standard of living in Scotland in 2015 were less positive than those of the economy. 19% felt that the standard of living had increased in the last twelve months, while 42% felt it had fallen.[34] From 2009, following the economic downturn, views on the economy became more positive (increasing from 8% in 2009 to 18% in 2011) while at the same time views on the standard of living continued to became more negative (declining from 16% in 2009 to 11% in 2011). However, from 2011 onwards the proportion saying that the standard of living has improved has steadily increased, whereas the proportion saying the economy had strengthened declined between 2011 and 2012 before increasing sharply between 2012-2013.
Figure 3.4: Whether the economy has strengthened and whether the standard of living has increased in the past 12 months? (1999-2015, %)

Base: All respondents
For full details see Tables A3.8 and A3.9 in Annex A
Variations in attitudes to the economy and standard of living
3.19 Sub-group analysis revealed some marked differences in views on the economy and standard of living (see Tables A3.10 and A3.11 in Annex A for full details).
3.20 Age, education, income and party identification were all associated with views on whether the economy had strengthened or weakened over the past 12 months[35]. Those who were more likely to think the economy had strengthened were:
- people aged 30-39 (38%) compared with all other age groups (23%-24% for all other age groups)
- those educated to Standard Grade or above (28%) compared with those with no formal qualifications (21%)
- those in the highest household income group (35%) compared with those in the lowest income group (23%)
- SNP supporters (35%) compared with Labour (22%) and Conservative supporters (23%).
3.21 Views about changes in the general standard of living over the past 12 months varied significantly by a range of factors including gender, age, income, area deprivation, whether people lived in urban or rural areas and party identification. Those who were more likely to think that the standard of living had increased were:
- People aged 65 and over (24%) compared with those aged 18-29 (13%)
- Conservative supporters (28%) compared with 21% of SNP supporters and 16% of Labour supporters.
- Those living comfortably on present income (24%) compared with those struggling on present income (13%)
3.22 Those who were significantly more likely to think that the standard of living had fallen were:
- Women (47% compared with 37% of men)
- Those in the lowest household income group (51% compared with 36% in the highest income group)
- Those living in the most deprived areas (50% in the most deprived areas compared with 32% of those in the least deprived areas of Scotland)
- Those living in urban areas (44% in large urban areas compared with 30% in remote and very remote rural areas)
- SNP supporters (47%) and Labour supporters (43%) compared with Conservative supporters (26%)
- Those struggling on their present income (64%) compared with those living comfortably on present income (35%)
Who is seen as responsible for the changes to the economy and living standards?
3.23 In 2015 over half of people (54%) who said the Scottish economy had strengthened over the last 12 months thought that this was the result of Scottish Government policies. This compared with 16% who thought that it was the result of UK Government policies. Thus, many more people gave the 'credit' for a stronger economy in Scotland to the Scottish Government than to the UK Government. 1 in 5 people (21%) thought that the economy got stronger because of 'some other reason'.[36] (For full details see Tables A3.12 and A3.13 in Annex A).
Figure 3.5: Who is credited for perceived strengthening of the economy in the last 12 months? (2006-2015,%)

Base: All those who thought that the economy had strengthened in the past 12 months
Unweighted - 335, weighted - 341
3.24 By contrast, the 'blame' for a weaker economy has been consistently attributed to the UK Government, with the exception of 2009 (when people were most likely to choose 'some other reason' as the explanation for the economy becoming weaker). The 2015 findings confirm this pattern, with 38% of those who believed the Scottish economy had weakened over the last 12 months 'blaming' UK Government policies compared with 14% who thought Scottish Government policies were to blame (see Figure 3.6 below). In 2015, 37% of people who thought Scotland's economy had weakened in the last 12 months said this was due to 'some other reason'.[37]
Figure 3.6: Who is blamed for perceived weakening of the economy in the past 12 months? (2006-2015)

Base: All those who thought that the economy got weaker in the past 12 months
Unweighted - 447, weighted - 449
3.25 In relation to the perceived increase in the general standard of living, 37% 'credited' Scottish Government policies with an increase compared with 28% who gave credit for this to UK Government policies.[38] In contrast, 'blame' is attributed mainly to UK Government policies, among those who thought that the general standard of living had fallen, 62% 'blamed' UK Government policies compared with only 7% who 'blamed' Scottish Government policies.[39] (For full details see Tables A3.14 and A3.15 in Annex A).
Contact
Email: Donna Easterlow