Wellbeing economy toolkit: supporting place based economic strategy and policy development
This practical guide sets out a stage-by-stage diagnostic process designed to aid decision making and prioritisation of economic interventions to facilitate the transition to local and regional wellbeing economies.
Stage 2: Understanding drivers
Wellbeing outcomes can have multiple causes, effects and dependencies. Investigating this complexity enables national, regional and local actors to focus on the main drivers of wellbeing outcomes and develop upstream, preventative interventions to improve outcomes and build long-term resilience into local economies.
Starting with the priority wellbeing outcomes identified during stage one, stage two concentrates on gathering further evidence and data to understand the key drivers of those outcomes.
Where possible gaps in the data are identified, further sources of evidence should be sought to strengthen understanding. Particular attention should be paid to identifying under-represented, disadvantaged and marginalised groups.
Clackmannanshire Stage 2 Case Study
In Clackmannanshire, a systems mapping exercise was carried out in partnership with the academic consortium, SIPHER. The resulting systems maps highlighted the connections, and strength of connections, within the local system, and provided further data for use in the process of identifying priorities and interventions.
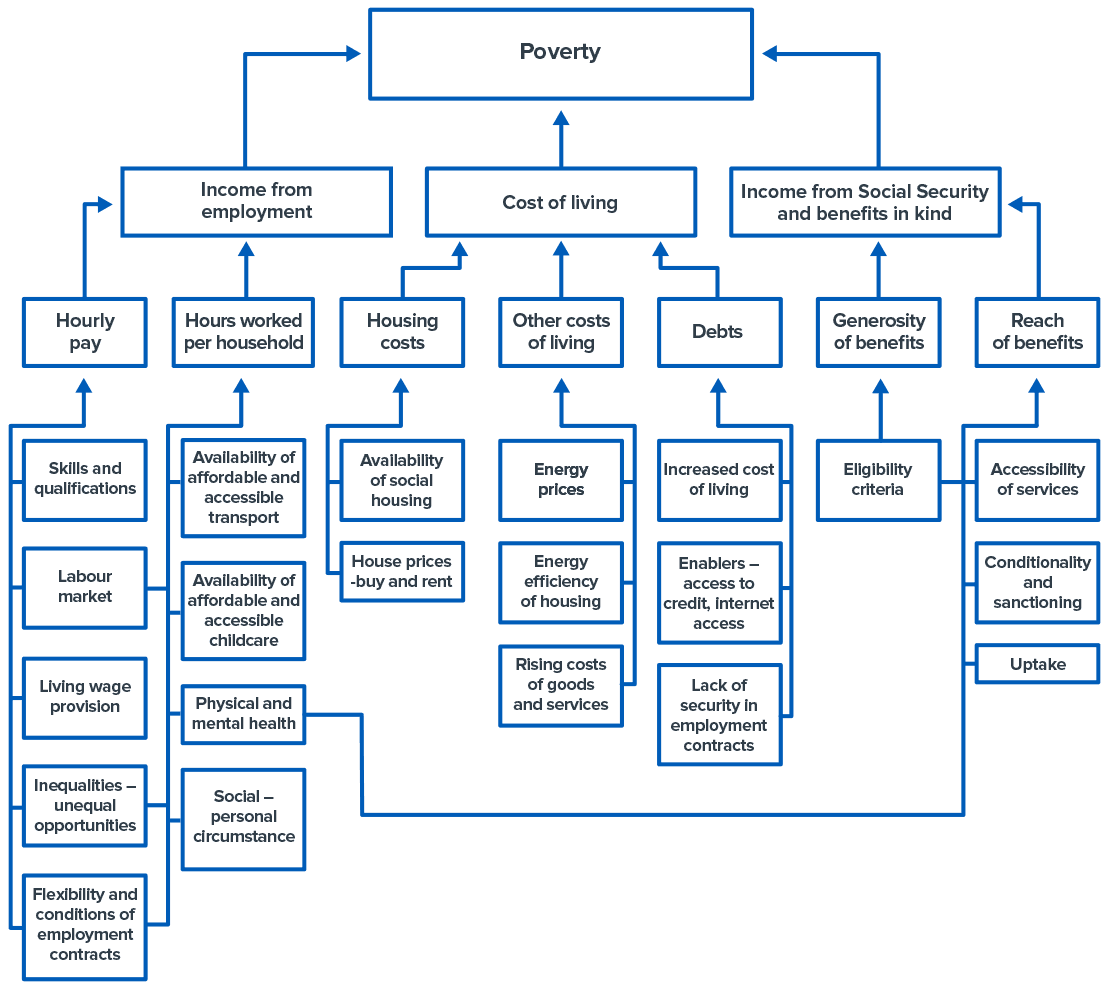
Using a simplified systems-based approach, driver diagrams like the one shown in Figure 3 were developed for each of the seven key wellbeing outcomes to visually represent the systemic factors that were influencing those outcomes. These driver diagrams reflected both the quantitative and qualitative evidence base and connections across the wider system.
Once complete, the driver diagrams for each of the key themes were compared to identify where drivers were impacting on multiple outcomes, and to identify gaps in the evidence base where further research was required to understand the relationships between key drivers across the wider system.
Stage 2 Actions
1. Focusing on the wellbeing outcomes identified as priorities during stage one, look for additional evidence to understand what is driving those outcomes.
- The Data and evidence resources in Annex D signposts to available data and evidence, but locally gathered evidence could also be included.
2. Using this evidence base as a guide, identify the drivers of the wellbeing outcomes selected for further investigation.
- Drivers may be identified at both a local and national level. Driver diagrams can be used to visually represent the links between key drivers and where they are impacting across the wider economic system.
- Systems mapping and logic models may help with this process – see Annex E for resources on methodologies for understanding systems, drivers and interconnections.
3. Compare the driver connections for each of the wellbeing outcomes to identify where drivers are impacting multiple outcomes.
Contact
Email: NSET@gov.scot