Take-up Rates of Scottish Benefits: October 2025
This publication contains our latest estimates of take-up of Scottish benefits delivered by Social Security Scotland. An 'Easy Read' version of this publication is also available.
Local Authority Take-Up Rate Estimates: Scottish Child Payment & Best Start Foods
The following maps and tables show estimated take-up rates for Scottish Child Payment and Best Start Foods across local authorities in Scotland for 2024-25. Maps of take-up for both benefits for Northern, Southern and Central Scotland can be found in annex A.
Scottish Child Payment
For Scottish Child payment, estimated take-up rates (for all children under 16) range from the lowest estimates of 89% for Aberdeenshire and Moray, to the highest estimate of 97% for Falkirk, Glasgow City and North Ayrshire. A breakdown of the take-up rates for Scottish Child Payment across Scotland is given below in map 1 and table 3:
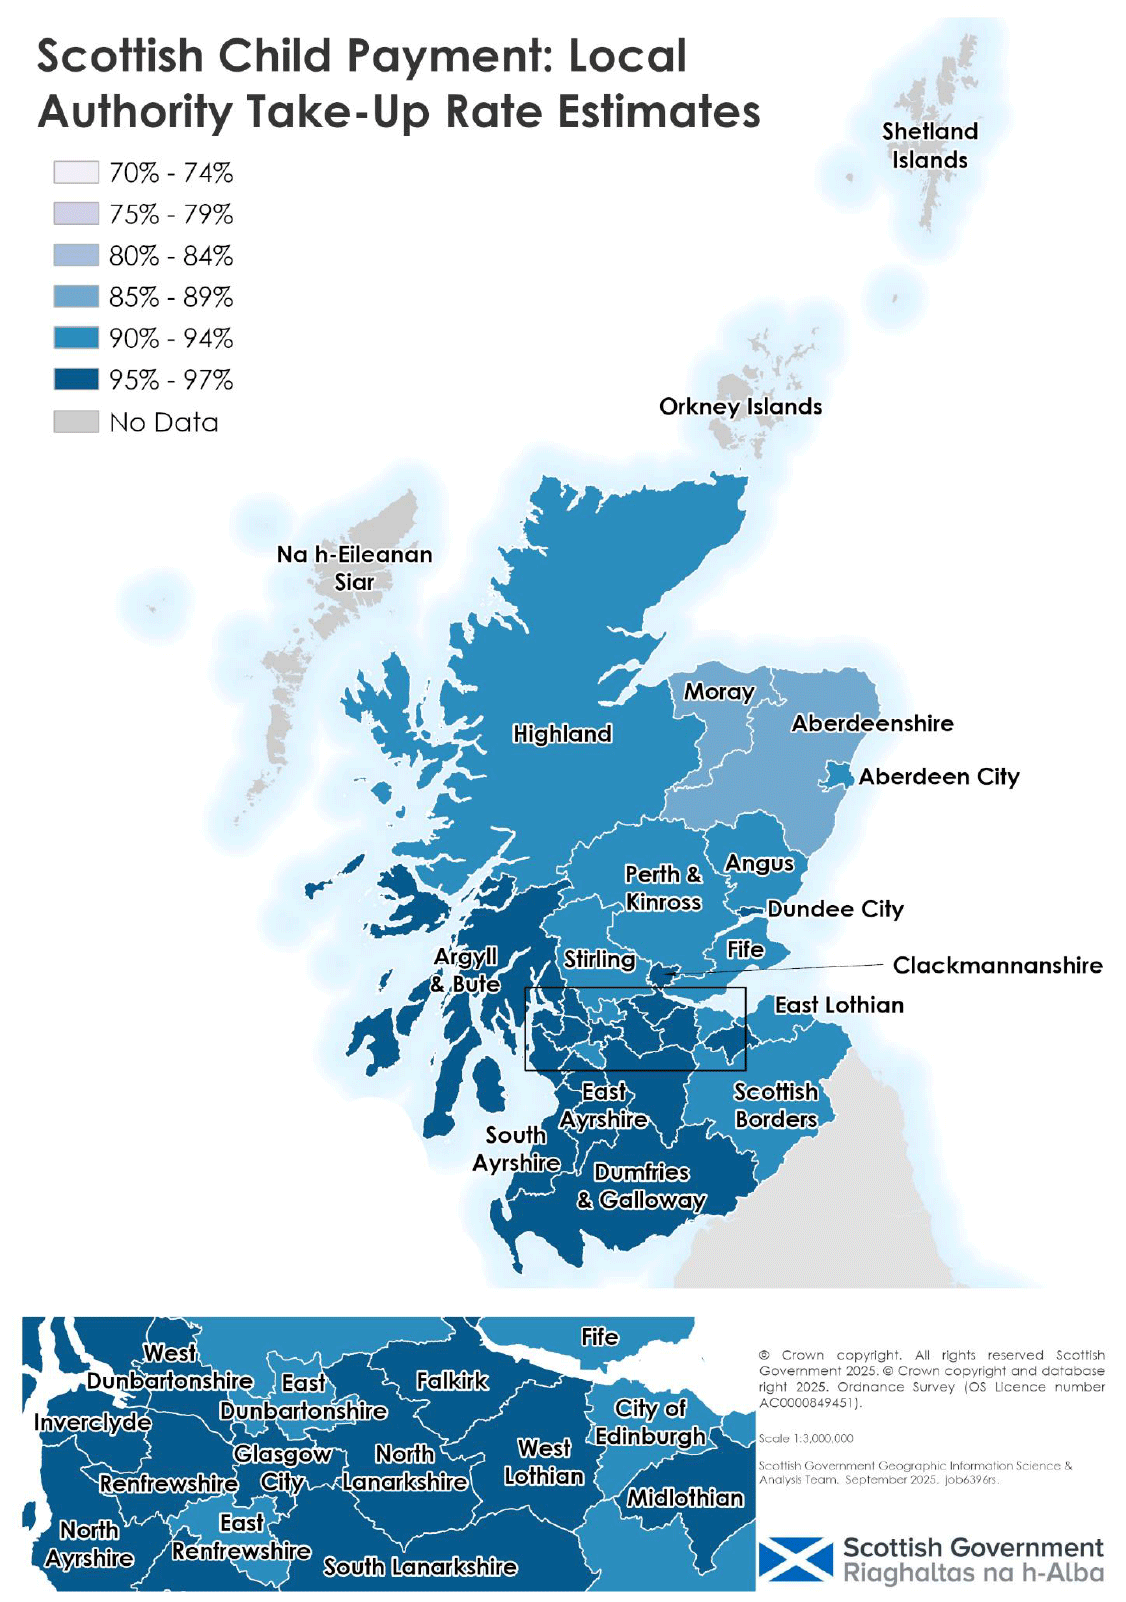
Table 3 : Local Authority Estimates of Take-Up: Scottish Child Payment
| Local Authority | Estimated Take-Up Rate for 2024-25 |
|---|---|
| Aberdeen City | 91% |
| Aberdeenshire | 89% |
| Angus | 90% |
| Argyll and Bute | 95% |
| Edinburgh, City of | 92% |
| Clackmannanshire | 95% |
| Dumfries and Galloway | 96% |
| Dundee City | 95% |
| East Ayrshire | 96% |
| East Dunbartonshire | 90% |
| East Lothian | 92% |
| East Renfrewshire | 92% |
| Falkirk | 97% |
| Fife | 93% |
| Glasgow City | 97% |
| Highland | 90% |
| Inverclyde | 96% |
| Midlothian | 95% |
| Moray | 89% |
| North Ayrshire | 97% |
| North Lanarkshire | 95% |
| Perth and Kinross | 91% |
| Renfrewshire | 95% |
| Scottish Borders | 93% |
| South Ayrshire | 95% |
| South Lanarkshire | 95% |
| Stirling | 94% |
| West Dunbartonshire | 95% |
| West Lothian | 96% |
Estimates for Orkney Islands, Shetland Islands and Na h-Eileanan Siar have not been included because the number of recipients is deemed to be below the minimum threshold required for confidence in estimates.
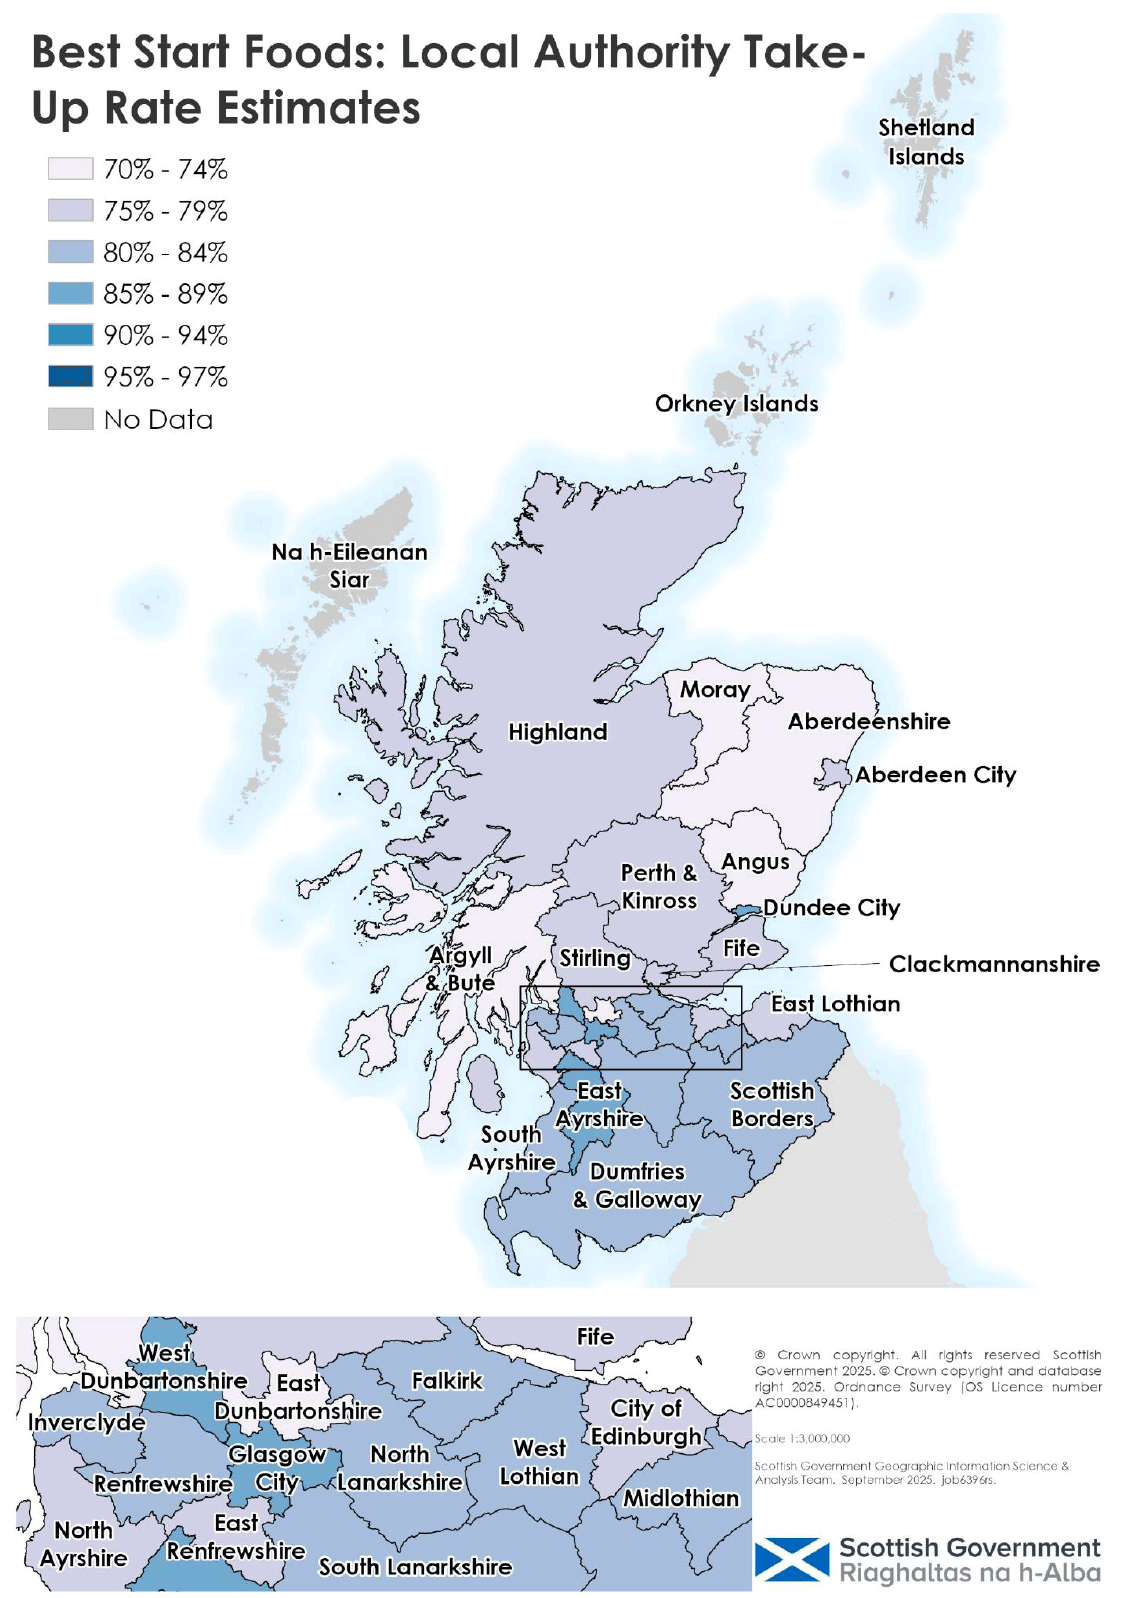
Best Start Foods
For Best Start Foods, estimated take-up rates range from the lowest estimates of 71% for Aberdeenshire, East Dunbartonshire and Moray, to the highest estimate of 88% for West Dunbartonshire. A breakdown of the take-up rates for Best Start Foods across Scotland is given below in map 2 and table 4:
| Local Authority | Estimated Take-Up Rate for 2024-25 |
|---|---|
| Aberdeen City | 76% |
| Aberdeenshire | 71% |
| Angus | 74% |
| Argyll and Bute | 74% |
| Edinburgh, City of | 77% |
| Clackmannanshire | 79% |
| Dumfries and Galloway | 82% |
| Dundee City | 86% |
| East Ayrshire | 87% |
| East Dunbartonshire | 71% |
| East Lothian | 76% |
| East Renfrewshire | 77% |
| Falkirk | 80% |
| Fife | 79% |
| Glasgow City | 87% |
| Highland | 75% |
| Inverclyde | 82% |
| Midlothian | 82% |
| Moray | 71% |
| North Ayrshire | 77% |
| North Lanarkshire | 83% |
| Perth and Kinross | 79% |
| Renfrewshire | 84% |
| Scottish Borders | 82% |
| South Ayrshire | 83% |
| South Lanarkshire | 82% |
| Stirling | 78% |
| West Dunbartonshire | 88% |
| West Lothian | 82% |
Estimates for Orkney Islands, Shetland Islands and Na h-Eileanan Siar have not been included because the number of recipients is deemed to be below the minimum threshold required for confidence in estimates.
Analysis of Local Authority Take-up Rates
The local authority distribution of take-up rate estimates for Scottish Child Payment and Best Start Foods share some similarities. The overall take-up rate of Scottish Child Payment (94%) in 2024-25 was significantly higher than Best Start Foods (81%). So as expected, every local authority in Scotland has a lower take-up rate for Best Start Foods than Scottish Child Payment. The median difference in take-up for Scottish Child Payment and Best Start Foods for local authorities is 14 percentage points, very similar to the difference at the national level (13 percentage points).
Distribution of take-up rates across local authorities is more variable for Best Start Foods than Scottish Child Payment. The gap between the highest (97%) and lowest (89%) take-up rate for Scottish Child Payment is 8 percentage points. For Best Start Foods the gap is 17 percentage points (88% and 71%). It is not clear what drives this difference, however, there is a much smaller eligible population for Best Start Foods and estimates of take-up are not known but are estimated using analytical techniques. This means there is likely to be more uncertainty within the data and methodology used to estimate local authority take-up rates for Best Start Foods and therefore a higher degree of regional variation.
For local authorities, there is a strong positive correlation between their take-up rate of Scottish Child Payment and Best Start Foods (around 0.75). Of the ten local authorities with the highest take-up rates for Scottish Child Payment, half are in the ten highest ranked local authorities for Best Start Foods’ take-up. Similarly, of the ten local authorities with the lowest take-up rates for Scottish Child Payment, eight are also in the ten lowest ranked local authorities for Best Start Foods’ take-up. Therefore, where Scottish Child Payment take-up is higher, take-up also tends to be higher for Best Start Foods, and vice versa.
For both Scottish Child Payment and Best Start Foods, there is a moderate to strong positive correlation (around 0.7) between local authority take-up rate rates and Scottish Index of Multiple Deprivation (SIMD) rank by local share. Higher SIMD rank for a local authority suggests higher levels of deprivation, which means deprivation can be considered a reasonably good predictor of take-up for both Scottish Child Payment and Best Start Foods.
There is also evidence of a weak negative correlation between rurality and take-up rates for both payments, but relatively stronger for Best Start Foods (around 0.35 vs around 0.2 for Scottish Child Payment), using the Scottish Government Urban Rural Classification. This suggests a weak negative association between a local authority’s rurality and take-up rate for both benefits (more rural areas more likely to have lower take-up), but this is relatively more pronounced for Best Start Foods.
Contact
Email: ceu@gov.scot