Tackling child poverty delivery plan - progress report 2022-23: annex a - measurement framework
Child poverty measurement framework with the latest data on the drivers of child poverty. The indicators in the child poverty measurement framework are intended to monitor these drivers of poverty.
Driver: Cost of Living
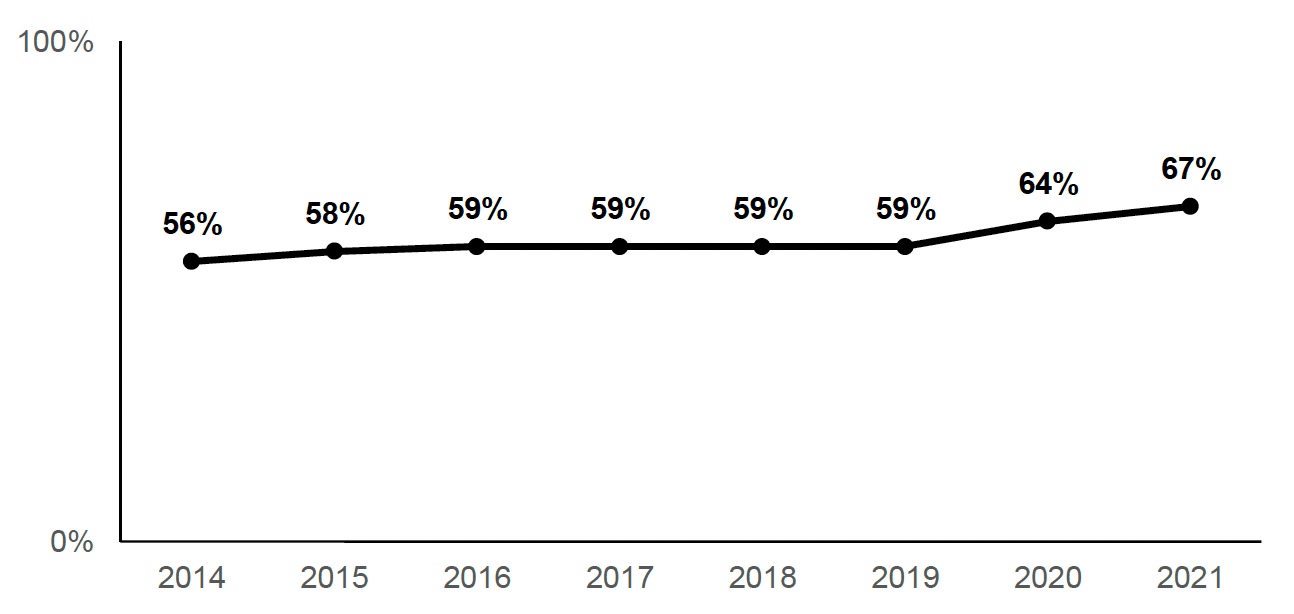
Indicator 8: Childcare availability - Holidays
Percentage of children's day care places that are in settings that operate during the school holidays. Day care is care provided for infants and toddlers, pre-schoolers and school-aged children in a centre-based facility, such as a nursery, playgroup or afterschool club.
Source: Care Inspectorate Data
How this indicator relates to the child poverty targets:
Relative poverty √
Absolute poverty √
Low income + material deprivation √
Persistent poverty √
A lack of childcare availability during the school holidays can limit opportunities for paid employment.
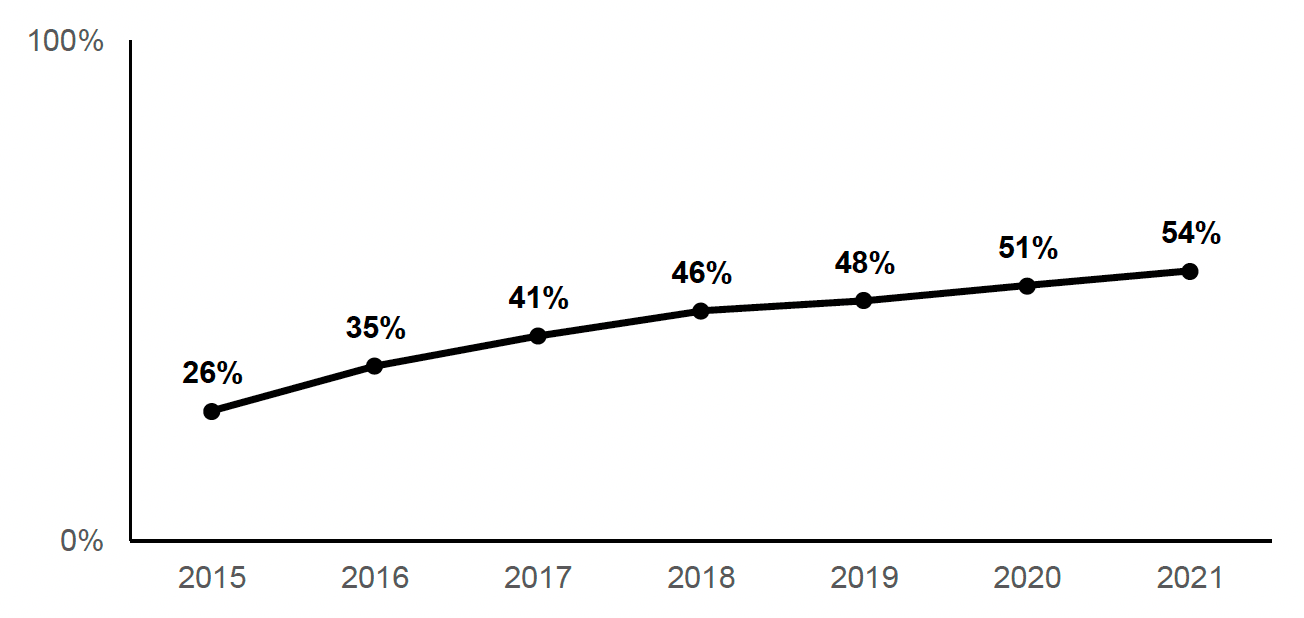
Indicator 9: Childcare availability – Outside school hours
Percentage of children's day care places that are in settings that are open before, during and after school hours.
Source: Care Inspectorate Data
How this indicator relates to the child poverty targets:
Relative poverty √
Absolute poverty √
Low income + material deprivation √
Persistent poverty √
A lack of childcare availability outside of school hours can limit opportunities for paid employment.
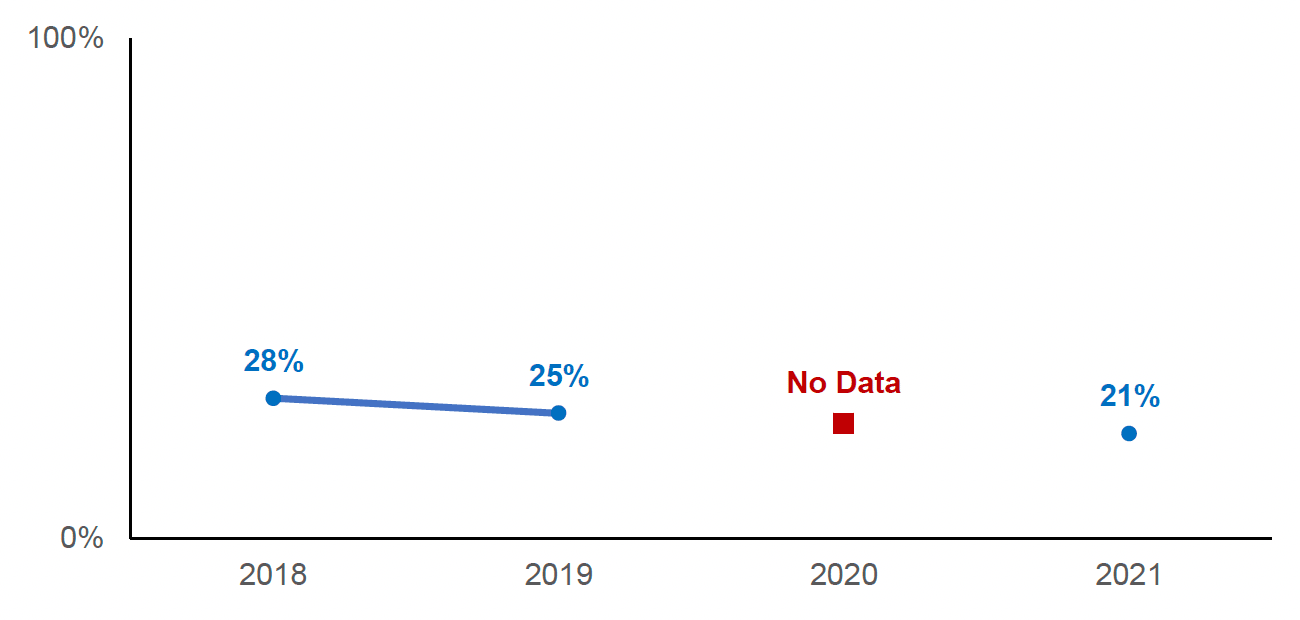
Indicator 10: Childcare affordability
Percentage of households with one or more children aged between 0 and 11 who pay for childcare and that say they find it difficult or very difficult to afford their household's childcare costs.
Source: Scottish Household Survey
There was a question change between 2019 and 2020. Before 2020, the question was only asked amongst those paying for childcare. From 2020 onwards, this question was asked of all households. In 2020, due to COVID related restrictions on data collection, the sample size was too small to show the percentage for only those paying for childcare so there is a gap in the time series. However, we are able to show this for 2021.
How this indicator relates to the child poverty targets:
Relative poverty √
Absolute poverty √
Low income + material deprivation √
Persistent poverty √
Childcare can be a significant cost for households with children. And a lack of affordable childcare can limit opportunities for paid employment.
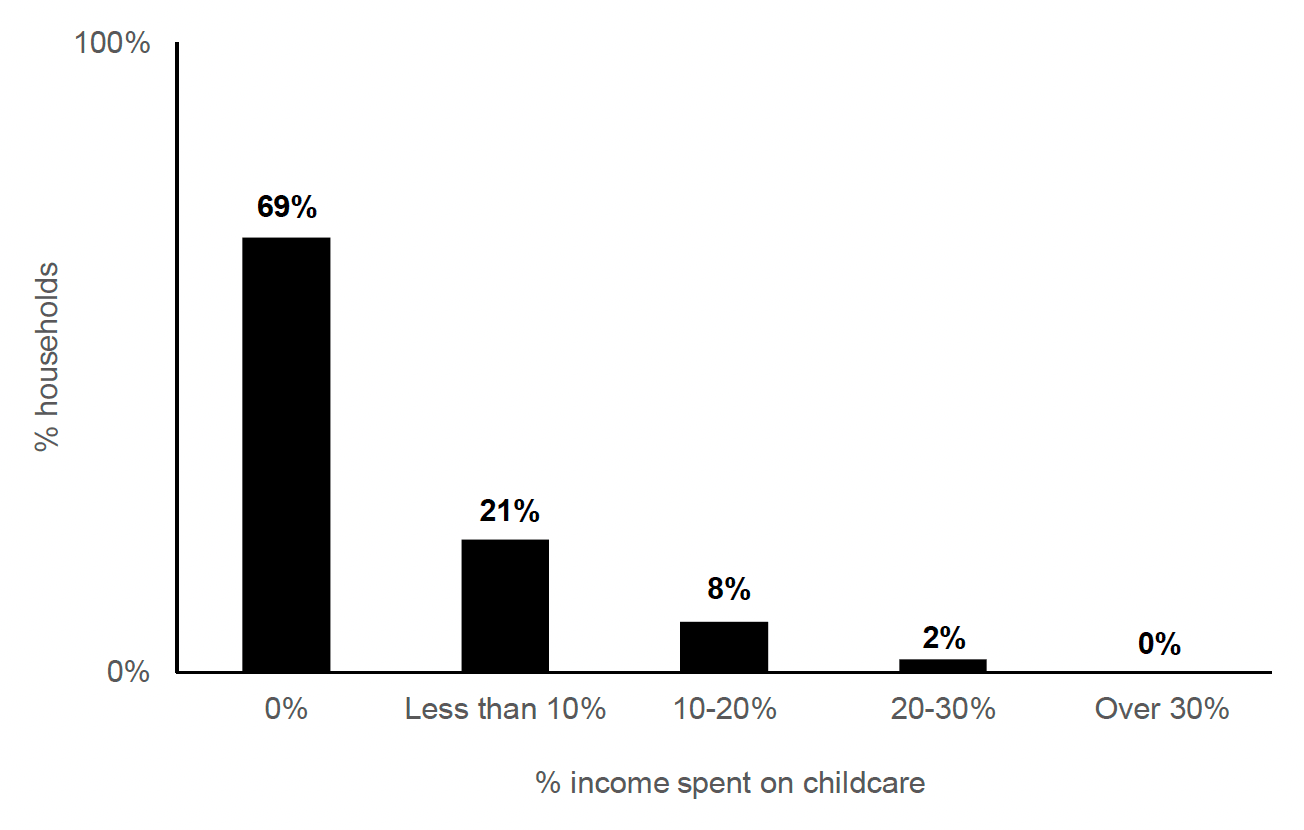
Indicator 11: Childcare costs
Annual household spend on childcare (all households with children 0-11) as a percentage of annual income. This is a new indicator from 2023.
Source: Scottish Household Survey (2021)
How this indicator relates to the child poverty targets:
Relative poverty √
Absolute poverty √
Low income + material deprivation √
Persistent poverty √
Childcare can be a significant cost for households with children. A lack of affordable childcare can limit opportunities for paid employment.
Indicator 12: Transport costs
Percentage of income spent on transport costs by low income households with children (median proportion spent of annual net income). This is a new indicator from 2023. This indicator will be updated as a time series in the future.
Source: Transport Scotland analysis of Scottish Household Survey (2021)
How this indicator relates to the child poverty targets:
Relative poverty √
Absolute poverty √
Low income + material deprivation √
Persistent poverty √
Transport costs are a largely unavoidable expense and higher spend on transport can contribute to households experiencing material deprivation.
Indicator 13: Transport affordability
Percentage of people, from low income families with children, reporting that they find it fairly, or very, difficult to afford their individual transport costs. This is a new indicator from 2023. This indicator will be updated as a time series in the future.
Source: Transport Scotland analysis of Scottish Household Survey (2021)
How this indicator relates to the child poverty targets:
Relative poverty √
Absolute poverty √
Low income + material deprivation √
Persistent poverty √
Lack of affordable transport options can restrict people's access to goods and services (for example, having a choice of where to shop which could save money). It may also limit access to employability as the cost of travelling for work detracts from potential earnings.
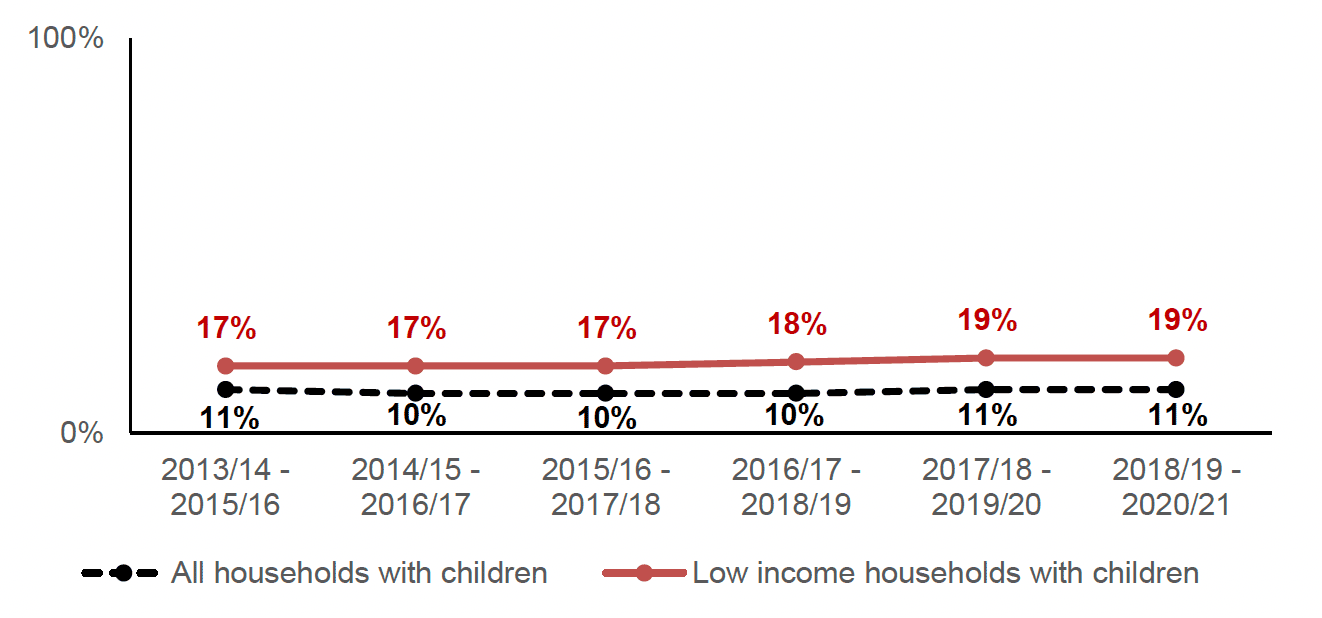
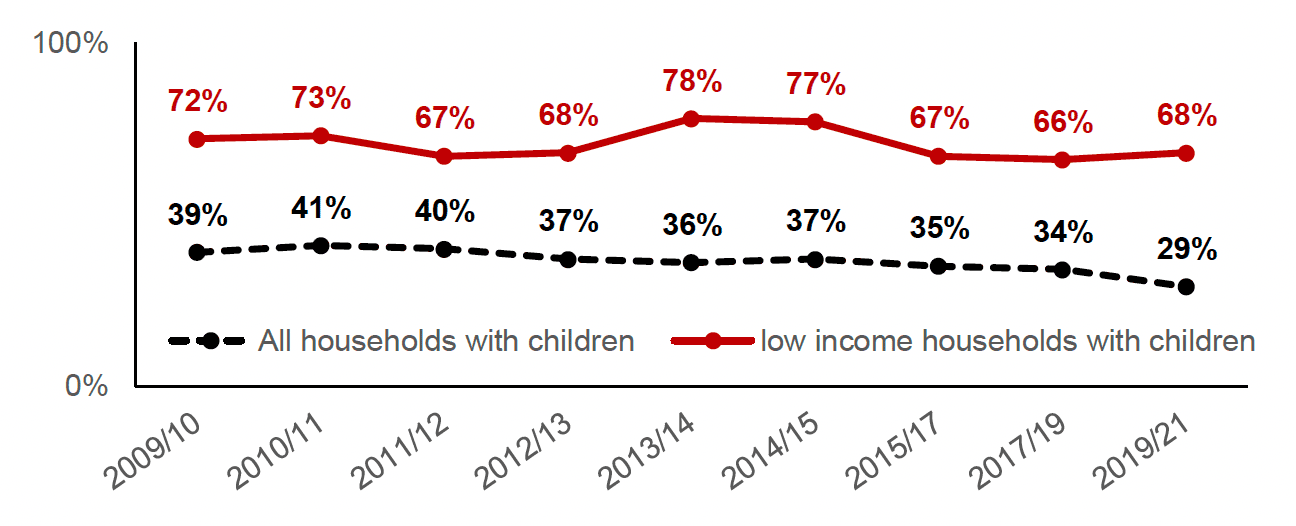
Indicator 14: Housing costs
Percentage of net household income spent on housing by low income households (bottom three income deciles) with children. Figures for all households with children are also provided for context.
Source: Family Resources Survey
How this indicator relates to the child poverty targets:
Relative poverty
Absolute poverty
Low income + material deprivation √
Persistent poverty
Housing costs are often the largest single cost a household will face, particularly for those on low incomes. All four of the child poverty targets are based on the income that households have left after housing costs have been deducted.
Indicator 15: Fuel poverty
The percentage of households with children in fuel poverty or extreme fuel poverty. The rate for all households (i.e. including those without children) is shown for comparison. This is a new indicator from 2023.
A household is in fuel poverty if:
- in order to maintain a satisfactory heating regime, total fuel costs necessary for the home are more than 10% of the household's adjusted (i.e. after housing costs) net income; and
- if, after deducting those fuel costs, benefits received for a care need or disability and childcare costs, the household's remaining adjusted net income is insufficient to maintain an acceptable standard of living.
Source: Scottish House Condition Survey. To note that figures up to 2019 are based on real data. There is no data for 2020 due to COVID-19 related restrictions on data collection. Data from 2021 onwards is based on Scottish Government scenario modelling which uprates modelled fuel bills from the 2019 Scottish House Condition Survey in line with more recent energy prices and accounting for the other support available to households.
How this indicator relates to the child poverty targets:
Relative poverty √
Absolute poverty √
Low income + material deprivation √
Persistent poverty √
Fuel costs are not deducted from income for the purposes of determining whether a household is in income poverty. However, spending a high proportion of household income on fuel is a risk factor for material deprivation as households may struggle to afford a reasonable standard of living.
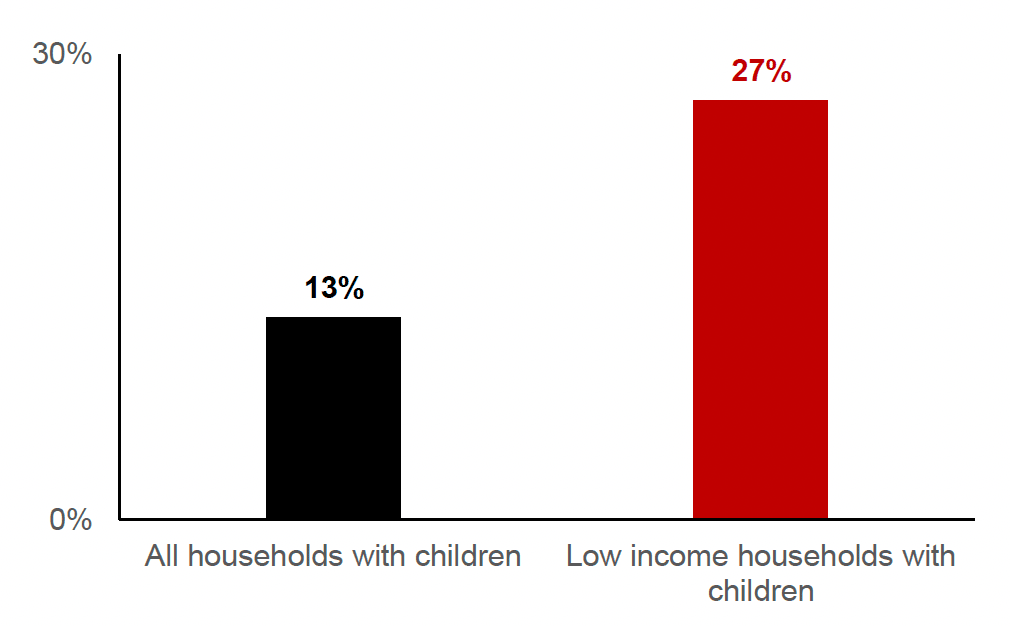
Indicator 16: Food affordability
Percentage of net income spent on food and non-alcoholic drinks by low income households with children. The rate for all households with children is shown for comparison.
Source: Family Resources Survey
How this indicator relates to the child poverty targets:
Relative poverty √
Absolute poverty √
Low income + material deprivation √
Persistent poverty √
Food costs are not deducted from income for the purposes of determining whether a household is in income poverty. They do, however, affect the risk of material deprivation, as families spending a greater percentage of their income on food will be less likely to afford essential goods and services.
Indicator 17: Food security
Percentage of children in low income households with low or very low food security. Food security status is based on the USDA (United States Department for Agriculture) food security scale. Referring to the last 30 days, people are asked whether, and how often, they were worried about running out of food, had to reduce meal sizes or skip meals. From the questions, a ten-point household score is generated. A score of 3-5 = low food security; 6-10 = very low food security.
This is a new indicator from 2023.
Source: Family Resources Survey (2019-2022). Multiple years' data combined due to sample size.
How this indicator relates to the child poverty targets:
Relative poverty √
Absolute poverty √
Low income + material deprivation √
Persistent poverty √
Access to affordable food is essential to maintaining a reasonable standard of living. High prevalence of food insecurity indicates that costs are too high, incomes are insufficient, or both.
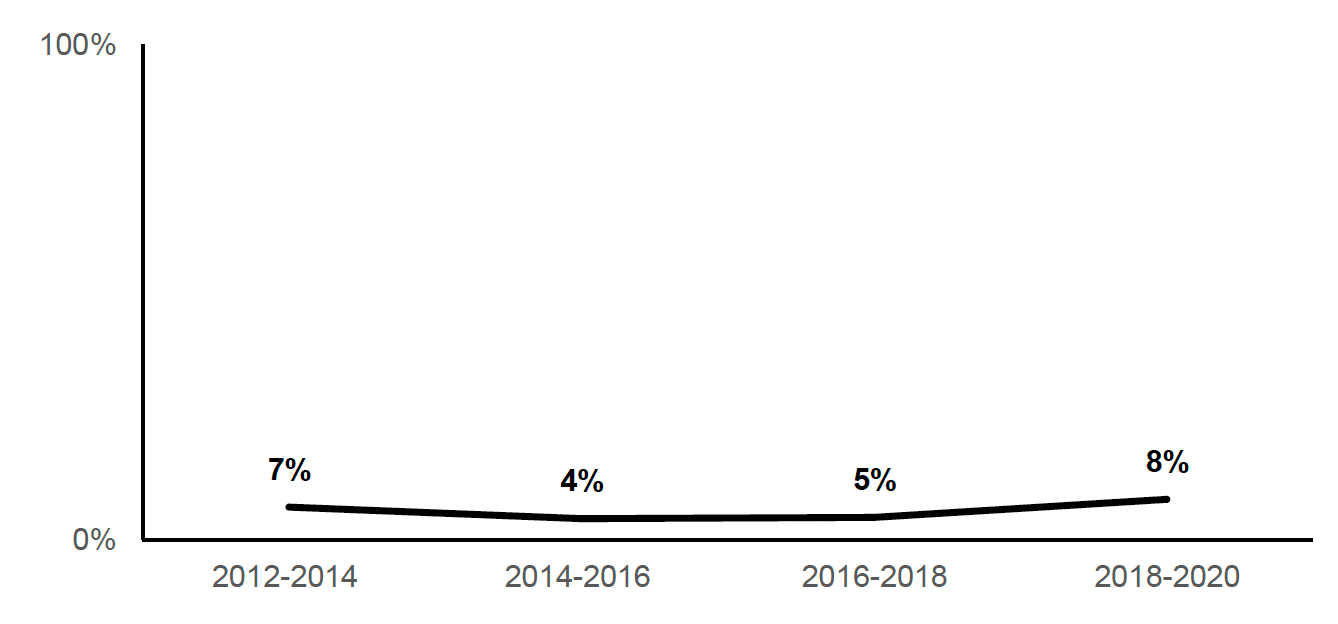
Indicator 18: Unmanageable debt
Percentage of households with children in unmanageable debt. Unmanageable debt is defined as having at least one of the following three problems:
1. household debt repayments represent at least 25% of net monthly income AND at least one adult in the household reports falling behind with bills or credit commitments
2. at least one adult in the household is currently in two or more consecutive months arrears on bills or credit commitments AND at least one adult in the household reports falling behind with bills or credit commitments
3. household debt represents at least 20% of net annual income AND at least one adult considers their debt a heavy burden
Source: Wealth and Assets Survey. This survey is carried out biennially. New figures will be available in next year's measurement framework (i.e. in 2024).
How this indicator relates to the child poverty targets:
Relative poverty
Absolute poverty
Low income + material deprivation √
Persistent poverty
Debt repayments are not deducted from income for the purposes of determining whether a household is in income poverty. They do, however, reduce the amount of disposable income that households with children have to spend on goods and services, thereby increasing their risk of material deprivation.
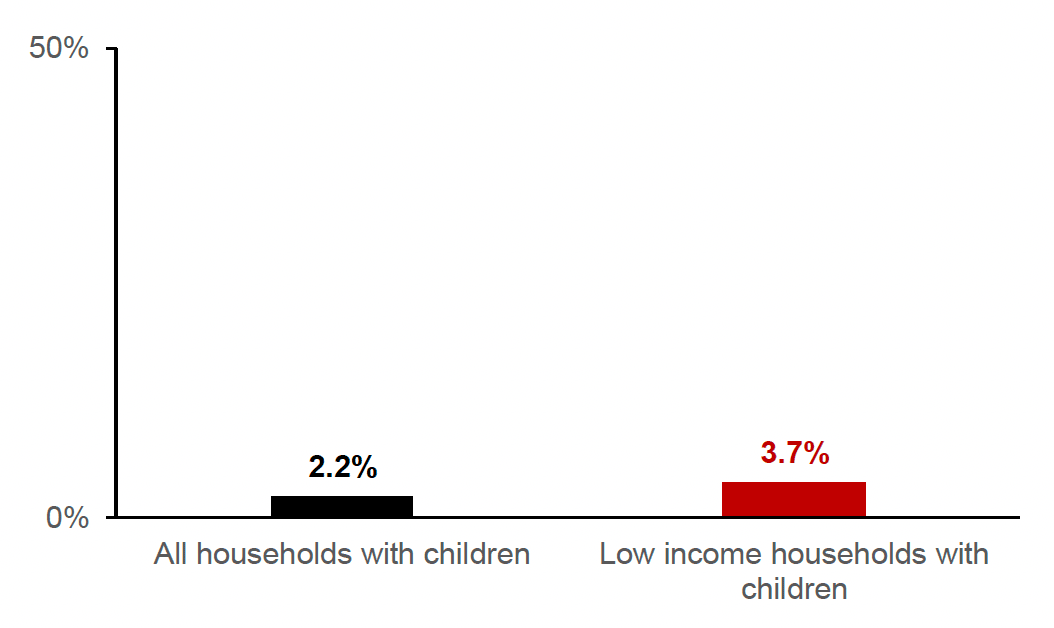
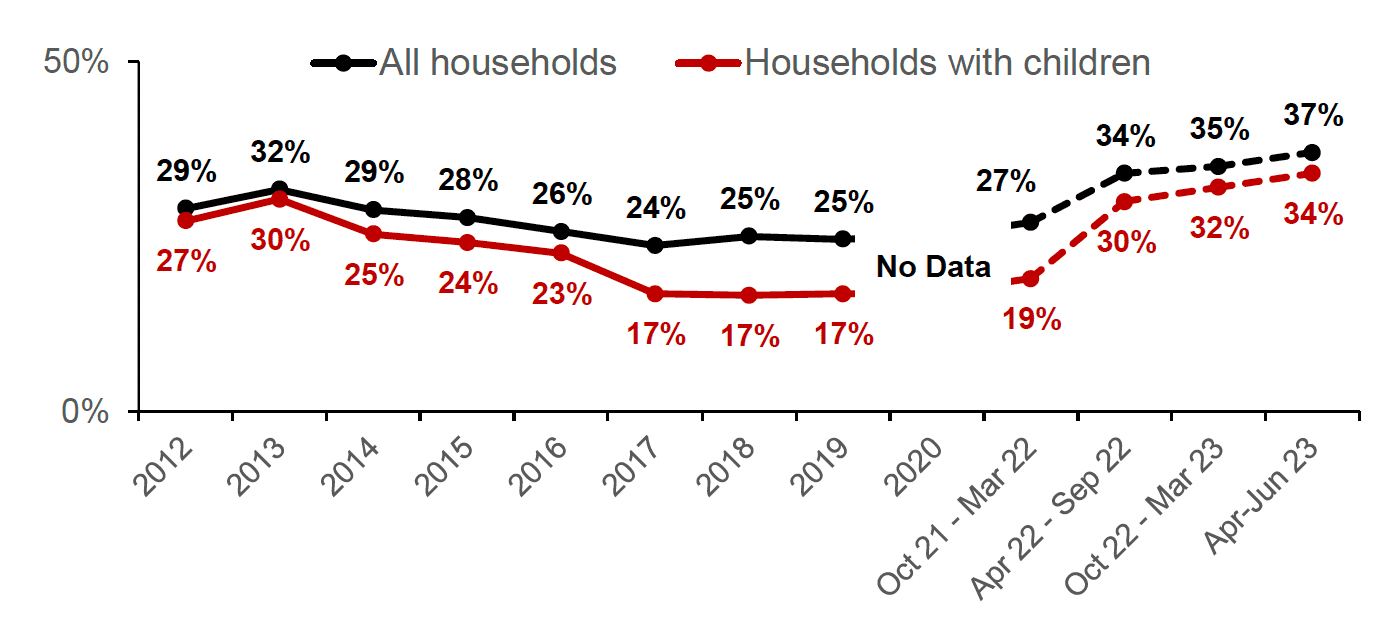
Indicator 19: Access to affordable credit
Percentage of households with children that have used high cost credit in the past 12 months. High cost credit is defined as including: catalogues or mail order schemes; hire or rental purchase agreements (like BrightHouse); cash loan from a company that comes to your home to collect payments; loan from a pawnbroker/cash converters; loan from a pay day lender.
Source: Scottish Household Survey. To note that sample sizes are too small to show figures for low income households with children. However estimates are closely aligned with the figures for all households with children.
How this indicator relates to the child poverty targets:
Relative poverty
Absolute poverty
Low income + material deprivation√
Persistent poverty
Access to affordable credit can protect against problem debt and material deprivation. It acts as a buffer against unexpected costs (e.g. replacing a broken washing machine) and fluctuations in income.
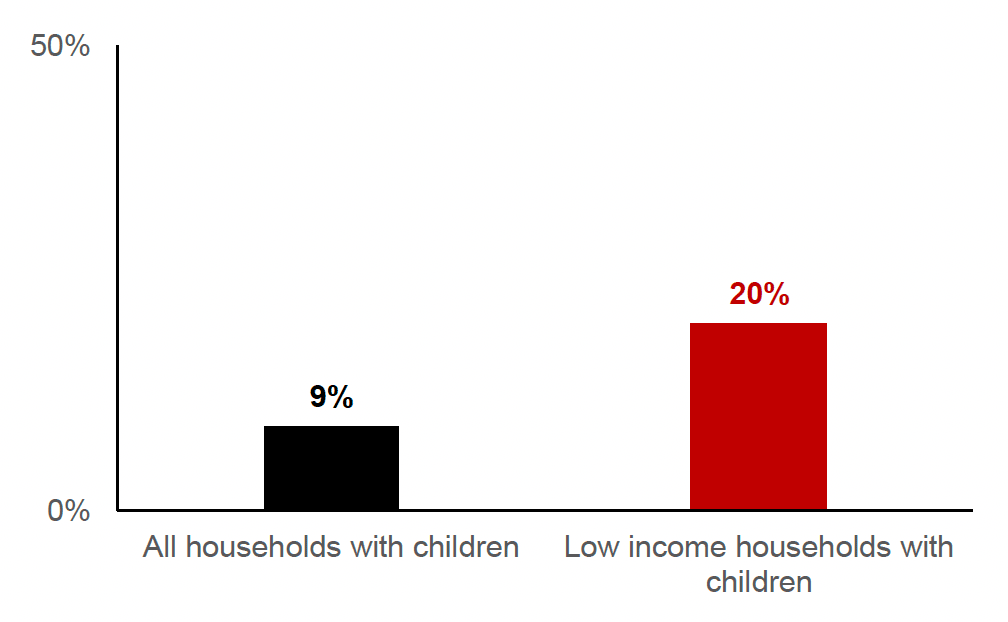
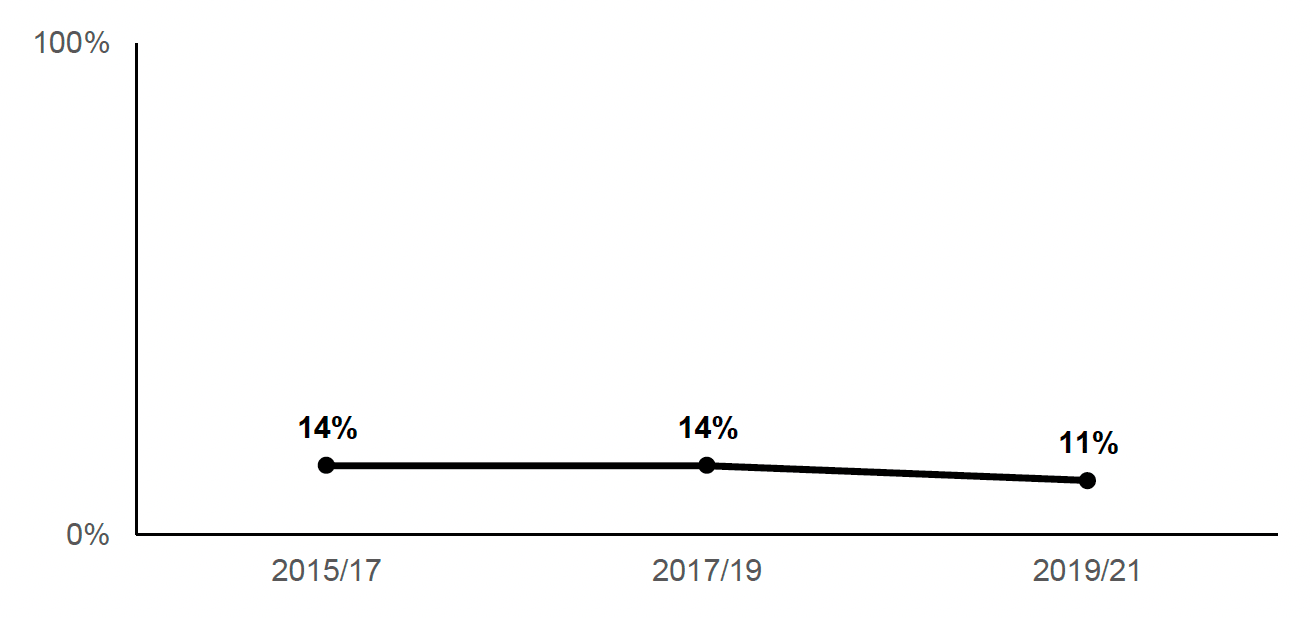
Indicator 20: No savings
Percentage of low income households (bottom three income deciles) with children that have no savings (survey respondents answering that they have no savings or investments at all) . Figures for all households with children are also provided for context.
Source: Scottish Household Survey
How this indicator relates to the child poverty targets:
Relative poverty
Absolute poverty
Low income + material deprivation √
Persistent poverty
Savings protect against problem debt and material deprivation. They act as a buffer against unexpected costs (e.g. replacing a broken washing machine) and fluctuations in income.
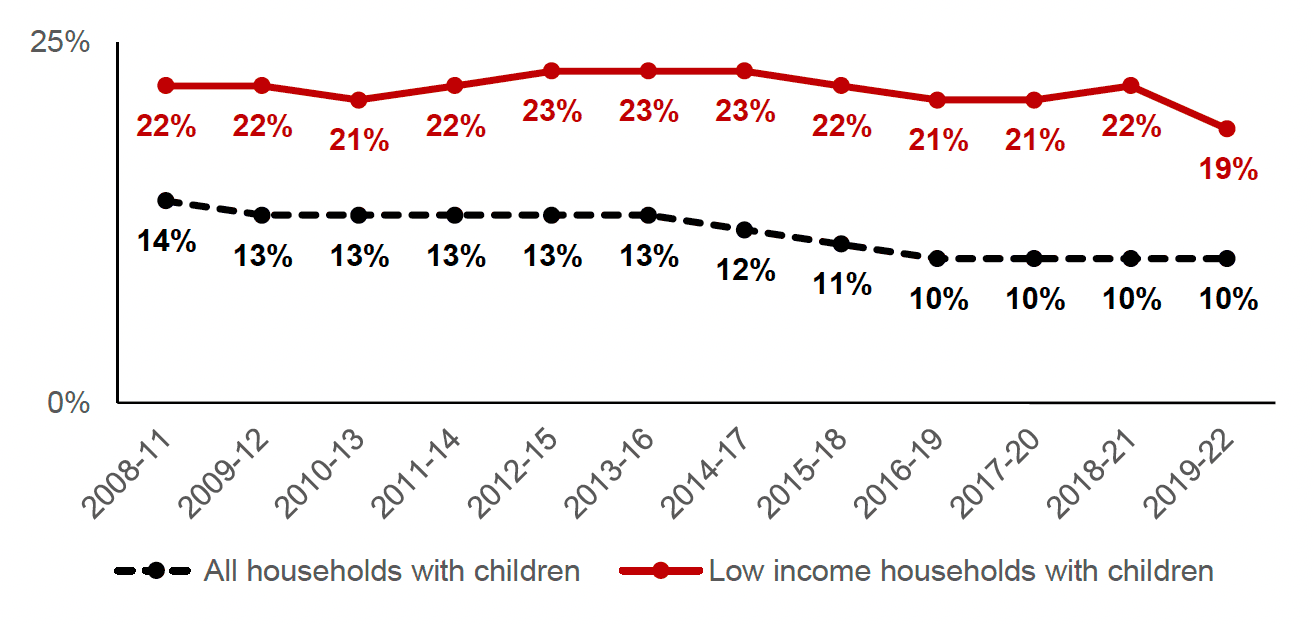
Indicator 21: Internet access
Percentage of low income households (bottom three income deciles) with children that have home internet access. Figures for all households with children are also provided for context.
Source: Scottish Household Survey
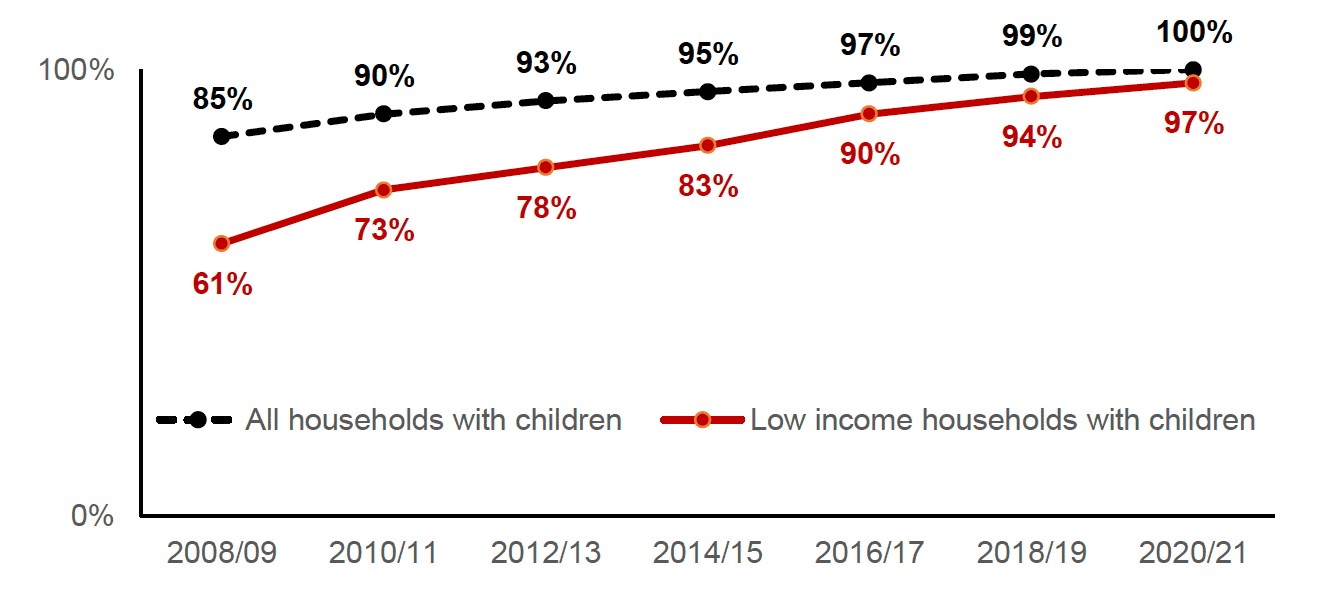
How this indicator relates to the child poverty targets:
Relative poverty √
Absolute poverty √
Low income + material deprivation √
Persistent poverty √
Access to the internet allows opportunities to find lower-cost financial products and services, online banking, price comparison sites and online deals. Internet access and digital literacy also increase people's chances of accessing jobs and getting the benefits they are entitled to.
Contact
Email: TCPU@gov.scot