Tackling child poverty delivery plan - progress report 2022-23: annex a - measurement framework
Child poverty measurement framework with the latest data on the drivers of child poverty. The indicators in the child poverty measurement framework are intended to monitor these drivers of poverty.
Driver: Income from employment
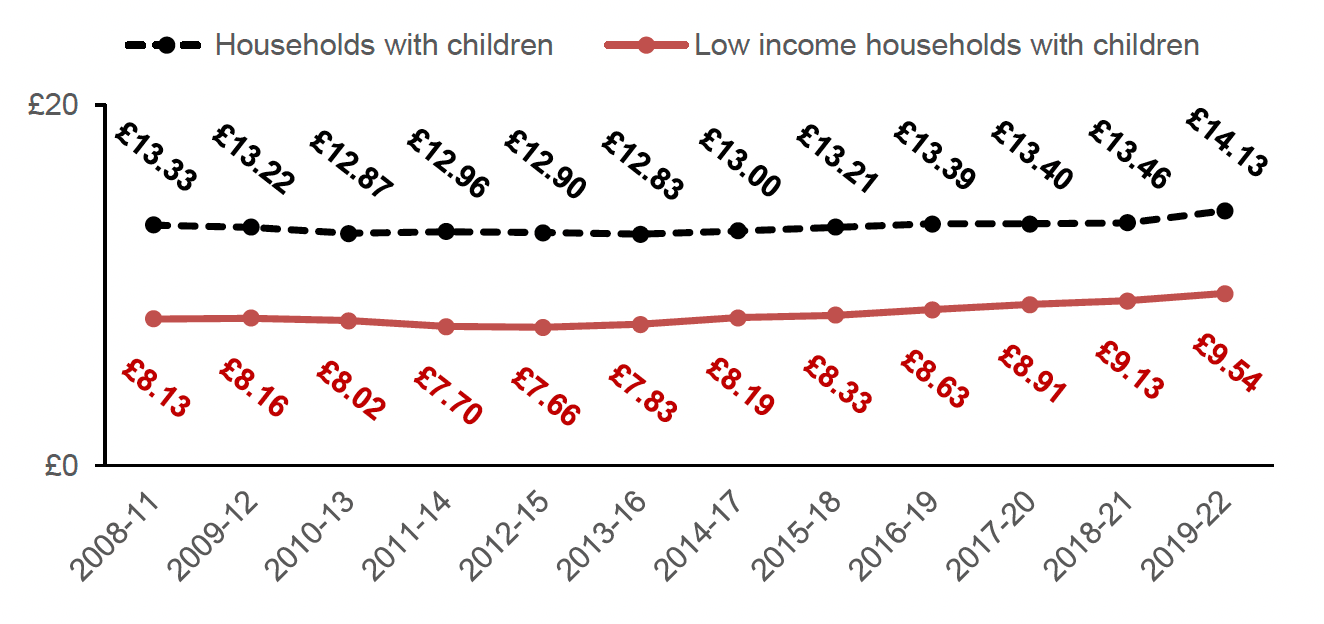
Indicator 1: Hourly pay
Average hourly earnings, in 2021/22 prices, of low income households (bottom three income deciles) with children where at least one adult is in employment. Figures for all households with children are also provided for context.
Source: Family Resources Survey
How this indicator relates to the child poverty targets:
Relative poverty √
Absolute poverty √
Low income + material deprivation √
Persistent poverty √
Hourly pay is a direct driver of income from employment, and therefore influences all four targets. Because poverty is measured at the household level, the hourly pay indicator monitors the average hourly pay per household rather than per parent. Earnings for all years are presented in 2020/21 prices, in order to adjust for inflation when looking at trends over time.
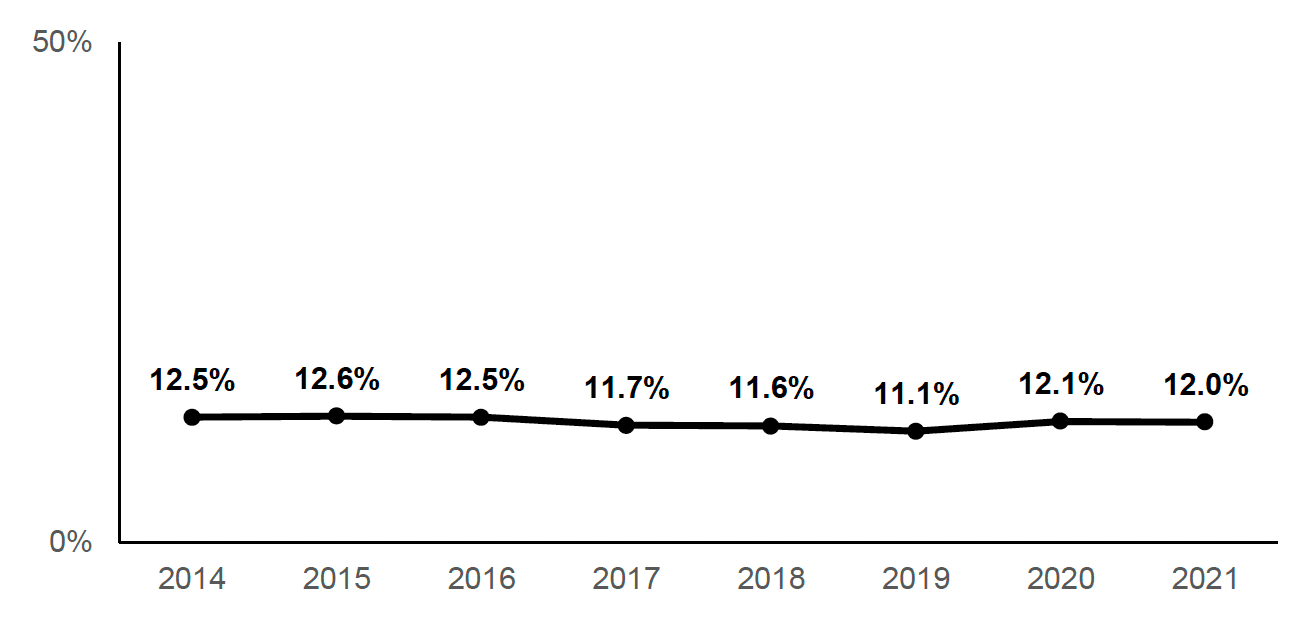
Indicator 2: No Paid employment
Percentage of children living in households where no adult is in paid employment.
Source: Annual Population Survey
How this indicator relates to the child poverty targets:
Relative poverty √
Absolute poverty √
Low income + material deprivation √
Persistent poverty √
Hours worked is a direct driver of income from employment, and therefore influences all four targets. Households with no-one in paid employment are at significantly higher risk of being in poverty.
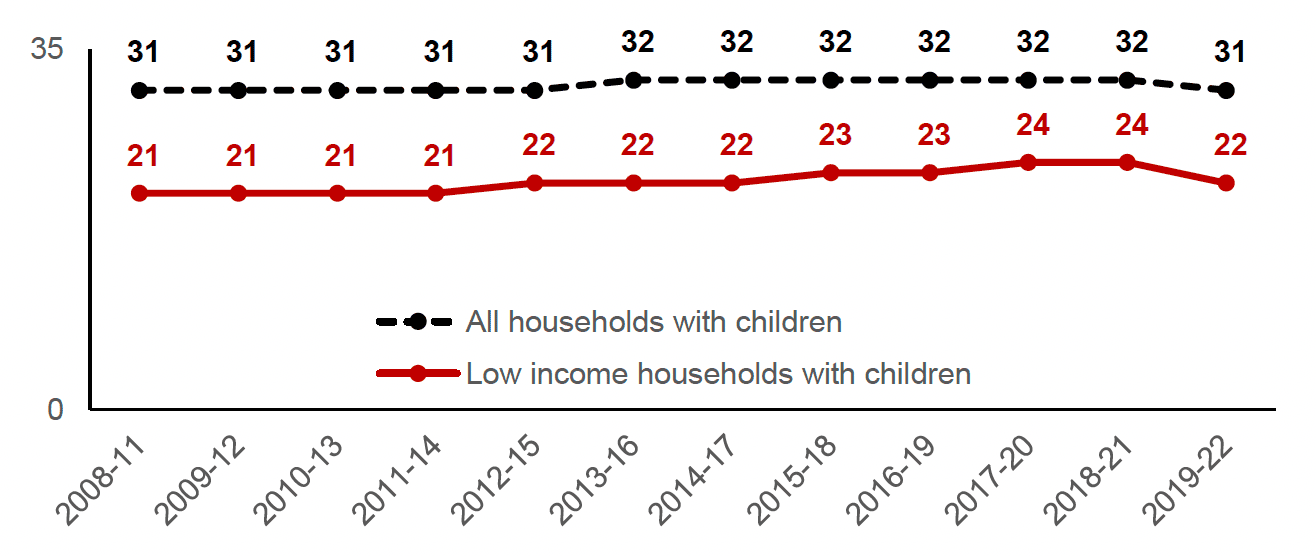
Indicator 3: Hours worked
Average (median) number of hours of paid employment per working-age adult, in low income households (bottom three income deciles) with children where at least one adult is in employment. Figures for all households with children are also provided for context.
Source: Family Resources Survey
How this indicator relates to the child poverty targets:
Relative poverty √
Absolute poverty √
Low income + material deprivation √
Persistent poverty √
Hours worked is a direct driver of income from employment, and therefore influences all four targets. The risk of poverty reduces as the number of hours worked increases.
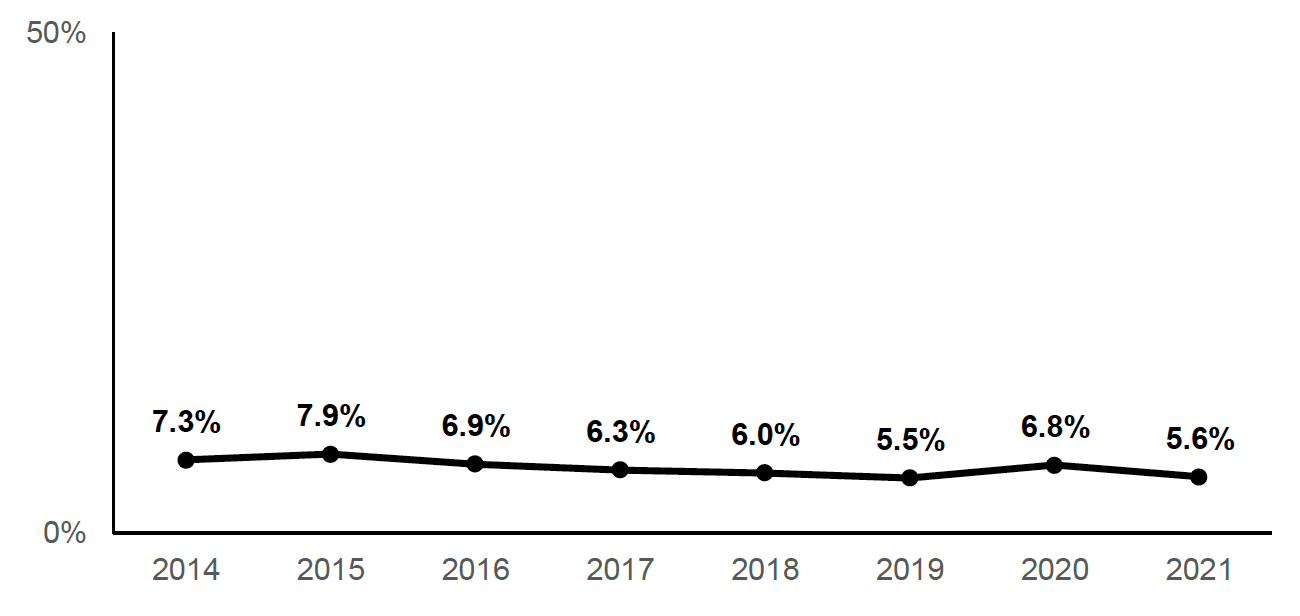
Indicator 4: Under-employment
Percentage of parents (16-64) who are in work but would prefer to work more hours in their current job (at the same rate of pay), in an additional job or in a new job with longer hours to replace their current job.
Source: Annual Population Survey
How this indicator relates to the child poverty targets:
Relative poverty √
Absolute poverty √
Low income + material deprivation √
Persistent poverty √
The number and type of jobs available in the labour market have an impact on parents' hours worked, through the employment opportunities they have access to.
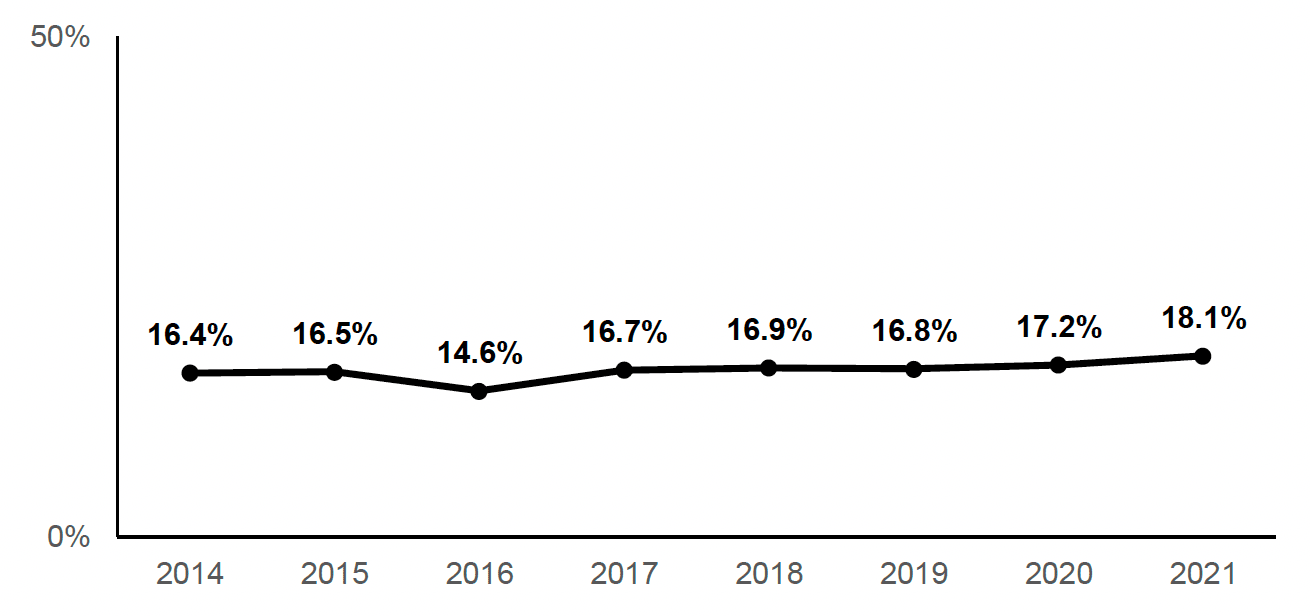
Indicator 5: Underutilisation of skills
Percentage of employed working age (16-64) parents with degrees who are in low or medium skilled occupations.
Source: Annual Population Survey
How this indicator relates to the child poverty targets:
Relative poverty √
Absolute poverty √
Low income + material deprivation √
Persistent poverty √
The number and type of jobs available in the labour market have an impact on parents' hourly pay, through the employment opportunities they have access to.
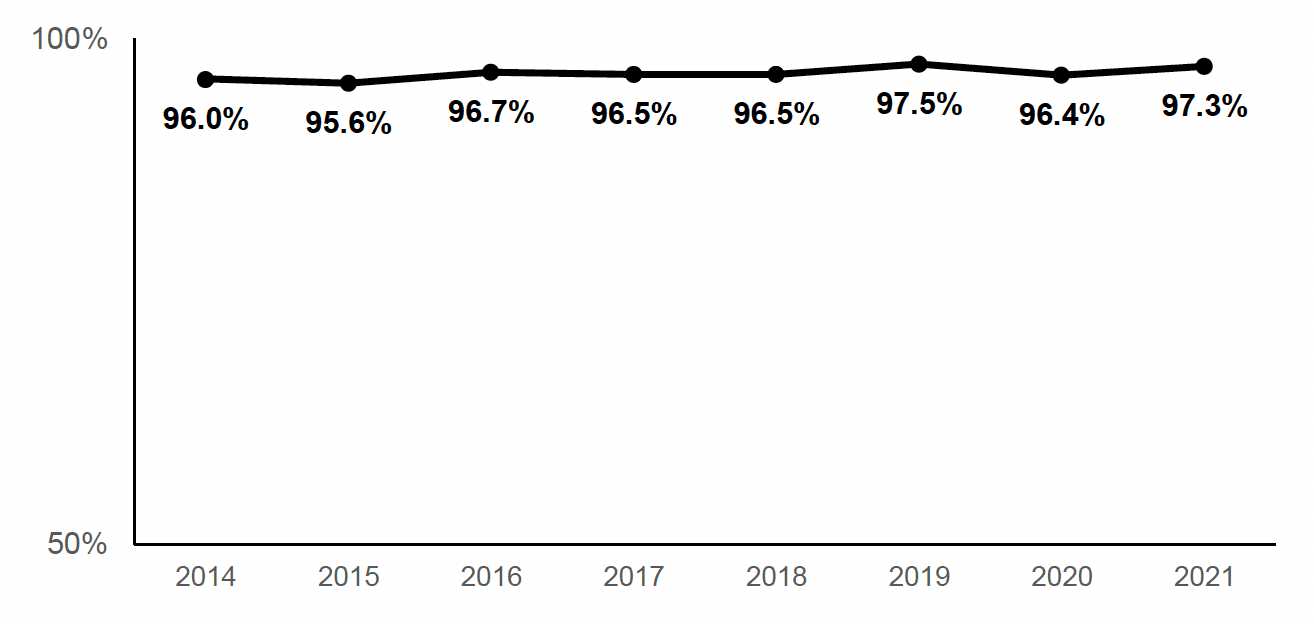
Indicator 6: Secure work
Percentage of parents (16+) in employment who have a permanent work contract. This is a new indicator from 2023.
Source: Annual Population Survey
How this indicator relates to the child poverty targets:
Relative poverty √
Absolute poverty √
Low income + material deprivation √
Persistent poverty √
Being in insecure work can lead to fluctuating household incomes which can make managing finances difficult. It can also make it harder to get a loan or mortgage which can lead to higher spending. Insecure contracts are also generally associated with lower paid work.
To note that estimates of the proportion of employees in contractually secure work do not currently differentiate between the types of agreed working arrangement. Zero-hours contracts, which are by definition insecure, are therefore included in overall number of employees deemed to be 'contractually secure'.
Future updates to this indicator are expected to exclude zero-hours contracts, even if such a contract is considered to be permanent.
Employees are those who have reported that they are in employment and are paid a wage by an employer for the work that they do. To be classed as being in employment, a person must have done at least one hour of paid work in the week prior to their interview or have a job that they are temporarily away from (e.g. by being on holiday or off sick).
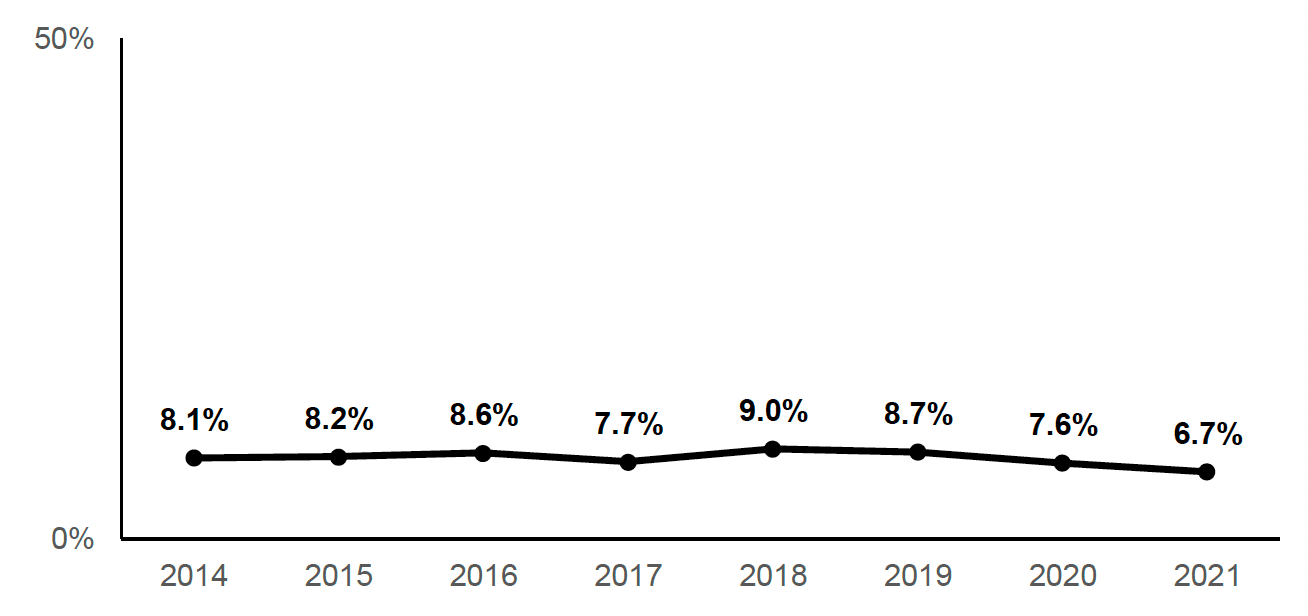
Indicator 7: Parents' Qualifications
Percentage of parents (16-64) with no or low qualifications. Low, or no, qualifications equals Scottish Credit & Qualifications Framework level 4 or lower.
Source: Annual Population Survey
How this indicator relates to the child poverty targets:
Relative poverty √
Absolute poverty √
Low income + material deprivation √
Persistent poverty √
People with higher qualifications are much less likely to experience poverty than those with no or lower qualifications. Skills and qualifications affect income from employment in two main ways: the likelihood of getting a job, and how much someone is paid.
Contact
Email: TCPU@gov.scot