Tackling child poverty delivery plan: progress report 2022 to 2023
The first annual progress report for 'Best Start, Bright Futures: Tackling Child Poverty Delivery Plan 2022-2026'. Outlining action for the period 2022 to 2023.
Assessing progress against the targets
While the rest of this report looks at progress from April 2022 to March 2023, including in relation to the implementation and impact of actions, this chapter, drawing on available survey data covers up to March 2022. It builds on the previous progress report which looked at the period April 2020 to March 2021. This report is framed by the evaluation strategy and the updated measurement framework.
Specifically, this chapter includes:
- overall progress towards the child poverty targets.
- updated child poverty data amongst priority family types.
- trends on child poverty drivers (income from employment, cost of living and income from social security and benefits in-kind).
Child poverty rates
Overall, child poverty rates appear stable after a recent gradual rise. Still, too many people are living in poverty in Scotland, at a level above our statutory targets. Updated modelling Annex B suggests that relative poverty is expected to be around 9 percentage points lower than it would have been in 2023- 24 in the absence of Scottish Government policies.
Progress towards child poverty targets needs to be framed in the context of the wider social, political and economic climate of recent years. More specifically, that is the impact that EU exit and the COVID-19 pandemic has had, and continues to have, on the wider society and low income families in particular.
The latest figures (2021-22) are the first usable data collected during the COVID-19 pandemic years. Evidence showed that the pandemic inevitably had a significant economic and social impact. The negative impact of the pandemic was more acute amongst low income households, including those in or at risk of child poverty. Furthermore, the latest statistics do not yet reflect the full impact of the increases to and expansion of the Scottish Child Payment from November 2022.
What is the latest progress against child poverty targets?
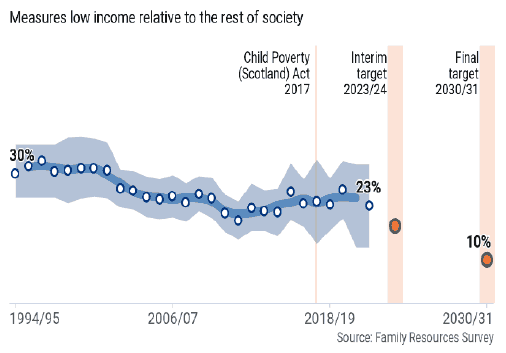
The child poverty targets are set on single-year rates. When looking at single-year estimates, data shows a slight drop in relative and absolute poverty (see Figure 1). However, the recent gradual fall is small and needs to be viewed cautiously. This is because when accounting for confidence intervals of the sample data, we need repeated data to confirm the trend is established. Taking this approach, our assessment is that child poverty rates are broadly stable.
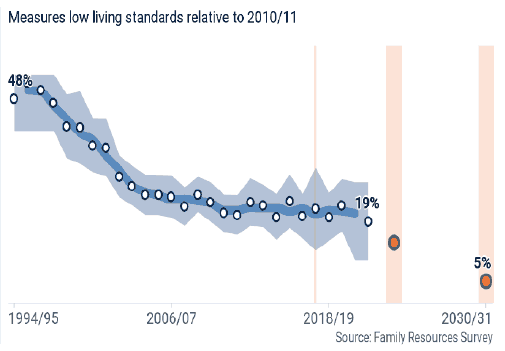
A similar trend is also evident for the target on low income and material deprivation. At a first glance, single year estimates for 2021-22 show a decrease. However, the latest estimate cannot be directly compared to previous estimates because the latest period covers a time when families were less able to undertake certain activities due to the pandemic, and it is yet unclear what sort of effect this had on how people answered the material deprivation questions.
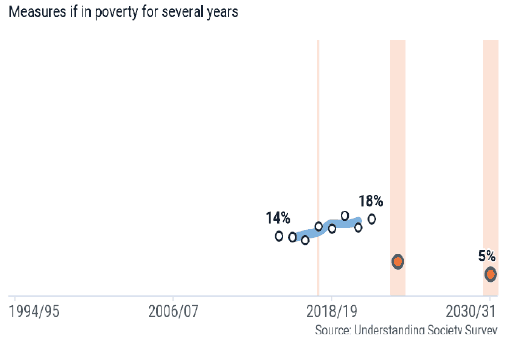
Persistent poverty statistics have been significantly revised, showing now a slow upward trend. This means that the proportion of households in relative poverty for three out of the last four years have increased slowly in recent years.
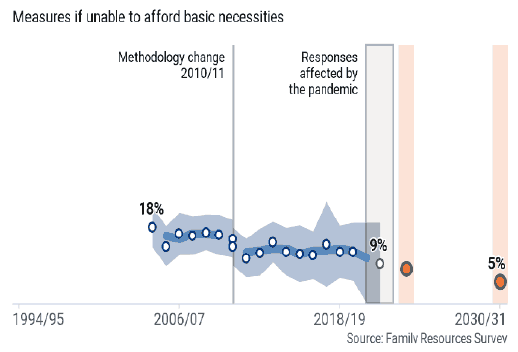
Detailed information on trends for all of the child poverty targets is shown in Figure 1. The dots and labels show single-year estimates, the shaded areas show indicative 95% confidence intervals around the single-year estimates, and the lines show three-year averages. The single-year figures give the latest estimate on poverty rates for the four measures in the Child Poverty (Scotland) Act 2017. The charts include three-year averages as they portray underlying trends more accurately.
Figure 1: Child Poverty targets
In order to understand whether this is likely to be a real pattern, we also look at trends of the measurement framework indicators, modelling of the cumulative impact of policies and evaluation findings of individual policies and local action. The assessment is provided in detail in the sections that follow. But before we go into that level of detail, it is also relevant to show child poverty rates amongst those family types known to be a higher risk of poverty.
Child poverty priority family types
There are some households which have a higher than average risk of being in poverty. We refer to these as ‘priority family types’. These are households with a disabled person, three or more children, a baby aged under 1, minority ethnic households, mothers aged under 25, and lone parent families.
The latest available child poverty rates continue to show that those in priority family types are more at risk of being in poverty. The latest figures are shown in tables 1 and 2 below. Further details on poverty rates among priority family types over time are published online.
| Relative poverty | Absolute poverty | Low income and material deprivation | |
|---|---|---|---|
| All children | 24% | 21% | 11% |
| Lone parent household | 38% | 36% | 23% |
| Minority ethnic household | 39% | 34% | 16% |
| 3+ children in household | 34% | 32% | 18% |
| Disabled person in household | 28% | 24% | 18% |
| Baby aged under 1 in household (data from 2017-20) | 34% | 30% | 13% |
| Mothers aged 25 or under (data from 2015-18) | 55% | 49% | 26% |
Source: Family Resources Survey.
Persistent poverty data is available for two priority family types; that is households with a disabled person and families with children under 5.[2] Data for other priority family types is not available due to limited sample sizes. However, amongst the data available, it is clear that persistent poverty remains higher amongst priority family types when compared to levels for all children.
| Persistent poverty | |
|---|---|
| All children | 18% |
| Disabled adult in benefit unit | 28% |
| Children under 5 in benefit unit (note: there is no data for baby under 1) | 22% |
Source: Understanding Society.
In addition, we continue to deepen our understanding of the priority family types around the drivers of poverty and what works for them. In the past year we have published:
- An updated summary slide pack on latest evidence for the priority family types. The pack was originally developed to inform policies and programmes to reduce child poverty in development of ‘Best Start, Bright Futures’. Since its publication it has proven a useful source of relevant information on priority family types. Therefore, we have updated the pack to reflect the most recent statistics and key information for each priority family type on: key demographics, drivers of poverty and key issues to consider.
- A review of our approach to reporting evidence of impacts in groups and how to make best use of this evidence.
- An evaluation framework with guidance on how to assess the impact of policies on child poverty, including a section on who are the priority family types and how best to identify them from an evaluation perspective.
A detailed report for each priority family type has been published. These focus reports look at child poverty rates, progress in each of the three drivers of poverty alongside wider evidence. Scottish Government has published focus reports for: minority ethnic families, lone parent families, families with a disabled adult or child, families with mothers aged 25 or under, and families with a baby. In addition, Public Health Scotland, has published a focus report for families with three or more children.
Although survey statistics do not yet cover the period since the cost of living crisis started, this year’s focus report will summarise key available evidence in this respect. The focus report pulls key findings together around the impact of the cost of living crisis amongst low income families and priority family types in particular. The cost of living focus report will be published shortly.
The drivers of child poverty
In order to better understand changes in the target measures of child poverty, we look at the three drivers of poverty. That is: income from employment, cost of living, and income from social security and benefits in-kind. The measurement framework provides a range of indicators for each of the drivers that can be tracked over time.
Due to the impact of COVID-19 restrictions on the data collection of many national surveys, some indicators on the measurement framework could not be updated during the pandemic years (2020-22). Where the data is available and can be trusted to be reliable and robust, data and trends have been added.
In the year four report, it was evident the pandemic had an impact on many aspects of the Scottish economy, the labour market and in turn, people’s lives. It exacerbated inequalities which already existed. At that point, the impact on the drivers of poverty, primarily income from employment and cost of living was acute. Since then, latest evidence showed that:
- The cost of living crisis has been an ongoing challenge for all, but in particular for those already on low incomes. They are entering this latest crisis with less resources and tools at their disposal after economic difficulties extending back to 2008.
- Increasing income through paid employment is an important tool. However, while hourly pay appears to be increasing, there remain challenges for many to increase the amount they work, such as childcare availability and family commitments. Importantly, many people struggle to find work that matches their skills, which may pay better.
- Despite most elements of Universal Credit being uprated from 2020-21 for households with a housing element the real value of awards is still being eroded by inflation.
Looking now at each driver of poverty in detail.
Income from employment
It is well known that being in work can have a positive impact on poverty outcomes. However, evidence shows that it is not only a matter of having a job. Many families living in poverty are already working. Instead, what is needed, is well-paid, stable and secure contracts that allow families to not live in poverty.
Positively, hourly pay continues to show a slight upward trend over the year to 2021. Increases are greater for low income households, which should support decreases in poverty rates. However, barriers still exist to further increase income from employment. Low income households with children tend to work less hours. At the same time, the proportion who would like to work more hours (i.e. the rate of ‘under-employment’) is decreasing. This means, that less people would like to work more. There will be a range of reasons for this, that can include, unpaid caring, unpaid work, health or costs associated with work (such as transport or childcare) or simply that they are already working the amount of hours that they want to work.
Improving the level of education, has long been seen as a tool for ensuring better paid jobs. Positively, the level of parental qualifications has been improving over time. But these degrees or higher qualifications are not bringing better paid jobs. Underutilisation of skills is, albeit slightly, increasing. This means, that while parents are more likely to have degrees they are still working in low or medium skilled occupations.
Cost of living
The cost of living is the term used when referring to the prices of day-to-day goods and services. Price increases, such as the recent spikes seen during the cost of living crisis, impact on low income households more acutely.[3] This is because they spend a higher proportion of their income on essential goods and services. Moreover, families on low incomes have been living in a constant financial crisis since the 2008 crash, the decade of austerity that followed, and the impacts of the COVID-19 pandemic.[4] This means, that they entered the cost of living crisis in a highly vulnerable position. They have very limited, or no options, left to reduce their household costs. Full detail will be provided in the upcoming focus report on the cost of living crisis.
The Scottish Government has provided significant support across a wide range of areas to help families with the cost of living. Policies covered transport, childcare, housing, energy and food amongst others. There is some indication of positive trends in the indicators around cost of living. Some progress is evident on housing, childcare and transport. However, the combined UK and Scottish Government packages have not entirely replaced rising costs to minimise food insecurity and fuel poverty. With financial stability weakening recently, further support in this area will be beneficial in the longer term too.
In terms of housing, the most recent data (2019-22) shows a slight decrease in the proportion of household income spent on housing for low income families with children. However, due to small sample sizes of this group and issues relating to data quality during the period of the COVID-19 pandemic, this change should be treated with caution. In the year ending March 2022 a total of
9,757 affordable homes were completed.[5] An estimated 3,220 households with children have been helped into affordable housing in the year ending March 2022.[6] It is estimated that keeping social rents substantially lower than market rents benefits approximately 140,000 children in poverty each year.[7]
Childcare availability has continued to increase over time. Despite positive trends seen, this data does not yet cover the period since the extension of the Early Learning and Childcare provision. But early evidence from the policy evaluation already demonstrates the positive impact ELC is having on families with pre-school age children. For many (61%) the funded provision allows them to work or look for paid work. Some stated that the funded hours enabled them to increase the number of hours they work. Two parent households, or those already in work, were more likely to use funded ELC as a way of further increasing their income from employment. Those in deprived areas, lone parents or one earner households, were generally more likely than others to say that they were using their hours to study/develop skills, to care for others, and to look after themselves better and have been feeling happier and less stressed.[8]
The proportion of household income spent on transport is higher for low income families with children. Equally, perceived affordability of transport is lower for low income families with children. However, data precedes the introduction of free bus travel for under 22s, which is anticipated to significantly help low income families around both cost and affordability of transport.
Still, there are some areas for concern. The proportion of households with children who are in low or very low food security is too high (at 13% for Scotland, 27% amongst low income households with children). Moreover, around a third of households with children (34%) are modelled to be in fuel poverty from April to June 2023 despite the range of policies in place to support with ongoing increases to energy prices.
Financial health seems to have weakened slightly. The measurement framework shows that debt has increased and access to affordable credit is lower. While the vast majority of households have internet access, the rate of access decreases with income.[9] Moreover, the ways in which people access and use digital technology may be limited by income.
Income from social security and benefits in-kind
Social security is designed to supplement the income that households receive from other sources, primarily employment. As such, income from social security and benefits in- kind can play a significant role in supporting parents out of poverty.
The provision of the majority of social security and benefits in-kind for families in Scotland is delivered by DWP including most out-of-work or low pay benefits such as Universal Credit. It is estimated that around 80% of benefit spend remains reserved to the UK Government, with the rest being devolved to the Scottish Government.[10]
The majority of this spend is delivered by Social Security Scotland with the Scottish Welfare Fund and Discretionary Housing Payments administered by local authorities.
The social security indicators have been updated to better reflect the current system as the rollout of Universal Credit continues to progress. Consequently, the data series for the proportion of children who are estimated to be eligible for Universal Credit and Scottish Child Payment are at an early stage.
The analysis shows that the real value of both out-of-work and in-work benefits have been declining over time with the exception of the year the Universal Credit uplift was introduced. The main reason for the declining trend in recent years is due to inflation decreasing the real value of the housing element of Universal Credit.
The real value of in-work benefits experienced a slightly sharper decrease over time due to higher earnings resulting in larger deductions from the benefit. Work allowances and changes to the taper rate also have an impact but trends in the series are otherwise similar to the out-of-work benefits. The drop recorded in recent years is again due to inflation decreasing the real value of the housing element.
The last welfare reform report considered the impact of reversing UK Government welfare reforms since 2015, estimating that this would lift 70,000 people out of poverty in Scotland, including 30,000 children in 2023-24.[11] These series show the magnitude of the impact of the £20 uplift in the context of the benefit freeze.
In contrast since its launch towards the end of 2020-21 at the value of £10 per week the Scottish Child Payment has increased sharply in real terms to its current rate of £25.
Details of trend data for the drivers of child poverty are presented in Annex A.
Evaluating our policies
As set out in the updated evaluation strategy, our evaluation efforts have been focused on those actions likely to have the biggest impact on the child poverty targets.
The package of policies included in 'Best Start, Bright Futures' was informed by a cumulative impact assessment. Previously the policy package was estimated to contribute a 10 percentage point reduction in child poverty on both the relative and absolute measures, resulting in a relative poverty rate of around 17% and an absolute poverty rate of 16% in 2023-24.
Updated modelling, based on measures announced to date and included within the delivery plan, estimates that child poverty is expected to be 9 percentage points lower on both measures as a result of the policy package in 2023-24. Due in large part to the deterioration in the macroeconomic situation, this now means that around 19% of children could be living in relative poverty and 16% of children could be living in absolute poverty in 2023-24.
Both sets of results are subject to a degree of uncertainty as is the case with any economic modelling.
Economic modelling can provide us with an indication of the impact policies may have on child poverty but we cannot precisely account for what may or may not happen, particularly in light of recent macroeconomic volatility. As noted in 'Best Start, Bright Futures', the modelled policy package is not exhaustive due to limitations of what can be included.
The current cost of living crisis poses a challenge to progress against both the interim and final targets, at least until increases in wages and benefit rates offset the current high inflation rates. This issue is particularly relevant for the absolute poverty and material deprivation targets. The absolute poverty line is uprated each year for inflation. This means that increases in the cost of living will have a direct impact on absolute child poverty rates, if household incomes do not increase at the same rate. It is also likely that families will report higher levels of material deprivation while inflation rates remain high – particularly for essential items like energy and food which are currently driving high inflation. On the other hand, relative poverty (and therefore persistent poverty) is not directly adjusted for the cost of living. This underscores the importance of having four targets of child poverty and using a basket of indicators to track progress.
Local action
Local Child Poverty Action Reports are jointly developed by local authorities and Territorial Health Boards to outline activities and commitments to reducing child poverty in local areas. A recently published report summarised evidence from 16 reports covering the period April 2021 to March 2022. The thematic report analysis showed that:
- Collaboration was a key feature across most local areas at different levels of governance and between different partners and agencies. This ranged from inter-departmental collaboration on a single service to collaboration between sectors and between local authorities on the governance level.
- The national mission and actions set out in the delivery plans have cut through well with local authorities and health boards in their child poverty reduction efforts.
- Data collection was widespread and used most often to describe poverty within local areas. However, data and evidence was used less effectively in a strategic context, that is to inform planning and delivery processes. For example, there was less evidence of local areas using information on what works (and does not work) to inform actions to address local priorities.
- The reports are not very clear as to how local interventions are being targeted. Sometimes, local areas used the six priority family lenses as a way of ensuring that their actions did reach those most at risk of poverty. Where targeting did occur the ways this was approached differed between areas and depended on the type of action taken. In many cases, local authorities and health boards developed their own localised targeting strategies, which focused on groups outside of the six priority family types based on their own assessments of local need.
Contact
Email: tcpu@gov.scot