Publication - Statistics
Suspected drug deaths in Scotland: October to December 2023
This quarterly report presents Police Scotland management information to provide an indication of current trends in suspected drug deaths in Scotland.
3. Main points
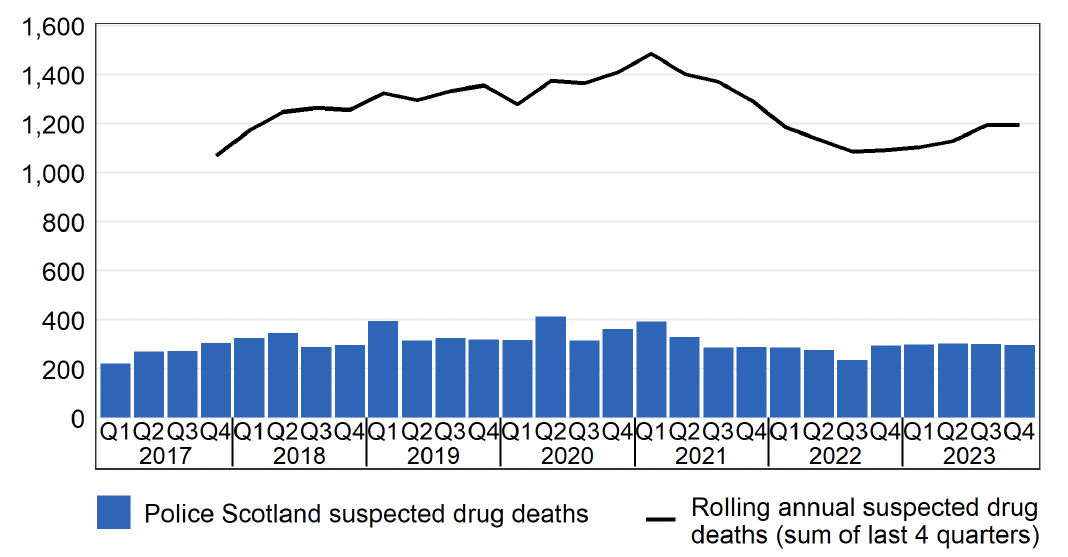
Note: Q1 is January to March, Q2 is April to June, etc
Source: Police Scotland
During 2023:
- There were 1,197 suspected drug deaths, 10% (105) more than during 2022.
- There were 875 suspected drug deaths of males (73%). This is an increase of 14% (108) compared to 2022, when there were 767 such deaths.
- There were 322 suspected drug deaths of females (27%), a decrease of 1% (3) compared to 2022 when there were 325 such deaths.
- A majority (66%) of suspected drug deaths were of people aged between 35 and 54. This is broadly in line with previous periods.
- There were 54 suspected drug deaths in the under 25 age group (5%). This is 2% (1) fewer than in 2022 when there were 55 such deaths.
- The Police Divisions with the greatest number of suspected drug deaths were: Greater Glasgow (303), Lanarkshire (147) and Edinburgh City (118).
For quarter 4, October to December 2023:
- There were 297 suspected drug deaths recorded, 1% (3) fewer than between July to September 2023 (300), and 1% (2) more than the same calendar quarter in the previous year (October to December 2022; 295).
Note that numbers of suspected drug deaths fluctuate from quarter to quarter. Care should be taken not to interpret movements between individual calendar quarters as indicative of any long term trend.
More detail on the statistics presented above is available in the workbook presented alongside this report.
Contact
Email: HSCAnalysisHub@gov.scot