Offshore wind developments assessment - seabird collision risk, displacement and barrier effects: study
This project developed a new framework to enable the assessment of collision, displacement and barrier effects on seabirds from offshore renewable developments to be integrated into a single overall assessment of combined impacts.
5 A framework for integrated modelling of displacement and collision
To simultaneously quantify the impacts of displacement, barrier and collision effects we propose using an individual-based mechanistic model of seabird movement, behaviour, demographics and OWF interactions. This approach avoids the possibility of double counting, helps to ensure that the outputs of these processes are quantified in directly comparable ways, and provides a framework that could be refined to allow for direct interactions between collision-related, displacement-related and barrier-related processes.
As SeabORD already provides an individual-level mechanistic model of seabirds and seabird-OWF interactions, as shown in Figure 1., we have developed an integrated model of collision and displacement and barrier effects by integrating the sCRM calculations within the SeabORD model. This approach involves translating the current population-level sCRM calculations into corresponding calculations at the individual level, and then embedding these within SeabORD.
In this initial project we have extended SeabORD so that it can incorporate collision risk using the outputs produced by the existing sCRM. However, ultimately a more powerful and flexible approach could be obtained by merging the functionality of SeabORD and the sCRM into a single model and software product that would apply to species at risk from both sources of impact. For other species not at risk from both collisions and displacement/barrier effects separate approaches will be needed.
5.1 Integrated modelling of displacement and collision – initial approach
The approach to integrating displacement and collision risk calculations we have developed within this project involves extending SeabORD so that it incorporates collision-related, as well as displacement-related, mortality, but doing this in such a way that the inputs to the collision-related part of the extended SeabORD model can be derived using outputs from the existing sCRM.
5.2 Extending SeabORD
SeabORD already simulates the amount of time in hours, T, that each adult breeding bird, within each simulation run, will spend foraging and flying within the OWF footprint on each day, when an OWF is present. A proportion of birds within the population, D, are assumed to be "displacement-susceptible", and for these birds the amount of time spent within the OWF footprint, once the OWF is present, will always be zero; for the remaining birds, the amount of time spent in the OWF footprint after construction of the OWF is assumed to be identical to that which would have been obtained in the "baseline" (i.e. if no OWF were present).
We have extended SeabORD by allowing users to specify whether collision-related mortality should be considered, or not. If users opt not to consider collision-related mortality, SeabORD will operate as in the current version (Marine Scotland (MS) Fate of Displaced Birds project, Searle et al., 2018). If users opt to include collision-related mortality, the model assumes that each bird has a probability p(T) of dying due to collision on each day, which will depend on amount of time T the bird spends undertaking collision-related behaviours (foraging, flying) on the day in question. Whether or not a bird actually dies, on any particular day, is decided by simulating a binary variable (1 = die, 0 = survive) from a binomial distribution with sample Size 1 and probability p(T). If a bird is simulated to die, the chick associated with the bird is also assumed to die, and the partner of the bird is assumed to no longer be required to attend the nest.
The daily probability of collision-related mortality, p(T), is assumed to be equal to:
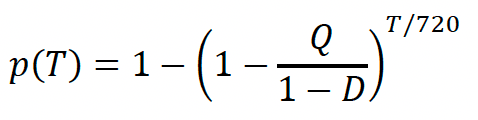
where Q represents the collision probability per bird-month and D represents the proportion of displacement-susceptible individuals within the population (an input to SeabORD). The derivation of this formula is given in Appendix B.
This implies that p(T) increases with time spent in the footprint, with individual birds accumulating risk as they utilise the habitat within the OWF. However, to note that SeabORD does not currently operate at the scale of individual turbines, birds simply interact with each OWF footprint as a whole, meaning any displacement behaviour within the OWF footprint, nor the potential influence of turbine density on displacement rates is captured by the model. Similarly, turbine density is not relevant to current versions of the sCRM – this model calculates collision risk for a single turbine, then multiplies by the number of turbines in the footprint regardless of turbine space. Turbine density could have an impact on displacement rates, but this has not currently been applied in assessment frameworks.
We define the collision probability per bird-month, Q, to be:
"The probability that a single bird would die through collision for every month [720 hours] that it spends within the OWF footprint in the baseline."
Although this seems a rather difficult quantity to interpret, it is a crucial quantity, because it represents a way of converting the current sCRM output into a format that can be used to quantify collision risk within an individual-based mechanistic model.
The value of Q can be calculated from the current sCRM, for each month within the chick-rearing period, by either:
a) dividing the number of mortalities within the sCRM output by (bird density * footprint area); or, equivalently,
b) running the sCRM with a bird density equal to (1 / footprint area).
This step is needed because SeabORD performs calculations for each individual separately, and it is therefore necessary to transform the sCRM output so that it relates to an individual bird, rather than the population; this is achieved by scaling the sCRM output by the mean number of birds within the footprint (which is, in turn, equal to bird density * footprint area).
These values are then averaged across the months of the sCRM, and the resulting values are inputted to SeabORD. Separate values need to be provided by users for each OWF footprint included within SeabORD simulations. Note that the averaging across months implies that the collision rate is assumed to be identical for all months within the chick rearing period, and is necessary in this implementation because it is assumed that collision risk does not vary over the chick-rearing period in this version of SeabORD.
The sCRM produces multiple simulations of mortality, representing uncertainty and variability, with a large number of simulations (1000) typically being used. SeabORD also uses multiple simulations to represent uncertainty, but as SeabORD is highly computer intensive to run, the number of simulations is much lower, and in this initial project we have used ten simulations. Users may, therefore, specify that SeabORD selects up to ten values of Q for each OWF footprint; these values are derived within the model by randomly selecting ten values from the sCRM output for each footprint, which is uploaded to SeabORD at the start of a simulation.
5.2.1 Case study for integrating sCRM outputs within SeabORD: Black-legged kittiwakes from the Forth Islands SPA
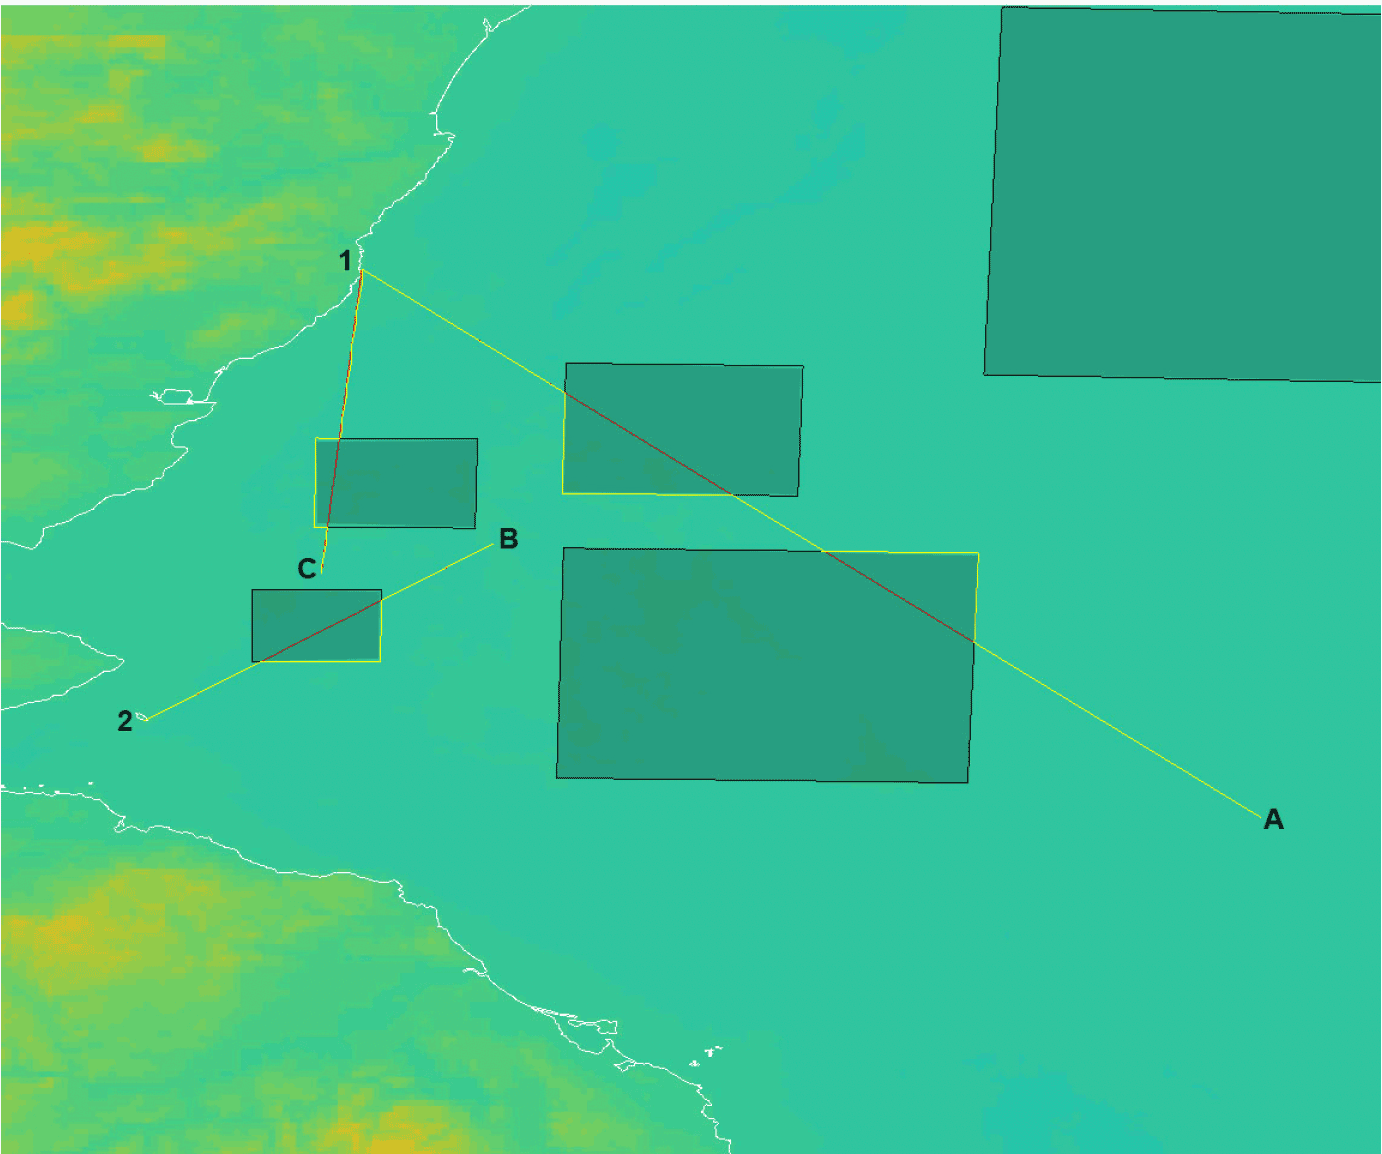
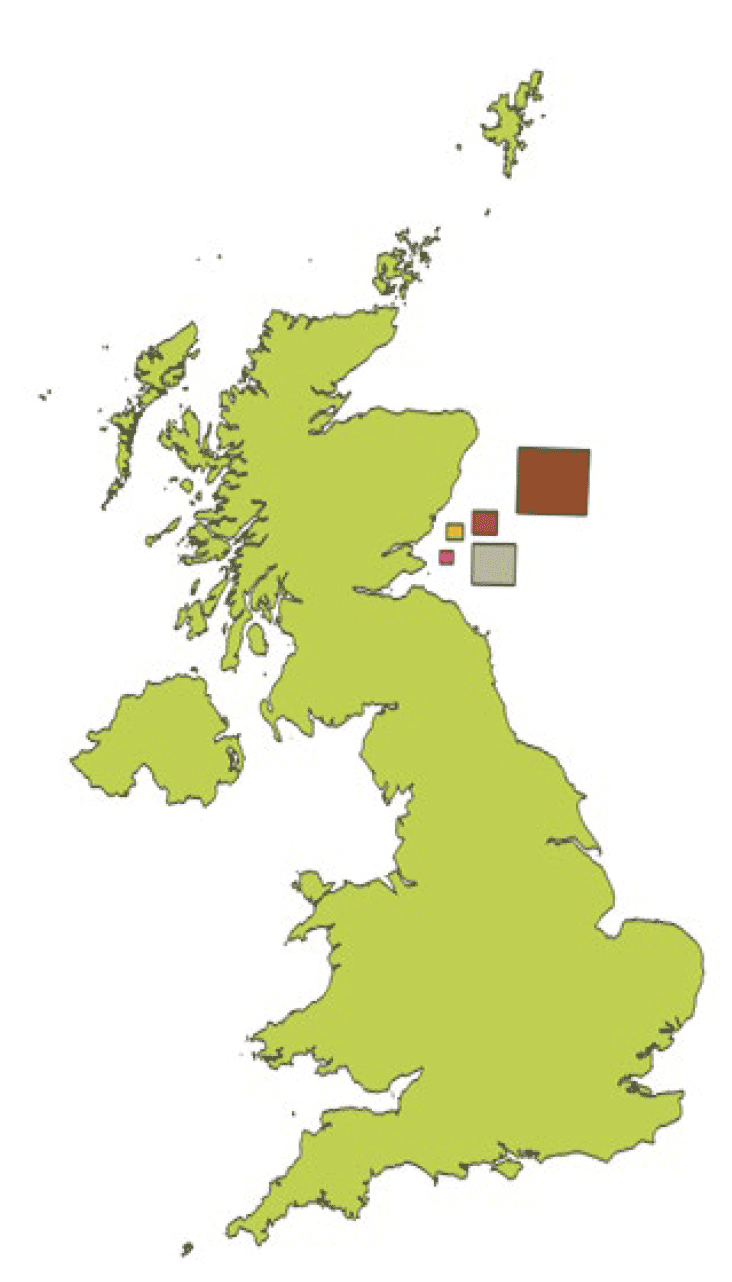
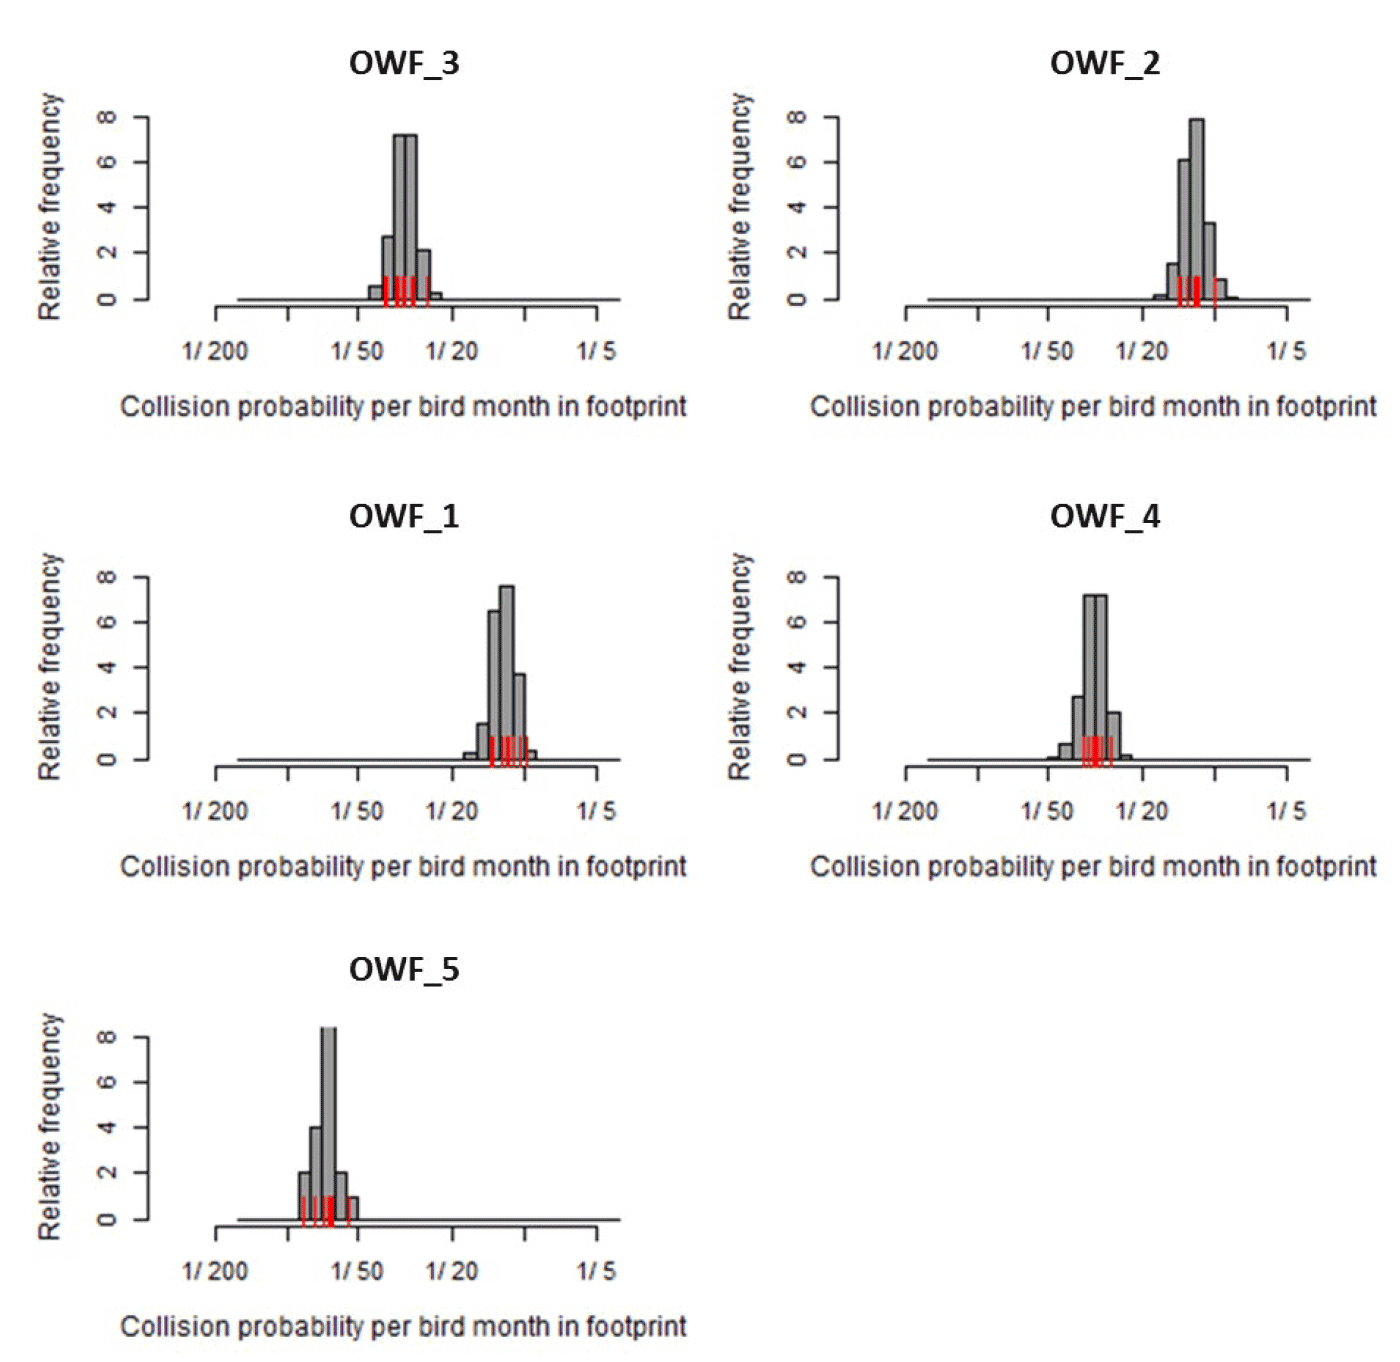
We demonstrate the integration of sCRM output with the individual based simulation model, SeabORD, by running the models using data for black-legged kittiwakes at the Forth Islands SPA. We used the same data and model outputs for the sCRM as were generated in the MS 'SEANSE' project (Searle et al, 2019). In the MS SEANSE project, five notional OWFs were assessed in terms of collision risk using a stochastic implementation of the Band (2012) collision risk model (M. Trinder, MacArthur Green) with bird densities generated from local GPS tracking data (Figure 2). These provided a set of simulated collision risk estimates for each of the five notional OWF footprints, from which ten values were selected to use within the SeabORD model to combine with displacement and barrier effects
(Table 2, Figure 3).
The rates used within the SEANSE project varied across species in terms of the displacement rate used in both SeabORD and the matrix approach, and the mortality rate of displaced birds (matrix approach only) (Table 1).
| OWF | Number of turbines | Density of turbines | Random samples from sCRM output | ||||||||||
|---|---|---|---|---|---|---|---|---|---|---|---|---|---|
| mean | 1 | 2 | 3 | 4 | 5 | 6 | 7 | 8 | 9 | 10 | |||
| OWF_3 | 64 | 0.13 | 0.032 | 0.033 | 0.031 | 0.026 | 0.035 | 0.026 | 0.029 | 0.031 | 0.031 | 0.039 | 0.029 |
| OWF_2 | 64 | 0.52 | 0.082 | 0.071 | 0.101 | 0.086 | 0.086 | 0.086 | 0.082 | 0.077 | 0.072 | 0.084 | 0.077 |
| OWF_1 | 35 | 0.45 | 0.082 | 0.074 | 0.09 | 0.095 | 0.084 | 0.084 | 0.103 | 0.084 | 0.072 | 0.081 | 0.087 |
| OWF_4 | 235 | 0.19 | 0.031 | 0.036 | 0.03 | 0.037 | 0.028 | 0.031 | 0.032 | 0.036 | 0.034 | 0.034 | 0.032 |
| OWF_5 | 300 | 0.06 | 0.015 | 0.018 | 0.015 | 0.012 | 0.016 | 0.016 | 0.013 | 0.015 | 0.015 | 0.014 | 0.016 |
| Species | Displacement rate | Mortality rate of displaced birds | Season for assessments |
|---|---|---|---|
| Atlantic puffin | 60% | 2% | Breeding |
| Common guillemot | 60% | 1% | Breeding and non-breeding |
| Razorbill | 60% | 1% | Breeding and non-breeding |
| Black-legged kittiwake | 30% | 2% | Breeding |
| Gannet | 80% | 0.5% (B) 0.25% (NB) | Breeding and non-breeding |
Results and conclusions
We integrated collision risk probabilities into the individual-based model, SeabORD, using parameter settings and inputs from the MS SEANSE project (Searle et al, 2019). This set up SeabORD to simulate black-legged kittiwakes from the Forth Islands SPA during chick-rearing, with the potential for interactions with five notional OWFs (note that birds from other Forth-Tay colonies were also included in model runs to account for inter-colony competition – St Abbs Head, Buchan Ness and Fowlsheugh. SeabORD was modified to keep track of the time spent by individuals within each of the notional OWFs, based on flight lines, flight speed, and foraging times (Figure 1). Only 30% of each SPA population was included in the simulations to reduce processing time.
SeabORD determined collision risk based on output from the sCRM and the cumulative time each individual spent within an OWF footprint on each day of the simulation. For illustration, the table below (Table 3) shows, for each SPA, summary information for the number of individual birds that were exposed to some collision risk (by spending time within one or more footprints) on 0, 1, 2, or more days ('Days with a collision risk') during the model run for an entire chick-rearing period (note that zero days means the individual never entered an OWF). This shows that in this model run, 460 individuals from Fowlsheugh SPA were exposed to collision risk on 10 days during the chick-rearing period (value highlighted in red in Table 3). In all, 4689 individuals from Buchan Ness to Collieston Coast SPA (hereafter Buchan Ness) were exposed to collision risk on at least one day, followed by 4089 individuals from Fowlsheugh SPA, 2953 individuals from St Abb's Head to Fast Castle SPA (hereafter St Abb's Head), and 1962 individuals from Forth Islands SPA (Table 3). Across all four SPAs, 13,693 individual black-legged kittiwakes were simulated to experience collision risk on at least one day during the chick-rearing period. Note that these numbers are based on simulations with only 30% of each SPA breeding population included, such that values for the full SPA population would be greater.
| Days with a collision risk (out of 30) | Buchan Ness | Fowlsheugh | Forth Islands | St Abb's Head | Total |
|---|---|---|---|---|---|
| 0 | 2201 | 1705 | 836 | 1255 | 5997 |
| 1 | 467 | 2 | 2 | 471 | |
| 2 | 883 | 1 | 884 | ||
| 3 | 1090 | 5 | 4 | 1099 | |
| 4 | 973 | 8 | 1 | 7 | 989 |
| 5 | 695 | 16 | 30 | 741 | |
| 6 | 351 | 67 | 3 | 75 | 496 |
| 7 | 152 | 101 | 6 | 148 | 407 |
| 8 | 58 | 238 | 29 | 267 | 592 |
| 9 | 15 | 339 | 49 | 383 | 786 |
| 10 | 4 | 460* | 99 | 449 | 1012 |
| 11 | 1 | 573 | 145 | 427 | 1146 |
| 12 | 582 | 215 | 388 | 1185 | |
| 13 | 502 | 269 | 334 | 1105 | |
| 14 | 454 | 311 | 202 | 967 | |
| 15 | 336 | 252 | 126 | 714 | |
| 16 | 196 | 228 | 60 | 484 | |
| 17 | 125 | 156 | 22 | 303 | |
| 18 | 47 | 102 | 23 | 172 | |
| 19 | 30 | 47 | 5 | 82 | |
| 20 | 8 | 35 | 43 | ||
| 21 | 9 | 9 | |||
| 22 | 6 | 6 | |||
| Total with collision risk | 4689 | 4089 | 1962 | 2953 | 13693 |
As described above in the methods, the time birds spent in OWF footprints is combined with output from the sCRM to estimate the number of birds suffering mortality through collision. When averaged across ten simulations, this resulted in a mean of 43.5 total collisions across all four SPAs, with an average of 18.2 birds colliding from Fowlsheugh, 12.3 from St Abb's Head, 8.4 from Forth Islands, and 4.6 from Buchan Ness (Table 4). Across all SPAs, the notional OWF_4 resulted in the most collisions (16.9), followed by OWF_2 (9.7 collisions), OWF_3 (8.3 collisions), OWF_1 (5.7 collisions), and OWF_5 (2.9 collisions). Note that all these numbers were obtained from simulations with only 30% of each SPA population.
| OWF | Buchan Ness | Fowlsheugh | Forth Islands | St Abb's Head | Grand Total |
|---|---|---|---|---|---|
| OWF_3 | 1.0 | 4.6 | 1.5 | 1.2 | 8.3 |
| OWF_2 | 1.3 | 5.9 | 1.6 | 0.9 | 9.7 |
| OWF_1 | 0.2 | 2.1 | 2.3 | 1.1 | 5.7 |
| OWF_4 | 0.7 | 4.3 | 3.0 | 8.9 | 16.9 |
| OWF_5 | 1.4 | 1.3 | 0.2 | 2.9 | |
| (no collisions) | 6885.4 | 5775.8 | 2789.6 | 4195.7 | 19646.5 |
| Total collisions | 4.6 | 18.2 | 8.4 | 12.3 | 43.5 |
Finally, we combine the collision mortality with the mortality arising from displacement and barrier effects, to estimate the total combined additional mortality for Forth Islands black-legged kittiwakes (Table 5). We first compare the estimated additional mortality and reduction in productivity between the original SeabORD run (
Table 5); top row 'Displacement risk: original SeabORD') and an identical run using the new modified SeabORD, but without collision modelling turned on within the simulations (Table 5); second row 'Displacement risk: revised SeabORD'). The results show that the estimated impacts are very close, and only differ by a few decimal places, which is to be expected because the matching of stochastic events within the revised version of SeabORD is no longer the same as in the previous version, before collision was added (Table 5). Once collision was turned on (Table 5); last row 'Combined risk: revised SeabORD'), the estimated additional adult mortality increased by 0.134%, from 0.879% (95% CI: 0.153-1.606) with only displacement and barrier effects simulated, up to 1.112% (95% CI: 0.480-1.743) with both displacement, barrier and collision effects simulated (Table 5). Similarly, chick productivity reduced by an additional 0.515% when collision was included in the simulations, from 5.561% (95% CI: 0.326-10.797) with only displacement and barrier effects, to 6.076% (95% CI: 1.047-11.104) when collision was also included in model runs (Table 5).This combined estimate using the integrated model (last row, 'Combined risk: revised SeabORD') is broadly similar to the additive estimate of displacement and collision from separate models (fourth row, 'Combined risk: additive') calculated from separate models in the MS SEANSE project. When modelled separately in SEANSE, the combined additional adult mortality was estimated as 1.05%, compared to an increase in mortality of 1.11% using the integrated models used here (Table 5, rows 4 and 5). The risk from collision only (Table 5, 'Collision risk: sCRM') was approximately 0.19% additional mortality.
| Run | Model scenario | Additional mortality %, mean | Additional mortality %, SD | Additional mortality % lower confidence interval | Additional mortality % upper confidence interval | Productivity % reduction mean | Productivity % reduction SD | Productivity % reduction LCI | Productivity % reduction UCI |
|---|---|---|---|---|---|---|---|---|---|
| Displacement risk | Original SeabORD | 0.861 | 0.267 | 0.229 | 1.494 | 5.354 | 2.103 | 0.365 | 10.342 |
| Revised SeabORD | 0.879 | 0.306 | 0.153 | 1.606 | 5.561 | 2.207 | 0.326 | 10.797 | |
| Collision risk | sCRM | 0.186 | 0.010 | 0.168 | 0.205 | 0 | 0 | 0 | 0 |
| Combined risk | Additive | 1.047 | 0.267 | 0.523 | 1.571 | 5.354 | 2.103 | 0.365 | 10.342 |
| Revised SeabORD | 1.112 | 0.266 | 0.480 | 1.743 | 6.076 | 2.119 | 1.047 | 11.104 |
5.3 Integrating collision risk models with the Displacement Matrix approach: case study
The overall combined impact of collision and displacement on mortality is usually estimated in practice by using the displacement matrix approach to estimate displacement risk and the sCRM to estimate collision risk, and then summing the results together (an "additive" approach).
Aside from any limitations and caveats associated with estimating each of the constituent risks (displacement and collision) in this way – the limitations of the displacement matrix approach have been discussed extensively elsewhere (Searle et al, 2019) - there appear to be two main issues involved in combining the estimated mortalities from the two sources of risk in an additive way: a) the potential for double counting, and b) potential inconsistencies in the displacement/avoidance rates used in the calculations.
5.3.1 Potential for "double-counting" of mortalities
Concern has been expressed about the potential for 'double-counting' of mortalities arising from collision or displacement within assessments. This refers to a potential error whereby assessments count deaths of individual birds more than once, for instance assigning an individual to die from both displacement impacts and from collision, potentially resulting in an over-estimation of mortality impacts. Individual-based models that explicitly account for both possible causes of deaths - such as the new, revised version of SeabORD - circumvent this issue by explicitly modelling the behaviour of each bird at each point in time, and by removing birds from the simulation as soon as they have died.
Additive population-level approaches - e.g. calculating annual collision mortality using the sCRM and annual displacement mortality using the Displacement Matrix or original version of SeabORD and then summing these together – are, however, potentially susceptible to double counting. Unless OWF effects on mortality are extraordinarily large, however, simple probability calculations suggest that the rate of double counting is likely to be very low, relative to the estimated sizes of collision and displacement effects. If, for example, the annual probability of mortality due to displacement is 1% (i.e. 0.01) and that due to collision is 3% (i.e. 0.03) then, if collision and displacement occur independently, the probability of double counting will be 0.01 * 0.03 = 0.0003 = 0.03%. In this example the actual overall risk due to collision and mortality would therefore be 3.97%, whereas the assumed risk, if we ignored double counting and simply added the two sources of mortality, would be 4%.
In practice, displacement and collision are very unlikely to be independent – because birds that are susceptible to displacement cannot, by definition, be simultaneously susceptible to collision, we might expect negative dependence between the probability of collision and the probability of displacement, and this is likely to further reduce the rate of double counting. In the most extreme case, if birds were to remain either collision-susceptible or displacement-susceptible through the entire year or season (as SeabORD assumes, for example) then double counting would be impossible, and in that case it would be correct to simply sum the collision and displacement-related mortality rates.
5.3.2 Potential inconsistencies in avoidance and displacement rates
The displacement matrix approach and sCRM both require an input parameter that captures 'macro-avoidance' in some form – the percentage of birds seen in the footprint pre-construction that would be displaced entirely from the area and not enter the footprint post-construction. However, there are important inconsistencies in how these parameters are specified and used within the two modelling approaches, which potentially limit the defensibility of combining the outputs from these approaches to estimate the overall (combined) mortality rate associated with an OWF:
- The displacement rate in the matrix approach applies to all birds observed within an OWF footprint (in flight and on the water); whilst the avoidance rate in sCRM approaches is applied only to birds in flight
- The avoidance rate used in sCRM calculations encompasses three different scales of avoidance: micro, meso and macro. However, the displacement rate used within the matrix approach is intrinsically assumed to capture only macro-avoidance (birds not entering the OWF footprint at all). The extent to which these different rates can be compared ('macro' versus 'macro, meso and micro') is yet to be established. On the face of it, we might expect the avoidance rate used in sCRM models (macro, meso, micro) to be a higher percentage than the displacement rate used in the matrix approach (macro only) because it also accounts for birds that having entered the OWF, avoid individual turbines via meso- and micro-avoidance. It is also not currently possible to separate avoidance rates out into their three components (macro, meso and micro) for most seabird species, or indeed as a first step, into two components representing macro-avoidance versus 'micro- and meso-' avoidance.
- The avoidance rate used within sCRM models incorporates a correction to account for model error (e.g. in relation to how flux rate is estimated). However, as avoidance rates are estimated by comparing observed and predicted collision rates, there is a need to consider macro-avoidance separately. Macro-avoidance can be accounted for by adjusting density of birds within the wind farm area pre-construction by the proportion expected to not enter the wind farm once it is constructed. Consequently, the macro-avoidance rate can be used within displacement modelling approaches – the assumption is that macro-avoidance is the sum of displacement and barrier effects, and therefore appropriate for use within models that estimate both processes. However, this requires a separation of avoidance into at least two, potentially three components ('macro' and 'meso plus micro'; or 'macro', 'meso' and 'micro'), which is not currently available for most seabird species. It is also problematic that the avoidance rate used within sCRM models includes correction for multiple factors leading to discrepancies between calculated collision rates and actual collision rates, further complicating separation into different scales of displacement behaviour (Bowgen & Cook 2018).
To address these issues, the next step is to undertake research and model development to split the overall avoidance rate used in sCRM models into its critical components – macro-, meso- and micro-avoidance, or potentially as a first step, macro- and micro- + meso-avoidance). Displacement rates used within the matrix approach may then be specified to be equivalent to macro-avoidance. Because avoidance rates also include a 'correction factor' for other causes of differences between calculated and actual collision rates, the 'correction factor' element could be estimated only in relation to the micro- and meso-avoidance components of the sCRM model, meaning the macro-avoidance rate and the displacement rate would be directly equivalent. If this is the case, then the number of birds simulated to die from collision in the sCRM will not include displaced birds, and because the mortality rate used in the Matrix approach relates directly to displaced birds, the number of mortalities from each method may simply be summed to find the total mortality associated with both collision and displacement.
This will require interrogation of existing empirical data, or collection of new empirical data to facilitate better estimation of displacement (macro-avoidance) rates across the three scales for seabird species. It would also require some model development within the sCRM to split out the application of the correction factor such that it only affects meso- and micro-avoidance. Alternatively, refinements to sCRM models to better reflect observed collision rates would reduce the need for a correction factor to be applied, or would minimise its contribution to avoidance rates (Bowgen & Cook 2018).
Contact
Email: ScotMER@gov.scot