Offshore wind developments assessment - seabird collision risk, displacement and barrier effects: study
This project developed a new framework to enable the assessment of collision, displacement and barrier effects on seabirds from offshore renewable developments to be integrated into a single overall assessment of combined impacts.
4 Background: Collision risk modelling
Collision Risk Modelling is a multistage calculation that results in a predicted number of birds killed per month and per year by a proposed wind farm. The first stage calculates the activity of birds in the air within the proposed wind farm development footprint. This flight activity is calculated from the aerial density of birds (from site-based surveys of the proposed wind farm), the heights at which those birds fly (from either site-based survey information or from previously collated and analysed survey data from multiple wind farms across all seasons) and the number of hours per day (24 hour period) during which birds are thought to be active.
These data are used to calculate the number of transits of birds through the rotors of the proposed wind farm.
Bird transits =bird flux ×proportion at collision height
Bird flux is estimated from the aerial density of birds (i.e. those birds in flight), bird flight speed, bird daytime and night-time activity and the size of each turbine and the total number of turbines:
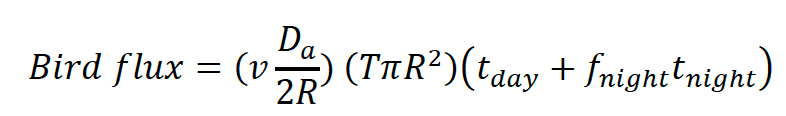
Where:
v - bird flight speed (ms-1)
Da - Bird density per unit area (birds/km2)
R - Rotor radius (m)
T - Number of turbines
tday - hours of daytime in each month
fnight - proportion of time at night when birds are active
tnight - hours of time at night in each month
Based on the relative size and speed of a bird in flight of a known size, and a turbine in motion of a known size, the probability of a bird being struck by a blade is calculated, termed the probability of collision ('p.coll').
The first step in this calculation is to determine the probability of collision of passage through any one point in the rotor. This probability of a bird being struck during a transit of a rotor is multiplied by the transits of birds through the rotor to estimate the number of birds predicted to be struck per month.
There are four model options that use different assumptions and data on the vertical distributions of birds in relation to the rotors of the turbines. These options are divided into two "basic" options and two "extended" options. The basic options (Option 1 and 2) assume that there is an equal probability of birds occurring at any point within the vertical range of the rotor of the turbine. These options use different data to determine the proportion of birds flying at rotor height. Option 1 uses site-based data collected during surveys of the proposed development area and a suitable buffer. Option 2 uses published information on the proportion of birds at collision risk height collated from multiple boat-based surveys of proposed OWFs around the UK (Johnston et al. 2014). The extended models do not make the assumption that seabirds will be equally distributed across all parts of the turbine rotor. Option 3 uses generic flight height distributions of seabirds (usually from Johnston et al. (2014)), where birds are predicted to be at greater densities in the lower part of the turbine rotor with densities declining with increasing height. Due to the relative size and speed of the turbine blades, collision risk varies across the rotor surface, generally being lower at the outer edge of the rotor, increasing towards the middle of the surface. Thus Option 3 tends to result in fewer predicted collisions than Option 2. Option 4 is identical to Option 3 but uses site-based flight height distribution information. To date Option 4 has only rarely been applied in OWF assessments in the UK; it has been used by developers in their applications, but has yet to be used in the final assessment figures – i.e. those used for the Appropriate Assessment by the Competent Authority (for Scotland: Scottish Ministers).
The predicted collisions are based on the density of birds in the air before the wind farm is constructed and do not account for the behaviour of birds in relation to the wind farm, the individual wind turbines and to the moving blades. Overall, these behaviours are assumed to be captured by an 'avoidance rate' parameter that is used to adjust the predicted collision from the model. The avoidance rate can be calculated by combining avoidance behaviour at three scales: macro-avoidance, meso-avoidance and micro-avoidance. The total avoidance rate is calculated by:
Total avoidance=1-(1-Macro) ×(1-Meso) ×(1-Micro)
Micro-avoidance has been defined as the last second change in flight path a bird takes to avoid being struck (Cook et al. 2014). Cook et al. (2014) considered this to occur within 10 m of the turbine blades. Those authors defined meso-avoidance as all the behavioural responses that occur more than 10 m from the turbine blades, but within the wind farm itself. However, in practice, meso- and micro-avoidance are typically combined as "within-windfarm avoidance" and calculated by comparing observed and predicted collision rates. As different model options will produce different predicted collision rates, the avoidance rates used must differ between model options. Macro-avoidance is the overall avoidance of the whole wind farm. It is important to note that macro-avoidance applies to birds in flight only, as it is used to adjust the predicted mortality of birds flying through the turbine rotors. Macro-avoidance therefore has similarities with displacement, but it is not identical. Displacement usually refers to both birds in flight and birds on the sea. There are greater similarities with barrier effects, where birds fly around the wind farm rather than through it.
Several versions of the Band model (2012) are generally available and used for predicting collision risk mortality to seabirds from OWFs, within the UK. A deterministic model was produced in 2012 by the Strategic Ornithological Support Services (SOSS) group, funded by The Crown Estate enabling actions fund (Band 2012). This is implemented in Microsoft Excel but is unable to incorporate uncertainty and variation in the input parameters to produce a prediction with associated confidence intervals. This was recently addressed in an update to the model created by Band (2012), funded by Marine Scotland, by adapting and updating an existing version of the CRM in R (Masden 2014). This stochastic collision risk model (sCRM) is able to incorporate uncertainty and variation in the input parameters to produce a predicted collision mortality with a variety of suitable measures of confidence (McGregor et al. 2018).
Contact
Email: ScotMER@gov.scot