Offshore wind developments assessment - seabird collision risk, displacement and barrier effects: study
This project developed a new framework to enable the assessment of collision, displacement and barrier effects on seabirds from offshore renewable developments to be integrated into a single overall assessment of combined impacts.
Appendix A
9.1 Summary of key mechanisms and assumptions within the SeabORD model
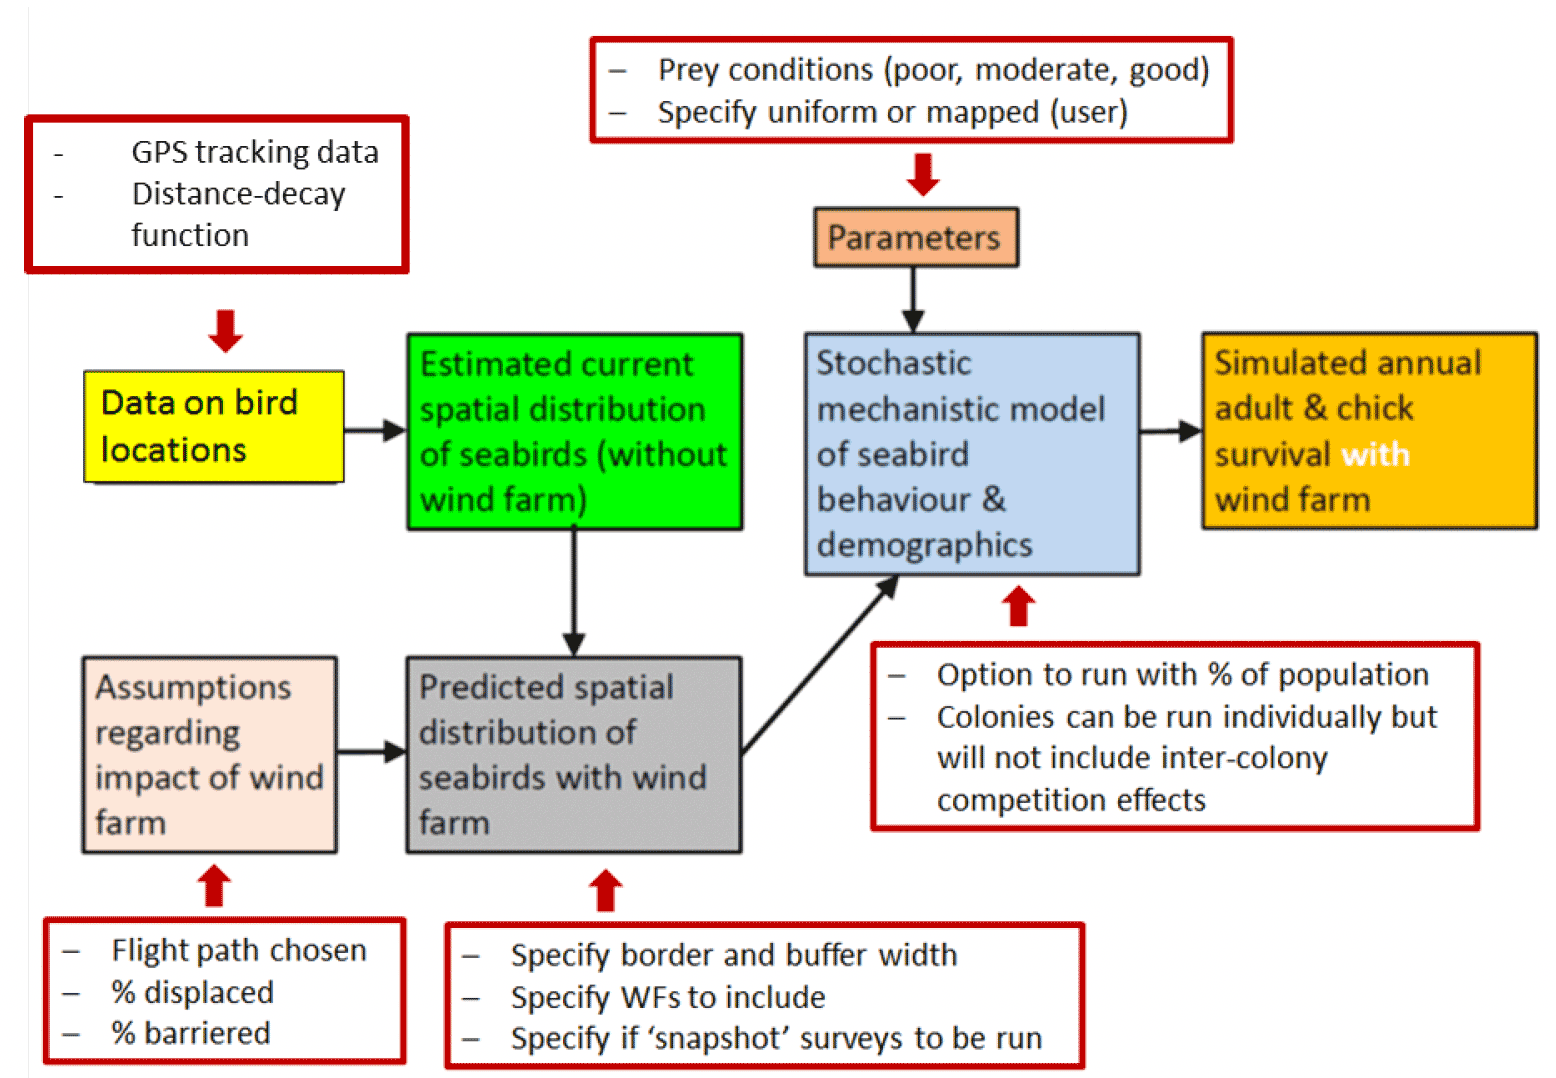
Here we summarise the key SeabORD model mechanisms, assumptions and their impact on demographic output for assessing effects of OWFs on breeding seabirds. The model can be condensed into a series of sub-models associated with different stages of simulation (Figure 4: e.g. estimating spatial distribution of birds, simulating foraging behaviour and provisioning, estimating survival from mass change of adults). The following is taken from the Marine Scotland 'Fate of Displaced Birds' project report (Searle et al. 2019).
The specific mechanisms within the model are based upon the best available evidence or expert opinion for how breeding seabirds are likely to behave in terms of time-activity budgets and specific behaviours relating to their own energy acquisition, provisioning of energy for chicks, and breeding behaviours such as attendance at nests. Below we summarise all of the main mechanisms within the model, listing their assumptions and stating the likely impact of each on subsequent model output for demographic parameters (Table 6).
| Process | Mechanism | Assumptions | Likely effect on demographic output |
|---|---|---|---|
| Bird Foraging locations: | |||
Local GPS maps |
Birds from each colony choose a foraging location in proportion to the intensity of usage estimated using a GAM model of GPS points. Importantly, there is no assumption that birds attempt to meet an ideal free distribution (IDF). The IDF has restrictive assumptions, including that birds have perfect information of resource supply and distribution of conspecifics, and that there are no constraints to patch choice. The first two assumptions are clearly unrealistic, and the third is likely to be violated when central place foraging occurs, as for breeding seabirds. Furthermore, the balance between competition and facilitation in foraging seabirds is not properly understood. Finally, several studies have shown that seabird and prey distribution seldom conform with IDF predictions (e.g. see Fauchald 2009). | Foraging locations are chosen independently at each simulated time step with no influence of site fidelity. The order of individuals choosing foraging locations is random at each time step so the likelihood of an individual choosing a location with high or low bird density is also random. The available GPS data provide an accurate and unbiased estimate of the underlying spatial distribution of foraging birds utilised by birds from the colonies of interest. |
Bird location influences demographic output through determining distance travelled, interspecific competition and potential encounter with OWFs (displacement and barrier effects). The relationship between the spatial distribution of birds and the impact of the OWF upon survival is potentially very complicated, so it is not straightforward to anticipate the likely sign or magnitude of effects that would arise from altering the spatial distribution. |
| Distance-decay | Intensity of usage declines exponentially with distance from colony according to pre-specified parameters by the model user. It is the responsibility of the user to best determine that simulated bird distributions match those expected in reality. Birds from each colony choose a foraging location in proportion to the predicted intensity of usage from the distance-decay algorithm. Importantly, there is no assumption that birds attempt to meet an ideal free distribution (IDF). The IDF has restrictive assumptions, including that birds have perfect information of resource supply and distribution of conspecifics, and that there are on constraints to patch choice. The first two assumptions are clearly unrealistic, and the third is likely to be violated when central place foraging occurs, as for breeding seabirds. Furthermore, the balance between competition and facilitation in foraging seabirds is not properly understood. Finally, several studies have shown that seabird and prey distribution seldom conform with IDF predictions (e.g. see Fauchald 2009). |
The spatial distribution of birds is unaffected by either environmental heterogeneity or competition. Foraging locations are chosen independently on each simulated time step with no influence of site fidelity. The order of individuals choosing foraging locations is random at each time step so the likelihood of an individual choosing a location with high or low bird density is also random. |
Bird location influences demographic output through determining distance travelled, interspecific competition and potential encounter with OWFs (displacement and barrier effects). |
| Prey availability | |||
| Median prey density | The user specifies a median prey density across cells in the region of interest which is used to specify the overall available prey density per grid cell in the model. | Adults protect their own survival to safeguard future reproduction (via a threshold in acceptable mass loss in relation to provisioning of chicks and abandoning the breeding attempt) over that of their chick's survival | This trade-off between current reproduction and future survival means that relative effects on adult survival and productivity will depend on prey level in complex ways. As prey levels decline, the effect will initially be stronger on adult survival as they safeguard current reproduction, but with further declines the effect on productivity will strengthen and those on adult survival stabilise as individuals abandon breeding. Yet further declines in prey levels are then likely to affect both demographic rates simultaneously. |
| Uniform spatial distribution of prey | Prey is uniform throughout the available foraging area | All locations have equal prey availability | Prey availability at each bird location influences demographic output through determining intake rates, and therefore the required time spent foraging to achieve a set energy requirement. Model output under uniform prey is likely to be less variable than that under prey derived from local GPS data because all birds encounter the same prey availability at their chosen foraging location. |
| Local GPS spatial distribution of prey | Prey is estimated from a GAM model of bird GPS locations assuming that once the accessibility (distance from source colony) and competition (distance from next nearest colony) effects are accounted for, the remaining spatial distribution in the intensity of usage is due to prey availability. | No knowledge of empirical prey distribution and density is assumed, prey is derived solely from bird locations. Locations far from the source colony with high densities of birds assume high prey availability. Foraging locations simulated by SeabORD are determined by bird densities (see above section) and are not related to prey directly (i.e. no assumption of Ideal Free Distribution) |
Prey availability at each bird location influences demographic output through determining intake rates, and therefore the required time spent foraging to achieve a set energy requirement. Model output under uniform prey is likely to be less variable than that under prey derived from local GPS data because all birds encounter the same prey availability at their chosen foraging location. |
| Displacement and barrier effects | |||
| Displacement effects | The user defines a proportion of the total population that are susceptible to displacement effects. Displacement susceptible birds are displaced from the OWF footprint (footprint + border) when their chosen foraging location lies within this region. Upon displacement, birds select a new foraging location within the buffer area around the OWF in proportion to the modelled bird density within the buffer area. It is assumed that birds fly straight to the new foraging location from the colony (i.e. they do not attempt to first fly to the displaced location). As a result birds may either incur additional flight costs due to the new location being on the far-side of the OWF (and due to barrier effects if the individual is also barrier-susceptible), or may have reduced flight costs because their new foraging location in located on the near-side of the OWF in relation to the source colony. | The user must set the displacement rate for each modelled species. This defines the proportion of the total population that are susceptible to displacement. Individual birds are randomly assigned to the displacement-susceptible category until this proportion is met at the population level. As a result all individuals in the displacement susceptible category will always seek a new foraging location in the OWF buffer zone when their chosen foraging location lies within the OWF footprint or border region. | Displacement effects can be both positive and negative in terms of their impact on demographic output. If a bird is displaced closer to the source colony it will have lower flight costs and shorter flight times, subsequently benefitting from displacement both energetically and in gaining more time for other activities (foraging or time at the nest). If a displaced bird is displaced into a part of the buffer zone where prey availability is higher (after taking into consideration the interference effects of other birds foraging at that location), it will benefit from a higher intake rate allowing it to more rapidly meet its energetic costs, therefore benefitting energetically and in gaining more time to devote to other activities (time at nest). If a displaced bird is displaced to a location further from the source colony it will incur increased flight costs and flight time, negatively affecting its energy budget and reducing the time available for other activities (foraging and time at nest). If a displaced bird is displaced into a part of the buffer zone where prey availability is lower (after taking into consideration the interference effects of other birds foraging at that location), it will suffer reduced intake rate, thereby negatively affecting it energetic budget through increased time spent foraging, potentially affecting its ability to meets its energetic requirements and devote time to attending its nest. |
| Barrier effects | Because the model assumes barrier-affected birds must also be displacement-susceptible (it is likely not plausible for a bird to not be prepared to fly within an OWF footprint, but to be prepared to forage within an OWF footprint) all barrier-affected birds are also assigned to the displacement-susceptible category. The proportion of the population in the barrier-affected category is set by the user when setting the barrier rate. This proportion may only be as great as the displacement rate proportion set above (because all barrier-affected birds must also be displacement-susceptible). Should a barrier-affected bird choose a foraging location obstructed by the OWF footprint it incurs additional flight costs determined by the barrier flightpath method ('perimeter' or 'A-star'). |
The user must set the barrier rate for each modelled species. This defines the proportion of the total population that are susceptible to barrier effects. Individual birds are randomly assigned to the barrier-affected category until this proportion is met at the population level. As a result all individuals in the barrier affected category will always fly around the OWF footprint + border zone when their straight-line path to the chosen foraging location is obstructed. | Barrier effects are negative, unless they cause a bird's chick to suffer mortality from unattendance or low provisioning as a result of its partner giving up the breeding attempt when an OWF is present, releasing both adults from restrictive central place foraging conditions resulting in the bird that did not reach the mass loss threshold losing less mass over the course of the breeding season. When a bird is obstructed by the OWF it incurs extra flight costs (energy and time) due to avoiding the OWF footprint + border. This will negatively affect the individual's energy budget and will reduce time available for other activities (foraging and time at nest). Some individuals may choose to reduce the number of foraging trips made per simulated time step to reduce the time costs associated with the extra flight distance. However, due to the optimisation procedure within the foraging component of the model, birds will never benefit from reducing the number of trips in relation to their time-energy budget in the paired baseline run within an OWF present. |
| Intake rate and number of trips | |||
| Intake rate | Intake rate is determined by prey availability at the bird's foraging location, whereby a Type II functional response returns the estimated intake rate after accounting for effects of interference competition arising from the number of additional birds also foraging at that location during the simulated time step. Prey depletion occurs, determined by the shape of the Type II functional response curve for each species. |
The effects of conspecifics foraging at the same location is assumed to create interference competition, reducing the intake rate of each forager in relation to the total number of other birds foraging at that location over the duration of the simulated time step. No facilitation by conspecifics is assumed to occur. Each individual experiences prey depletion whereby their intake rate drops with time spent foraging at a location, determined by the shape of the Type II functional response. Prey depletion occurs during each foraging trip, but prey is then replenished to the original level before any further foraging is undertaken. This means that each time a bird visits the same location within a simulated time step it is assumed that it encounters the same initial prey availability, and therefore experiences the same initial intake rate each time. |
Intake rate is strongly and directly related to provisioning of food to chicks, and changes to adult and chick body mass over the chick-rearing period. Higher intake rates (due to greater prey availability or the presence of very few conspecifics) result in birds being able to meet their energy requirements more quickly, thereby increasing the amount of time available for other activities (time at nest). |
| Number of trips | Birds optimise the number of foraging trips to make during each simulated time step based on the prey availability at their chosen foraging location and the associated flight time accrued travelling between the foraging location and the source colony. If birds are able to meet their required DER at the chosen foraging location they select the number of trips that minimises the total time requirement (foraging + flying) required to meet the DER. If birds are unable to meet their required DER at the chosen foraging location (because prey availability is sufficiently low that the realised intake rate does not allow the bird to reach its DER within the time available) then the bird selects the number of trips that leads to the greatest total prey intake by the bird (i.e. that which minimises their shortfall in intake relative to the DER). Bird state (adult mass) also plays a role in determining the number of trips when the adult's DER cannot be met. If the adult's mass is >90% of its initial mass at the onset of chick rearing, it will avoid non-attendance of its chick, and will select the number of trips that minimises its energy deficit. However, if an adult's mass is >80% but <90% of its initial mass, it will fail to attend its chick, and will therefore select the number of trips that either allows it to meet its DER within the simulated time step (by increasing foraging time and unattending its chick), or that which minimises its energy deficit (by increasing foraging time and unattending its chick – although still not having sufficient time in the time step to meet its DER). |
The mechanisms underlying the selection of the number of trips to make per simulated time step assume that birds attempt to meet their DER within the shortest amount of time, thereby maximising nest attendance. If birds are unable to do meet their DER, the model assumes that they select the number of trips which minimises the energy deficit (i.e. the difference between DER and daily energy intake) |
The model selected number of trips affects demographics by determining the time-energy budgets of each adult bird, and therefore its change in mass per simulated time step, and the change in mass of its chick. The 90% adult mass threshold that triggers a shift in behaviour when selecting the optimum number of trips to allow unattendance of chicks has a strong and direct impact on chick survival. Raising this threshold would increase unattendance and subsequent chick mortality, but would also allow adults the opportunity to better protect their own survival by minimising mass loss through additional energy gained by unattending chicks; lowering it would have the reverse effect. |
| Allocation between adult and chick | |||
| Daily Energetic Requirements and provisioning | If an adult successfully collects all the food it needs (its DER plus half its chick's DER) then it provides exactly one half of what the chick needs to the chick during the simulated time step. If an adult is not able to collect enough food to satisfy its own DER plus half of its chick's DER then the intake of both chick and adult will be reduced so that each reach the same percentage of their energy requirements. If a bird is only simulated to receive 50% of the total energy needs for itself and (half of) the chick at a particular time step, for example, then the adult will receive only 50% of its DER, and the chick will receive 50% of one half of their DER (the other parent may still be able to provide 100% of its contribution to the chick's DER, it which case the chick would actually receive 75% of its total DER that time step, but this will not always be the case). |
Adults do not take in to account the state (body mass or age) of their chick when deciding how to adjust their time-energy budgets to best meet energetic requirements and successful rearing of their chick. Adults do not account for the provisioning or unattendance of their partner when making decisions regarding time-energy budgets to best meet their own energetic requirements and successful rearing of their chick. Nor do adults take into account the provisioning of their chick by their mate when determining how much food to collect, therefore there is no compensation within a pair where one adult can acquire more food for the chick to compensate for its mate not being able to collect enough food. |
The acquisition of DER and subsequent provisioning to chicks directly affects both the mass change of adults and chicks, and therefore their subsequent survival. The lack of compensation between adults in a breeding pair means that any deficit in DER for the chick arising from one parent failing to capture enough food cannot be mitigated by the other parent, should that parent have additional time available for foraging (after all other activities, including attendance at nest). This means the effect of an OWF on the foraging of one parent cannot be compensated for by the other parent, increasing the negative impact of an OWF upon chick survival over a model where such compensation is allowed to occur. It would be possible to change this mechanism within the model so that, for instance, the adult always attempts to provide 100% of one half of the chick's DER before provisioning itself. However, due to the lack of empirical data on which to parameterise this process, the division of acquired energy is simply split equally between the parent and the chick. |
| Bird states and consequences | |||
| Unattendance and abandonment of breeding attempt | When an adult's body mass is greater than 90% of its starting body mass at the onset of chick-rearing (based on empirical data) it will avoid unattending its chick, even if it had not met its DER during the simulated time step. If an adult's body mass is between 90% and 80% of its initial mass it will favour its own needs over those of its chick, and will leave its chick unattended in order to achieve its required DER. Adults with a body mass of less than 80% of their starting mass abandon the breeding attempt. This necessarily means that their partner also gives up the breeding attempt, resulting in chick death. Finally, if an adult's body mass falls below that deemed critical for survival (60% of its initial body mass at the onset of chick-rearing), the adult is assumed to have died and is removed from the simulation. This causes its partner to abandon the breeding attempt for the remainder of the simulation. |
Adults do not take in to account the state (body mass or age) of their chick when deciding how to adjust their time-energy budgets to best meet energetic requirements and successful rearing of their chick. Adults do not account for the provisioning or unattendance of their partner when making decisions regarding time-energy budgets to best meet their own energetic requirements and successful rearing of their chick. The model assumes adults will prioritise their own survival (by protecting their energy gain and minimising mass loss over the chick-rearing period) over that of their chick. However, the model also assumes that adults avoid unattendance when their mass is still reasonably high (>90%) in comparison to their starting mass at the onset of chick-rearing. |
The rules governing unattendance and abandonment of the breeding attempt have a strong and direct impact on chick survival, as well as on energy acquisition by adults and consequently their body condition and survival prospects. The effect of unattendance is to increase the risk of chick death through exposure or predation. The risk of chick death increases linearly with time unattended, until reaching a certainty after 18 consecutive hours of unattendance. Both the thresholds for mortality from unattendance (18 hours) and abandonment of the breeding attempt (adult body mass <80% of initial mass at onset of chick-rearing) has a strong impact on demographic output from the model. Raising the unattendance threshold (e.g. from 18 hours to 24 hours) would decrease overall chick mortality, and would lower the impact of an OWF on chick mortality as fewer chicks would die from a result of unattendance. A similar effect would be seen on model output if the adult mass threshold for abandonment (<80% of initial mass) were lowered. |
| Chick death | Chick death occurs when the chick's mass reaches 60% of that of an idealised chick provided with its total DER on each time step of the simulation up to the current point in time. | The model assumes that chick's DER do not change with age or body mass. | Varying the mass threshold (60% of idealised chick's body mass) at which mortality occurs has a direct and strong impact on chick survival of the population. A lower threshold would reduce the impact of an OWF on chick survival because chicks would be able to buffer a greater reduction in provisioning (and therefore mass loss) before dying. Chick death is also linked to adult body condition and survival prospects because of behavioural changes that occur to adult foraging when freed from provisioning for offspring. |
| Mass Change | |||
| Adults | Adult birds update their body mass at the end of every simulated time step in response to the balance between the energy expended and gained during the time step. When the bird's DER is met, it loses no mass. When the bird's DER is not met, it loses body mass according to a linear relationship with the ratio of the energy deficit to the energy density of the bird's tissue (parameter value set a priori). The upper limit to adult mass loss is set by this ratio between the energy deficit and the energy density of tissue. |
The model assumes adults may only remain at the same weight as they enter the chick-rearing period, or lose mass over the chick-rearing period – it is assumed to be impossible for them to gain weight | Adult mass loss over the chick-rearing period determines both its own subsequent survival, as well as affecting its behavioural decisions affecting the survival of its chick through provisioning and unattendance. |
| Chicks | The model assumes a simple linear function for daily mass change of chicks in relation to food provisioned by its parents. If a chick receives its total DER from its parents its mass changes by the maximum possible mass gain (g/day; parameter value set a priori). If a chick receives only a proportion of its total DER, its increase in mass declines linearly with the decrease in total DER provided by its parents. The model contains a threshold parameter (set a priori) that represents the proportion of the chick's DER provided at which zero growth occurs. |
The model assumes chicks may not lose mass during the model simulation, however if insufficient energy is provided by its parents it will fail to gain mass at the rate required to maintain good health, and eventually die from starvation. | Mass change in chicks is strongly and directly related to provisioning of food to chicks, and is the ultimate determinant of chick survival over the chick-rearing period and, therefore, the chick survival of its parents. Chick death is also linked to adult body condition and survival prospects because of behavioural changes that occur to adult foraging when freed from provisioning for offspring. |
| Mass-Survival relationship | |||
| Converting adult mass at end of chick-rearing into subsequent survival | For each individual adult bird the model assumes a logistic relationship between the adult mass at the end of the breeding season and the probability of over-winter survival. The logistic model contains two unknown parameter values: in the way we have parameterized the models these parameters quantify (a) the "baseline" survival and (b) the slope associated with the impact of a change in adult mass upon the change in logit(survival probability). |
The model assumes: a) that the shape of the relationship between adult-mass and over-winter survival can be described by a logistic curve; b) that the baseline survival probability has been specified correctly; and c) that the mass-survival slope parameter has been specified correctly. The value of the baseline survival probability is fixed to be the mean value across sites with observed data on annual adult survival. |
The impact of OWFs upon adult survival will be directly related to the value of the slope parameter – the two quantifies are related in a strong but nonlinear way. The value of the baseline survival probability is also likely to be moderately strongly linked to OWF effects; the nonlinearity of the logistic curve means the impacts of the slope parameter vary depending on the level of baseline survival. The estimates of OWF effects are not likely to be strongly related to the assumption that the curve has a logistic shape. |
Contact
Email: ScotMER@gov.scot