Publication - Research and analysis
State of the economy: September 2020
This report summarises recent developments in the global, UK and Scottish economies and provides an analysis of the performance of, and outlook for, the Scottish economy.
United Kingdom Summary
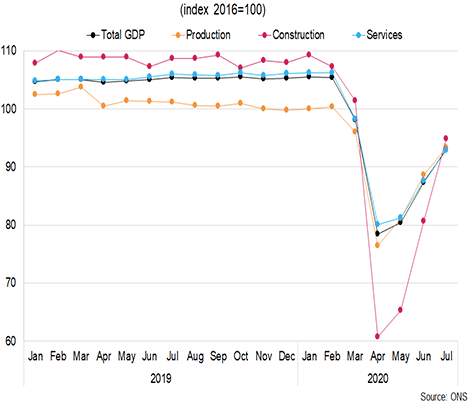
- In the first half of 2020, the UK GDP contracted by 22.1%, with a 2.2% contraction in Q1 and a 20.4% fall in Q2.
- The falls were broad-based across the sectors.
- More recent monthly data showed that GDP grew by 6.6% in July, following growth in June (+8.7%) and May (+2.4%) and its record fall in April 2020 (-20%).
- However GDP levels remain 11.7% below pre-COVID levels.
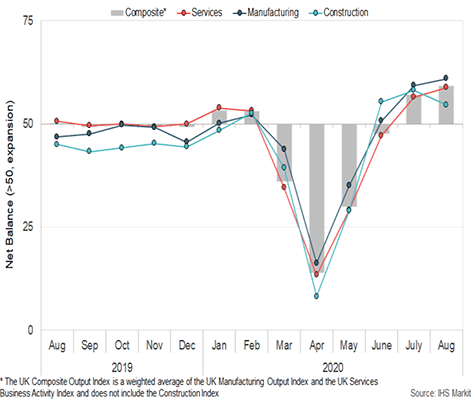
As lockdown eased, business activity started to recover.
- UK PMI business survey data for August showed a further increase in business activity as more businesses reopened and (domestic) demand strengthened.
- The pick-up in activity was seen across the Services, Manufacturing and Construction sectors, though export orders continue to recover at a slower pace than domestic.
UK saw the sharpest increase in redundancies since 2009.
- In May to July 2020, the UK employment rate rose to 76.5% and the unemployment rate increased to 4.1%, due to a fall in the inactivity rate which fell to 20.2%.
- However, UK redundancies increased by 48,000 in the three months to May to July, its sharpest increase since 2009.
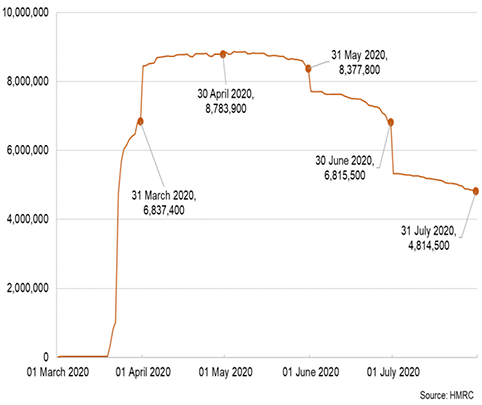
- HMRC data suggest an estimated 16% of UK employments were partially or fully furloughed at the end of July.
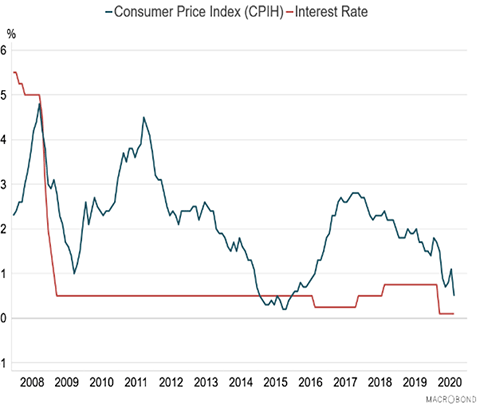
Inflation fell significantly in August.
- CPI inflation fell to 0.5% in August 2020 – its lowest rate since December 2015 - down from 1.1% in July 2020.
- The slowdown in August was mainly driven by the fall in restaurant/cafe prices due to the Eat Out to Help Out scheme.
Risks to the outlook remain skewed to the downside.
- The Bank of England forecast UK GDP to fall 9.5% in 2020 and gradually recover to pre-Covid levels at the end of 2021, while unemployment is expected to rise to 7.5% in 2020 before gradually declining.
Contact
Email: OCEABusiness@gov.scot