
Marine Protected Areas and priority marine features management in Scottish waters: social impacts research
This research informs the SEIA by improving understanding of the social values of coastal and island communities and how proposed marine management measures may affect them. It identifies community perceptions, potential social impacts, and key issues and concerns.
Appendix 5.0 Socio-Economic Indicators
Table 6 and Table 7 presented below are using information from the Scottish Index of Multiple Deprivations (SIMD) for the engagement areas, per Council Area and per Town/Location, respectively. SIMD is a relative measure of scarcity across 6,976 small areas (called data zones). If an area that is identified as ‘deprived’, it means having fewer resources or opportunities. SIMD looks at the extent to which an area is deprived across seven socio-economic domains: income, employment, education, health, access to services, crime and housing. SIMD is the Scottish Government's standard approach to identify areas in need of support and aims to allow targeting of policies and funding. It seeks to improve understanding about the outcomes and circumstances of people living in an area. SIMD ranks data zones from most deprived (ranked 1) to least deprived (ranked 6,976). SIMD supply information per data zone, and not per council or town, in order to identify small pockets of deprivation and to reflect how people are experiencing different levels of deprivation within the same municipality.[49]
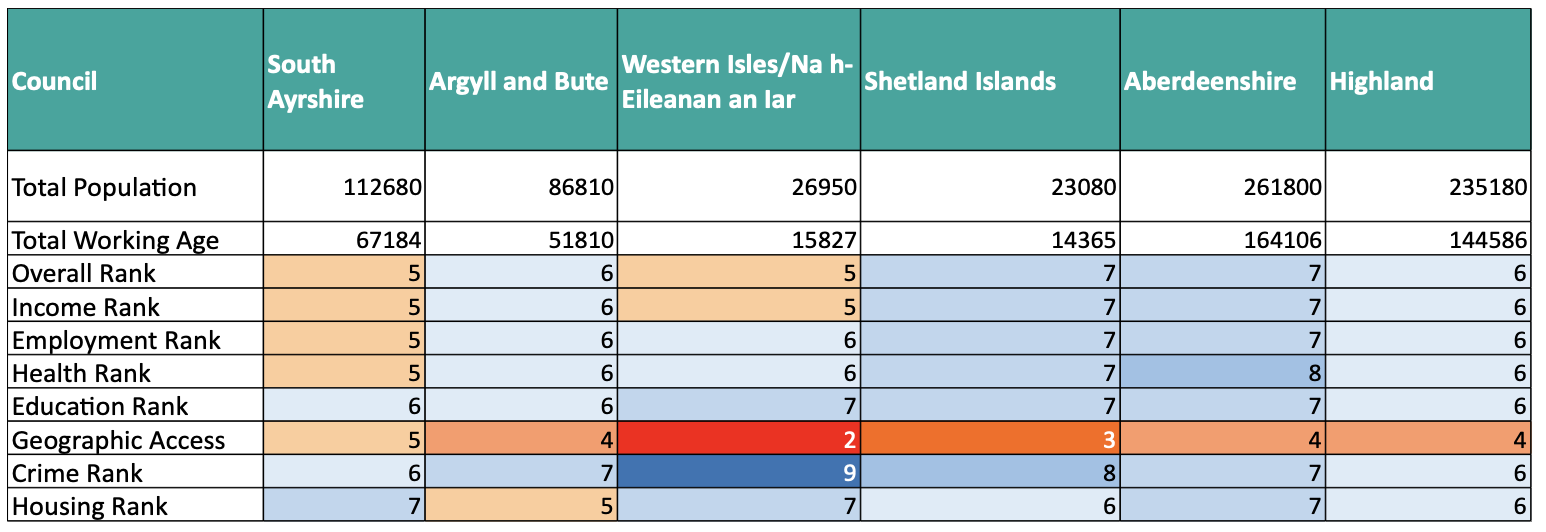
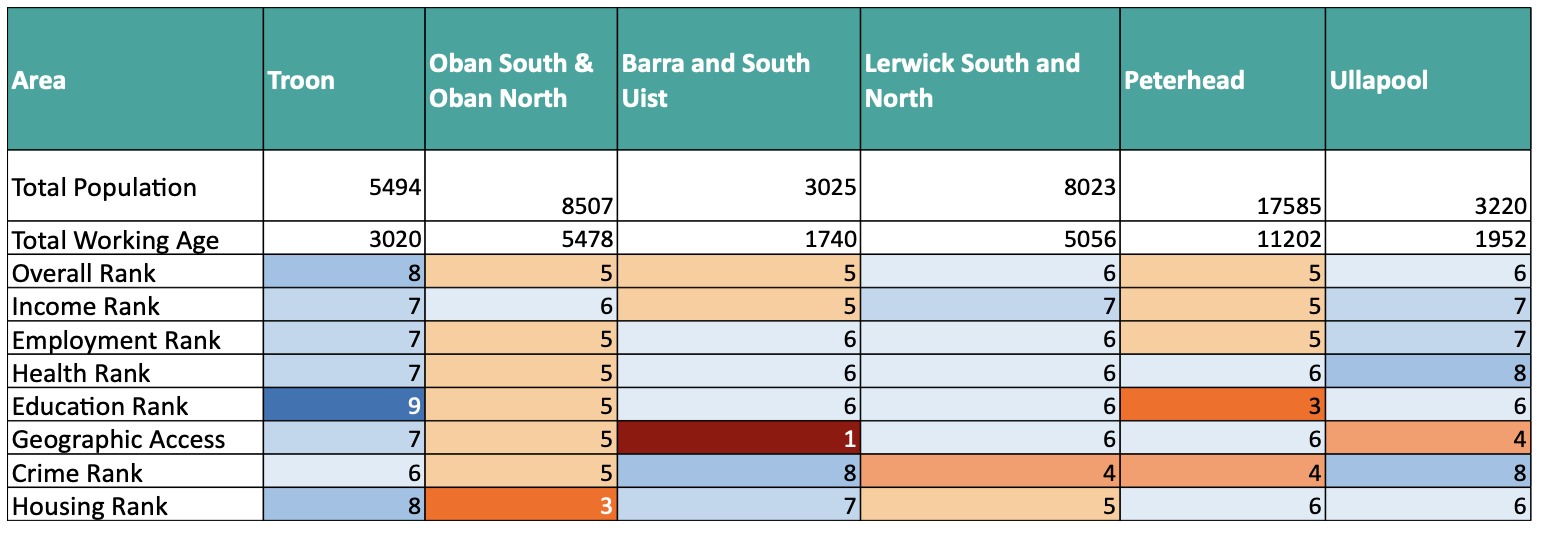
To contextualise some of the discussions in the selected engagement locations, SIMD rankings were explored for each area. The tables bellow present aggregation of all SIMD data zones scores by council (Table 6) and Town/Location (Table 7).
- Peterhead is ranked in average (rank 5-6 or 41%-60%) expect the educational rank where it is placed in the lower rank of 3. While Aberdeenshire is ranked 7-8 form most categories, except in the Geographic Access Rank where it is ranked 4.
- Lerwick has an average to low level of deprivation according to the SIMD, with housing and crime being its most deprived factors. It is generally slightly more deprived than its surrounding council area of Shetland Islands.
- Troon has low levels of deprivation, with all factors ranking between six and nine, where ten is least deprived. It is generally less deprived than its surrounding council area of South Ayrshire.
- Oban has average to high levels of deprivation, with housing being its most deprived factor. It is generally more deprived than its surrounding council area of Argyll and Bute.
- Ullapool has mostly low levels of deprivation, with geographic access being its most deprived factor. It is generally less deprived than its surrounding council area of Highland.
- Barra has a range of deprivation levels, with geographic access being its most deprived factor and crime being least deprived. It is generally as equally deprived as its surrounding council area of Western Isles.
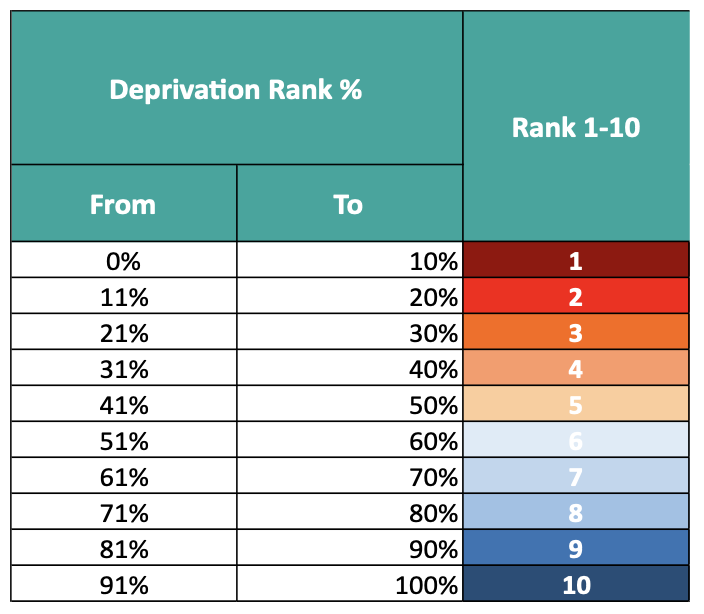
Table Key: From most deprived 10% at rank 1 to least deprived 10% at rank 10.
| Deprivation rank %: From | Deprivation rank %: To | Rank 1-10 |
|---|---|---|
| 0% | 10% | 1 |
| 11% | 20% | 2 |
| 21% | 30% | 3 |
| 31% | 40% | 4 |
| 41% | 50% | 5 |
| 51% | 60% | 6 |
| 61% | 70% | 7 |
| 71% | 80% | 8 |
| 81% | 90% | 9 |
| 91% | 100% | 10 |
| Council | South Ayrshire | Argyll and Bute | Western Isles/ Na h-Eileanan an Iar | Shetland Islands | Aberdeenshire | Highland |
|---|---|---|---|---|---|---|
| Total Population | 112680 | 86810 | 26950 | 23080 | 261800 | 235180 |
| Total Working Age | 67184 | 51810 | 15827 | 14365 | 164106 | 144586 |
| Overall Rank | 5 | 6 | 5 | 7 | 7 | 6 |
| Income Rank | 5 | 6 | 5 | 7 | 7 | 6 |
| Employment Rank | 5 | 6 | 6 | 7 | 8 | 6 |
| Health Rank | 5 | 6 | 6 | 7 | 8 | 6 |
| Education Rank | 6 | 6 | 7 | 7 | 7 | 6 |
| Geographic Access | 5 | 4 | 2 | 3 | 4 | 4 |
| Crime Rank | 6 | 7 | 9 | 8 | 7 | 6 |
| Housing Rank | 7 | 5 | 7 | 6 | 7 | 6 |
| Area | Troon | Oban South & North | Barra and South Uist | Lerwick South and North | Peterhead | Ullapool |
|---|---|---|---|---|---|---|
| Total Population | 5494 | 8507 | 3025 | 8023 | 17585 | 3220 |
| Total Working Age | 3020 | 5478 | 1740 | 5056 | 11202 | 1952 |
| Overall Rank | 8 | 5 | 5 | 6 | 5 | 6 |
| Income Rank | 7 | 6 | 5 | 7 | 5 | 7 |
| Employment Rank | 7 | 5 | 6 | 6 | 5 | 7 |
| Health Rank | 7 | 5 | 6 | 6 | 6 | 8 |
| Education Rank | 9 | 5 | 6 | 6 | 3 | 6 |
| Geographic Access | 7 | 5 | 1 | 6 | 6 | 4 |
| Crime Rank | 6 | 5 | 8 | 4 | 4 | 8 |
| Housing Rank | 8 | 3 | 7 | 5 | 6 | 6 |
Contact
Email: marine_biodiversity@gov.scot