Scottish Vacant And Derelict Land Survey 2021
The Scottish Vacant and Derelict Land Survey (SVDLS) is a data collection undertaken to establish the extent and state of vacant and derelict land in Scotland.
Part of
9. Derelict and Urban Vacant Land: Location relative to deprivation
9.1 This section focuses on derelict and urban vacant land and where it is situated relative to the 15% most deprived data zones in Scotland (as identified by the ‘Scottish Index of Multiple Deprivation’ (SIMD). The SIMD identifies small area concentrations of multiple deprivation across all of Scotland. It contains 33 indicators across seven domains: Income, Employment, Health, Education, Skills and Training, Geographic Access to Services, Crime and Housing. SIMD 2020 was used for 2021, but earlier releases of SIMD have been used for earlier years. Particular care should be taken when interpreting the data for 2020 as eight authorities were unable to complete a survey return mainly due to COVID-19 Pandemic related restrictions and results have been rolled over from 2019. This will affect the figures for each of these authorities, the Scotland total and any comparison with other years. More detailed information on this is presented in section 4 of the publication and in the notes accompanying tables, chart and annexes.
9.2 Over the years 2015 to 2019 there was a gradual decline in the area of derelict and urban vacant land within the 15% most deprived data zones. There was a marked decrease in 2020 and in 2021 there were 1,049 hectares in the most deprived data zones, 14% of all derelict and urban vacant land (Table 11).
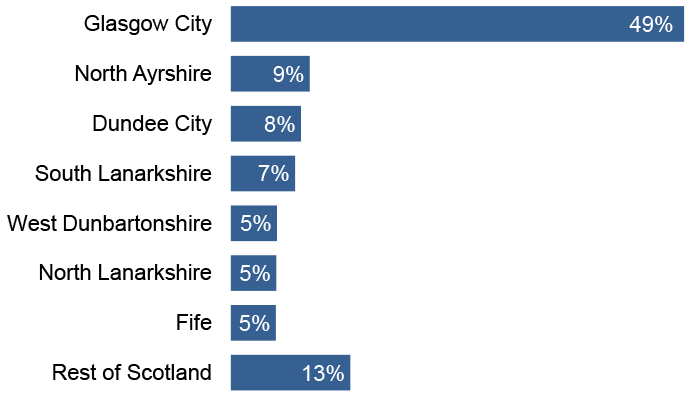
9.3 Nearly half (49%) of all derelict and urban vacant land located within the 15% most deprived data zones is in Glasgow City. Throughout the period 2015-2021 Glasgow City had the largest amount of derelict and urban vacant land located within the 15% most deprived data zones.
9.4 As data zones get progressively less deprived, the proportion of their population that lives within 500 metres of a derelict site becomes smaller (Chart 3).
9.5 Analysis for 2021 used 2020 mid-year population estimates and SIMD 2020 was used for the years 2020 and 2021. Comparisons earlier years should be made with caution as previous years based on earlier versions of the SIMD.
| Percentage of Planning Authority Datazones within Scotland's 15 Per Cent most deprived SIMD | 2015 | 2016 | 2017 | 2018 | 2019 | 2020 | 2021 | ||||||||
|---|---|---|---|---|---|---|---|---|---|---|---|---|---|---|---|
| Planning Authority | Area of Vacant & Derelict Land | Sites | Area of Vacant & Derelict Land | Sites | Area of Vacant & Derelict Land | Sites | Area of Vacant & Derelict Land | Sites | Area of Vacant & Derelict Land | Sites | Area of Vacant & Derelict Land | Sites | Area of Vacant & Derelict Land | Sites | |
| Aberdeen City | 5 | 4 | 3 | 2 | 2 | 2 | 3 | 2 | 3 | 2 | 3 | 2 | 3 | 5 | 4 |
| Aberdeenshire | 1 | 1 | 4 | 1 | 4 | 1 | 4 | 1 | 4 | 1 | 4 | 4 | 6 | 4 | 6 |
| Angus | 4 | - | - | - | - | - | - | - | - | - | - | 1 | 1 | 1 | 1 |
| Argyll and Bute | 9 | 3 | 7 | 2 | 6 | 2 | 5 | 2 | 5 | 2 | 5 | 3 | 6 | 2 | 6 |
| Clackmannanshire | 7 | 3 | 5 | 4 | 5 | 3 | 4 | 3 | 4 | 3 | 4 | 4 | 6 | 4 | 6 |
| Dumfries and Galloway | 31 | - | - | - | - | - | - | - | - | - | - | 8 | 1 | 8 | 1 |
| Dundee City | 22 | 77 | 95 | 70 | 85 | 60 | 80 | 61 | 79 | 60 | 79 | 80 | 86 | 80 | 86 |
| East Ayrshire | 3 | 309 | 27 | 309 | 27 | 308 | 27 | 306 | 20 | 299 | 18 | 26 | 12 | 13 | 11 |
| East Dunbartonshire | 2 | - | - | - | - | - | - | - | - | - | - | 1 | 1 | 1 | 1 |
| East Lothian | 3 | - | - | - | - | - | - | - | - | - | - | 1 | 2 | 1 | 2 |
| East Renfrewshire | 8 | 3 | 5 | 3 | 5 | 3 | 5 | 2 | 4 | 2 | 3 | 1 | 1 | 1 | 1 |
| City of Edinburgh | 18 | 18 | 8 | 16 | 8 | 16 | 8 | 11 | 5 | 9 | 6 | 5 | 5 | 1 | 2 |
| Falkirk | 11 | 16 | 6 | 14 | 6 | 18 | 6 | 18 | 7 | 17 | 5 | 5 | 4 | 4 | 3 |
| Fife | 15 | 59 | 34 | 51 | 31 | 56 | 33 | 55 | 31 | 53 | 31 | 54 | 37 | 51 | 32 |
| Glasgow City | 39 | 705 | 535 | 681 | 515 | 659 | 502 | 616 | 476 | 586 | 454 | 555 | 436 | 516 | 414 |
| Highland | 7 | 4 | 11 | 4 | 11 | 4 | 11 | 4 | 11 | 4 | 11 | 5 | 14 | 2 | 7 |
| Inverclyde | 37 | 46 | 65 | 43 | 62 | 40 | 55 | 44 | 57 | 41 | 53 | 39 | 51 | 37 | 49 |
| Midlothian | 4 | 4 | 3 | 4 | 2 | 3 | 1 | 3 | 1 | 3 | 1 | 3 | 1 | - | - |
| Moray | 1 | - | - | - | - | - | - | - | - | - | - | - | - | - | - |
| Na h-Eileanan Siar | * | - | - | - | - | - | - | - | - | - | - | - | - | - | - |
| North Ayrshire | 27 | 123 | 54 | 118 | 53 | 119 | 53 | 114 | 47 | 111 | 45 | 89 | 42 | 90 | 44 |
| North Lanarkshire | 24 | 89 | 109 | 86 | 105 | 104 | 106 | 98 | 107 | 101 | 110 | 50 | 79 | 52 | 78 |
| Orkney Islands | * | - | - | - | - | - | - | - | - | - | - | - | - | - | - |
| Perth and Kinross | 4 | - | - | * | 1 | * | 1 | * | 2 | * | 2 | * | 2 | * | 2 |
| Renfrewshire | 22 | 63 | 64 | 63 | 64 | 45 | 48 | 42 | 42 | 36 | 38 | 37 | 38 | 36 | 38 |
| Scottish Borders | 5 | 6 | 8 | 6 | 8 | 5 | 7 | 3 | 5 | 3 | 5 | 4 | 5 | 4 | 5 |
| Shetland Islands | * | - | - | - | - | - | - | - | - | - | - | - | - | - | - |
| South Ayrshire | 13 | 3 | 5 | 3 | 5 | 3 | 6 | 4 | 7 | 5 | 12 | 6 | 10 | 6 | 10 |
| South Lanarkshire | 14 | 83 | 65 | 73 | 61 | 73 | 59 | 68 | 53 | 71 | 56 | 75 | 59 | 73 | 56 |
| Stirling | 7 | 12 | 11 | 15 | 11 | 14 | 11 | 14 | 10 | 14 | 9 | 7 | 6 | 6 | 6 |
| West Dunbartonshire | 31 | 57 | 28 | 49 | 24 | 50 | 23 | 52 | 22 | 51 | 22 | 59 | 26 | 53 | 28 |
| West Lothian | 8 | 3 | 2 | 3 | 2 | 3 | 2 | * | 1 | * | 1 | * | 1 | * | 1 |
| Scotland | 1,690 | 1,154 | 1,619 | 1,103 | 1,591 | 1,060 | 1,525 | 1,003 | 1,477 | 977 | 1,123 | 942 | 1,049 | 901 | |
General notes - at sections 3 and 4 apply.
Specific note 5 - previous SVDLS bulletins have used different base years for percentage change and so these percentages should not be compared with those in previous bulletins.
Specific note 6 - Different releases of SIMD are used. In 2015, SIMD 2012 was used, for 2016 to 2019 SIMD 2016 was used and in 2021 SIMD 2020 has been used and direct comparison should not be made to years where a different release of SIMD has been used.
Specific note 23 - For the 2020 survey eight authorities (Aberdeen City, Dundee City, East Ayrshire, Highland, Loch Lomond and the Trossachs, Ornkey Islands, West Dunbartonshire and West Lothian) were unable to complete a survey mainly due to COVID-19 Pandemic related restrictions but also staffing issues and results have been rolled over from 2019. These return rates should be borne in mind when using and interpreting the figures for these authorities in the year 2020, when interpreting the Scotland total in 2020 and when comparing the 2020 figures to other years.
Specific note 24 - six authorities reported various impacts of the COVID-19 Pandemic on their survey return in 2021. More details are provided at sections 3 and 4. These impacts should be borne in mind when using and interpreting the figures for these authorities in the year 2021, when comparing the 2021 figure to other years and when interpreting the Scotland total for 2021.
General notes - at sections 3 and 4 apply.
Specific note 20 - Glasgow conducted a partial survey in 2021 and some sites were recorded as re-used but no new sites were added due to difficulty with resource for the survey. Dundee City and West Lothian have not updated their survey since 2019 so no new data is available on new site in 2021. Details of survey return rates back to 2015 are shown at Annex D. Specific note 24 - some authorities reported various impacts of the COVID-19 Pandemic on their survey return in 2021. More details are provided at sections 3 and 4. These impacts should be borne in mind when using and interpreting the figures for these authorities in the year 2021, when comparing the 2021 figure to other years and when interpreting the Scotland total for 2021.
Contact
Email: planstats@gov.uk