Scottish Study of Early Learning and Childcare: Three-year-olds (Phase 3) Report - Updated 2021
Findings from the third phase of the Scottish Study of Early Learning and Childcare (SSELC), a research project established to evaluate the expansion of early learning and childcare in Scotland.
Change in outcomes for Eligible 2s and their parents between Phase 1 and Phase 3
All analysis in this section is based on the same group of children at both phases –those for whom valid responses were provided at both Phase 1 and Phase 3. This means that sample sizes are low for this analysis (see Methods section) and caution should be taken when interpreting the findings. However, any changes can be understood as definite changes for this particular cohort of children, rather than due to a change in the composition of the sample between phases. All children included in the analysis were eligible for funded ELC provision at age two, and were restricted to certain areas of Scotland at Phase 1. As such, they are not representative of children attending ELC more widely. Data in this section have not been weighted.
Figures for Phase 1 are likely to differ from those previously published in the Phase 1 report because the sample has been restricted in this report to those with data at both phases. For the same reason, figures for Phase 3 are likely to differ from those included in the section comparing outcomes for the Eligible 2s at Phase 3 and the Comparator 3s.
Child health and development
Assessments of development
Children's keyworkers at ELC settings were asked to complete observations of the child's development using the Ages and Stages (ASQ) and Strengths and Difficulties (SDQ) questionnaires. Both the ASQ and SDQ are widely used by Health Visitors across Scotland as part of their health reviews of pre-school children – the Scottish Child Health Programme[19]. These particular instruments were also selected for inclusion in the Child Health Programme following an extensive review by academics and practitioners[20].
The ASQ provides a structured assessment of a range of developmental domains, usually using a parental questionnaire supported by observation of the child at play, to identify children at increased risk of developmental difficulties. There are 30 items split into five different domains: communication, gross motor, fine motor, problem solving and personal-social. By answering 'yes', 'sometimes' or 'no', the respondent indicates whether or not the child can complete the action or provide the response required. Each domain produces a summary score which can be used to indicate whether the child's development is on schedule, needs monitoring or requires further assessment. Whilst it is designed to be completed by parents, because it is informed by observation of the child it was deemed suitable for completion by the child's keyworker at their ELC setting.
The ASQ is intended to identify developmental delays, and hence is specific to the age of the child. Three different versions of the questionnaire were used at Phase 1, depending on the child's exact age, while a further two different versions were used at Phase 3. While the ASQ has been carefully calibrated with a broad range of children so that we might expect the proportion demonstrating delayed development to be similar for each age group, we should be cautious in stating that any apparent changes over time identified by this study are real rather than artefacts of the questionnaire or due to keyworkers being more familiar with the children than they were at Phase 1.
The SDQ is a commonly used behavioural screening questionnaire designed for use with children aged between three and 16. It consists of 25 questions about a child's behaviour to which the respondent can answer 'not true', 'somewhat true' or 'certainly true'. Responses can be combined to form five different measures of the child's development, namely emotional symptoms (e.g. excessive worrying), conduct problems (e.g. often fighting with other children), hyperactivity / inattention (for example, constantly fidgeting), peer relationship problems (e.g. not having close friends), and prosocial behaviour (e.g. being kind to others). Furthermore, the first four measures can be combined into a 'total difficulties' scale. Higher scores imply greater evidence of difficulties on each of the scales, with the exception of the prosocial behaviour scale where the reverse is true. In this report, recommended banded versions of the scales have been used to create the following categories: 'close to average', 'slightly raised', 'high' and 'very high', with 'very high' indicating multiple difficulties identified.
A slightly modified version of the original SDQ has been validated for children between the ages of two and four. This was used at both Phase 1 and Phase 3. As children are developing rapidly at this age, we may expect scores on the scales to differ for two-year-olds and three-year-olds. Thus we cannot claim that changes in the scores over time identified in the data are due to the child receiving ELC rather than the natural development of the children over the course of a year. However, once the surveys have been repeated with children receiving the increased hours of ELC, we may be able to attribute a difference in the magnitude of any change to the increase in hours, if all other factors remain constant.
Ages and Stages Questionnaire
Figure 3 shows the proportion of children whose development was recorded as being on schedule, where monitoring was suggested and where further assessment may be needed on each of the ASQ domains at both Phase 1 (age two) and Phase 3 (age three). Taking into account the caution that should be applied in interpreting these changes noted above, on four of the five domains there was an increase in the proportion of children reported as on schedule after one year of funded ELC provision. This increase is particularly noticeable for the personal-social domain, from 41% on schedule at age two to 71% one year later. On the other four domains, around half the children were on schedule at age three. This represented an increase from 34% to 52% on the problem solving domain, an increase from 42% to 52% on the fine motor domain, and a smaller increase, from 46% to 50% on the communication domain. The gross motor domain actually saw a fall in the proportion of children on schedule, from 61% to 48%[21].
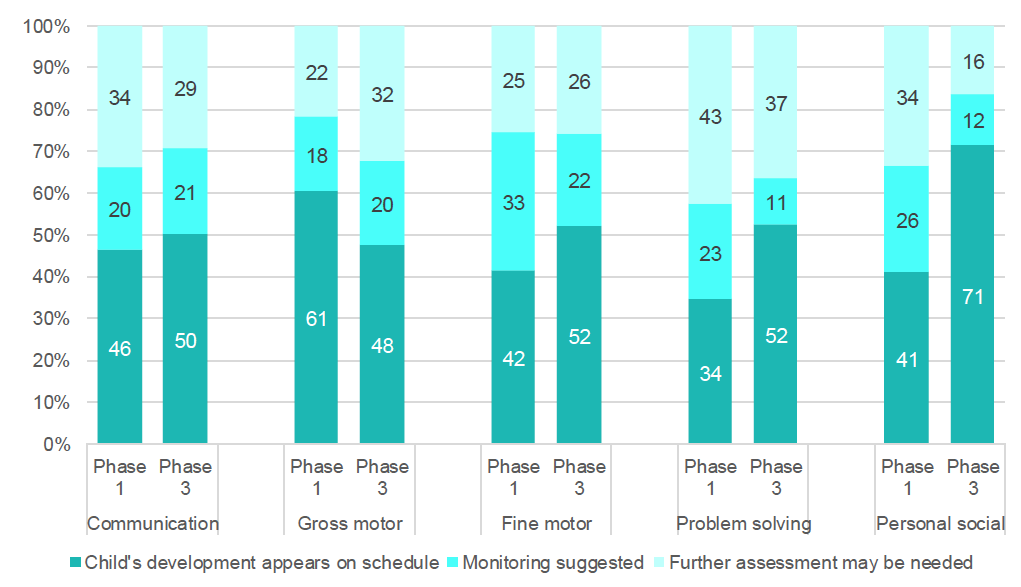
Base: All children (with keyworker observations at both Phase 1 and Phase 3, unweighted)
Figure 3: ASQ score by domain, Phase 1 and Phase 3. This stacked column chart shows that on the Communication, Fine Motor, Problem Solving and Personal Social ASQ domains there was an increase in the proportion of children reported as on schedule in Phase 3 compared with Phase 1. In the gross motor domain there was a fall in the proportion of children on schedule.
While the overall pattern saw an increase in the proportion on schedule for the Eligible 2s after a year of funded ELC, there was movement in both directions. Some children who appeared on schedule at Phase 1 were no longer recorded as such one year later, and other children who were not recorded as on schedule when they were age two appeared to be on schedule at age three. Figure 4 demonstrates this for the communication domain, while similar information for the other domains can be found in Appendix C, Tables C1 to C4. Looking at Figure 4, two thirds (65%) of those whose development was assessed as on schedule at Phase 1 were still on schedule at Phase 3. Just over half (56%) of those for whom it was suggested that further assessment may be needed at Phase 1 were recorded as the same at Phase 3, while a third of this group (30%) were recorded with development on schedule at Phase 3.
Figure 4 also demonstrates differences according to the rating of the ELC setting at Phase 1, using the Infant / Toddler Environment Rating Scale (ITERS-3)[22]. It shows that there was no clear association between the rating of the setting and change in ASQ communication score. Similar proportions of those who were on schedule at Phase 1 remained on schedule at Phase 3, irrespective of the rating (65% of those in settings rated 5 or above and 69% of those in settings rated less than 5) and similar proportions of those for whom further assessment was needed at Phase 1 improved to be on schedule by Phase 3 (29% of those in settings rated 5 or above and 32% of those in settings rated less than 5). It is worth noting, however (see Table C5 in Appendix C), that the proportion of children for whom further assessment is needed was higher in settings with a lower rating (33% of those in lower rated settings and 24% of those in higher rated settings), and that this proportion has fallen slightly for all settings since Phase 1 (down from 39% of those in lower rated settings and 28% of those in higher rated settings).
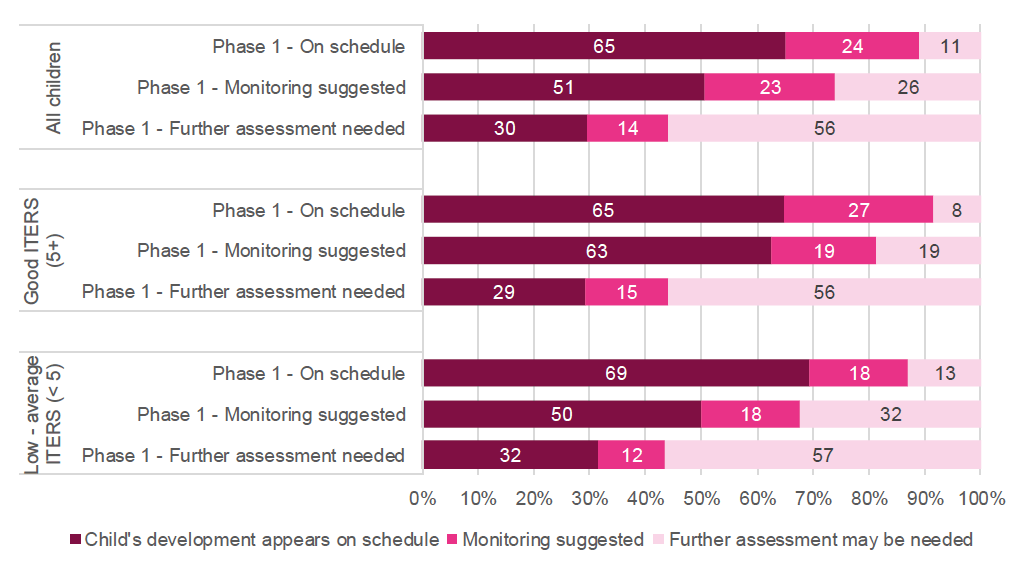
Base: All children (with keyworker observations at both Phase 1 and Phase 3, unweighted)
Figure 4: ASQ communication domain Phase 3, by ASQ communication domain Phase 1 and rating of ELC setting (ITERS-3) Description. This stacked bar chart shows that 65% of those whose development on the ASQ communication domain was assessed as on schedule at Phase 1 were still on schedule at Phase 3. 56% of those for whom it was suggested that further assessment may be needed at Phase 1 were recorded as the same at Phase 3, while 30% of this group were recorded with development on schedule at Phase 3. It also shows no clear association between the rating of the setting and change in ASQ communication score.
Strengths and Difficulties Questionnaire
Figure 5 shows a large increase in the proportion of children with close to average scores on the SDQ prosocial domain, from 45% at age two, to 73% at age three. This is perhaps not surprising, given the natural development of children's prosocial behaviour during this period of their life. The limitations of the SDQ in measuring change over time for specific groups, including the Eligible 2s, were outlined earlier. Even though it is not possible to assess how much of the observed increase may be due to measurable features, such as the quality of nursery provision, and how much is due to the expected development at this stage in life, this increase at least sets out a baseline change for the Eligible 2s against which changes identified by future data collections, following the increase to 1140 funded hours, may be assessed.
Changes on the other domains were much smaller. The proportion of children with a close to average score was highest at age three on the emotional symptoms domain, despite a small decrease from 80% at Phase 1 to 77% at Phase 3. The other domains all saw increases in the proportion with close to average scores following a year of funded ELC provision, from 69% to 75% on the conduct problems domain, from 46% to 53% on the hyperactivity domain and from 38% to 55% on the peer problems domain. The total difficulties domain, which summarises the scores on these four domains, saw an increase in the proportion with close to average scores from 44% at Phase 1 to 58% at Phase 3.
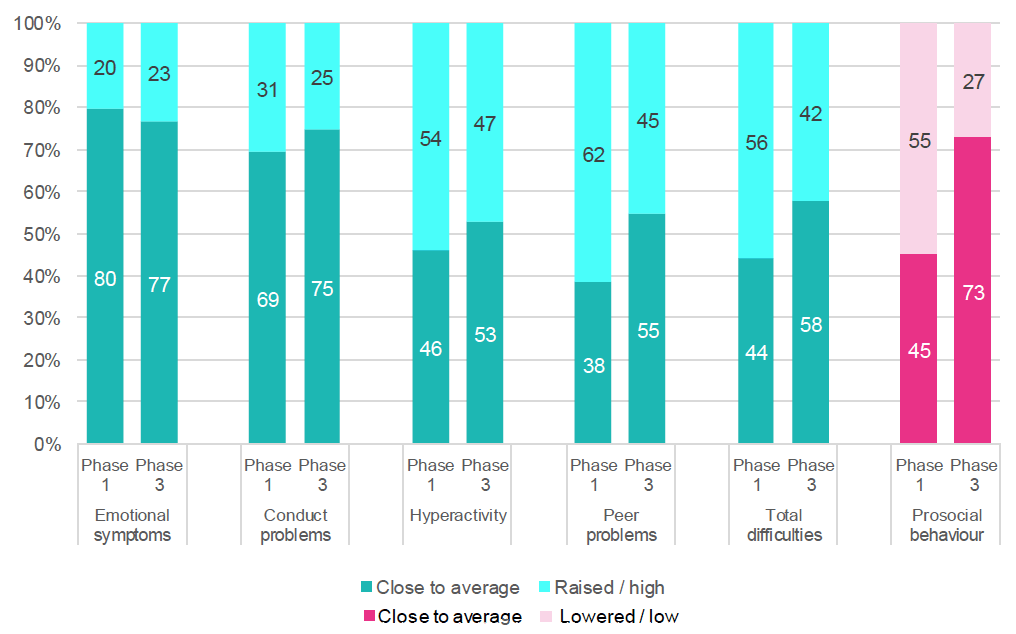
Base: All children (with keyworker observations at both Phase 1 and Phase 3, unweighted)
Figure 5: SDQ score by domain, Phase 1 and Phase 3 Description. This stacked column chart shows that on the Conduct Problems, Hyperactivity, Peer Problems and Prosocial Behaviour SDQ domains there was an increase in the proportion of children reported as close to average in Phase 3, compared with Phase 1. In the Emotional Symptoms domain there was a small fall in the proportion of children on schedule from 80% to 77%.
As was seen with the ASQ scores, there was movement in both directions. Figure 6 shows that two thirds (69%) of those with a close to average SDQ total difficulties score at age two continued to have a close to average score one year later, while one third (31%) had a raised or high score at the age of three. Half (49%) of those with a raised or high score at age two had improved to a close to average score by age three.
Figure 6 also shows the association between the summary measure of scores on the ITERS scale, from the setting observations at Phase 1, and the change in SDQ total difficulties scores. For those with a raised or high score at Phase 1, no difference was observed, with half (49%) of those in settings rated both higher and lower showing an improvement to achieve a close to average score at Phase 3. For those with a close to average score at Phase 1, there is the slightly surprising finding that a higher proportion of those in a setting rated below 5 retained the close to average score at Phase 3 (73% compared with 62% of those in a setting rated 5 or above). Due to small sample sizes, we should not read too much into this result, but it would be worth further analysis of the data to explore whether individual elements of ITERS show associations with an improvement in SDQ (and ASQ) and whether there are differences in the types of household accessing settings with different qualities. Overall, SDQ scores were similar at Phase 3 irrespective of the ITERS score of the setting, although a higher proportion of children in settings with a score of 5 or above were assessed as close to average at Phase 1 than of children in settings with a lower score (Table C6 in Appendix C).
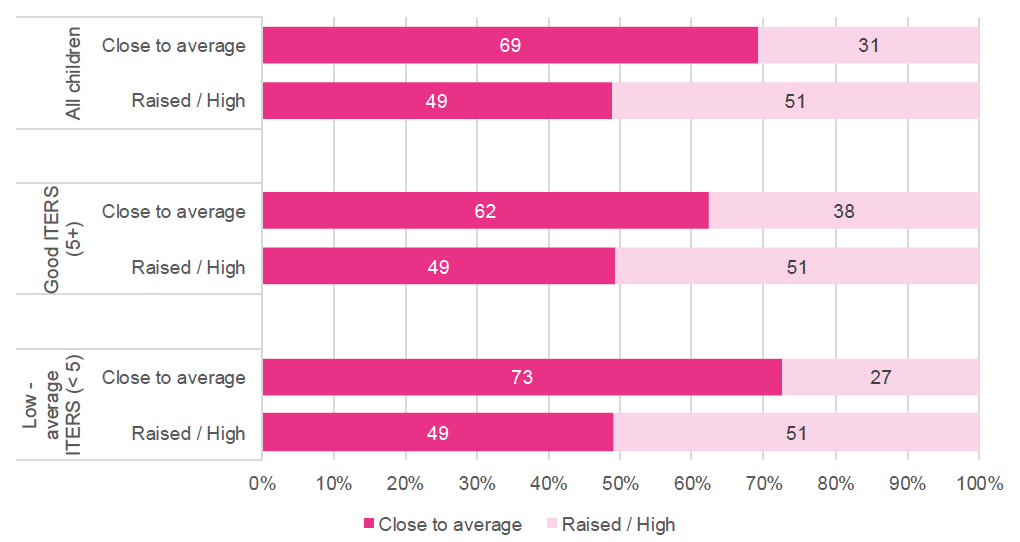
Base: All children (with keyworker observations at both Phase 1 and Phase 3, unweighted)
Figure 6: SDQ total difficulties score Phase 3, by SDQ total difficulties score Phase 1 and rating of ELC setting (ITERS-3) Description. This stacked bar chart shows that, of those with a raised or high SDQ score at Phase 1, 49% of those in settings rated both higher and lower showed an improvement to achieve a close to average score at Phase 3. For those with a close to average score at Phase 1, 73% of those in a setting rated below 5 retained the close to average score at Phase 3, compared with 62% of those in a setting rated 5 or above.
General health
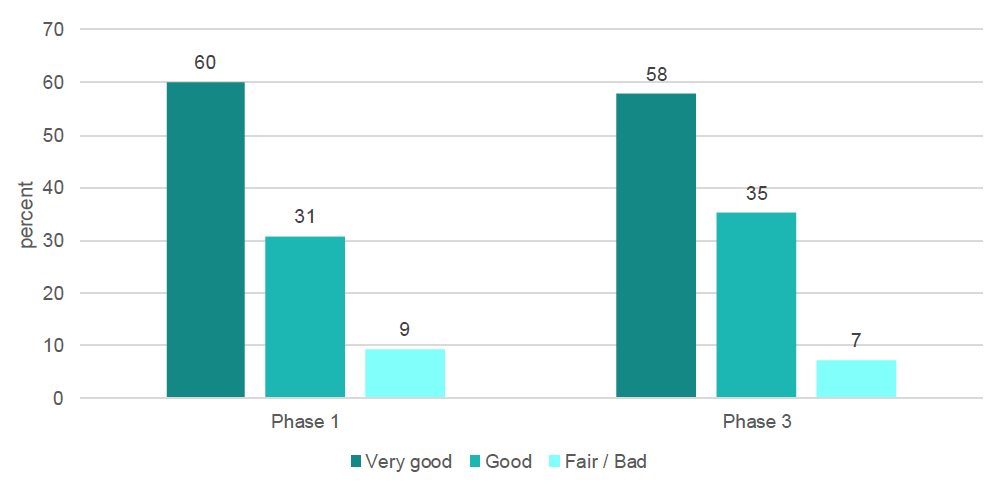
At both Phase 1 and Phase 3, most children were in good or very good health (91% at Phase 1, 93% at Phase 3, see Figure 7). Around half (48%) of those whose health was only fair at Phase 1 showed an improvement to good or very good health, while only small numbers showed any deterioration from good or very good to fair or bad (see Table C7 in Appendix C).
Base: All children (with parent questionnaire at both Phase 1 and Phase 3, unweighted)
Figure 7: Child's general health, Phase 1 and Phase 3 Description. This clustered column chart shows that at Phase 1 60% of children were in very good health, 31% in good health and 9% in fair health. In Phase 3, 58% were in very good health, 35% were in good health and 7% in fair health.
There was also little change over the course of a year in the proportion of children with a long-term illness or health condition: 12% at Phase 1 and 14% at Phase 3. Of those with a condition at Phase 1, a third (33%) were not reported as having the condition at Phase 3, while small numbers were reported as having a condition at Phase 3 but not at Phase 1 (Table C8 in Appendix C).
The proportions of parents noting concerns about how their child talked or what they understood also remained fairly constant following a year of ELC provision. Around three quarters of parents at each phase said they had no concerns about how the child talked (72% at Phase 1 and 75% at Phase 3), while nine out of ten said they had no concerns about what the child understood (89% at each phase). Where strong concerns existed at phase 1, they tended to persist, but there was movement in both directions, with some parents reporting new concerns and others no longer reporting concerns that had previously existed (Table C9 in Appendix C).
Home environment
Levels of participation in learning activities at home were fairly similar at Phase 1 and Phase 3. More than half the children at both phases looked at books or read stories with someone in their household every day of the week (54% at each phase). A quarter of children did painting or drawing every day at both Phase 1 and Phase 3 (25% at Phase 1 and 26% at Phase 3). Two thirds of children sang songs or recited nursery rhymes (67% at Phase 1 and 70% at Phase 3). Nearly half played at recognising letters, numbers or shapes (40% at Phase 1 and 46% at Phase 3).
Where children were frequently involved with home learning activities at age two, this tended to continue at age three. For example, 70% of those who looked at books or read stories with someone in their household every day at age two did the same at age three, while 42% of those who looked at books no more than two days a week at age two also looked at books this infrequently at age three (Tables C10 to C13 in Appendix C). As we shall see in the next section, home learning activities are associated with child development outcomes, and getting into the habit of frequent learning activities early in a child's life may make it easier for them to persist as they age.
| 0-2 days | 3-4 days | 5-6 days | 7 days | Unweighted base | |
|---|---|---|---|---|---|
| % | % | % | % | ||
| Looked at books or read stories | |||||
| Phase 1 | 11 | 21 | 14 | 54 | 218 |
| Phase 3 | 14 | 16 | 16 | 54 | 218 |
| Painting or drawing | |||||
| Phase 1 | 27 | 29 | 19 | 25 | 216 |
| Phase 3 | 22 | 33 | 19 | 26 | 216 |
| Recited nursery rhymes or sung songs | |||||
| Phase 1 | 15 | 11 | 7 | 67 | 215 |
| Phase 3 | 7 | 8 | 14 | 70 | 215 |
| Recognising letters, words, numbers or shapes | |||||
| Phase 1 | 28 | 17 | 15 | 40 | 215 |
| Phase 3 | 16 | 19 | 20 | 46 | 215 |
Base: All respondents (with parent questionnaire at both Phase 1 and Phase 3, unweighted)
Assessments of development and home/nursery environment
In order to identify the factors most strongly associated with child outcomes, logistic regression modelling was conducted. This technique allows us to identify which factors are independently associated with the outcome variable when other factors in the model are taken into account. More details of this technique, including the tables and how to read them, are included in Appendix D.
Table D1 in Appendix D shows the results of a model to identify factors associated with being on schedule for at least four domains of the ASQ. It contains six variables from Phase 1 which are used to predict the outcome of whether a child was mostly on schedule at Phase 3. This difference in the timings helps us to see the direction of any association, although it in no way implies any causality. Several other variables were tested but not included in the model because they showed no statistically significant association once other variables were taken into account. These are listed in the appendix.
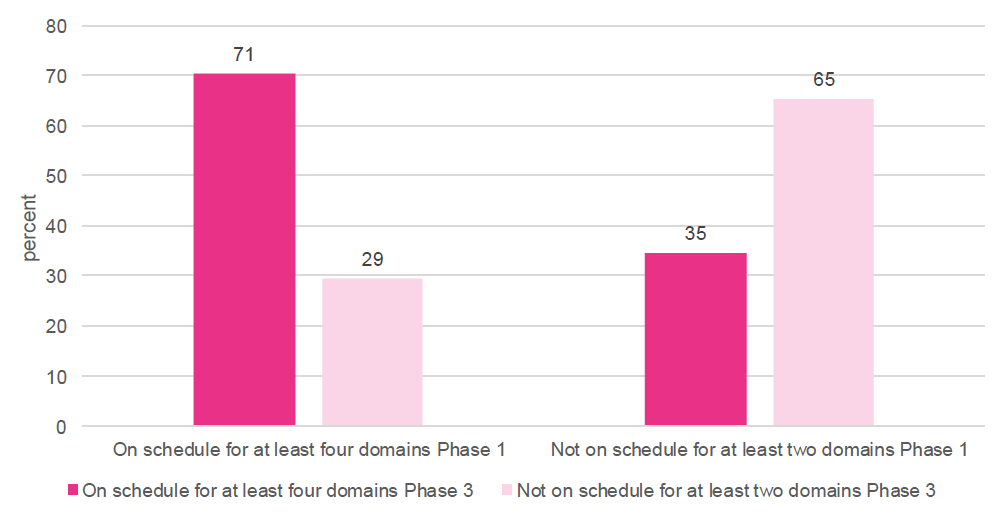
The model demonstrates a strong association between being on schedule for at least four of the domains at Phase 1 (age two) and being on schedule for at least four of the domains at Phase 3 (age three), indicated by the relatively large odds ratio and small statistical significance value, even when other factors are taken into account. This is illustrated in Figure 8 (although this simpler two variable analysis does not take into account the other factors in the model), which is similar to Figure 4 (showing the association for the communication domain only). The strong association suggests that children whose development is largely on schedule at age two are much more likely to continue to be on schedule after a year of ELC provision than those who were not on schedule at age two. Indeed, Figure 8 shows that 71% of those who were largely on schedule at age two were also largely on schedule at age three, compared with 35% of those who were not on schedule for at least four domains. The reverse is also true: 65% of those whose development was not on schedule on at least four domains at age two were not on schedule a year later, compared with 29% of those who were largely on schedule.
Base: All children (with keyworker observations at both Phase 1 and Phase 3, unweighted)
Figure 8: On schedule for at least four ASQ domains Phase 3, by on schedule for at least four ASQ domains Phase 1 Description. This clustered column chart shows that 71% of children who were on schedule for at least four ASQ domains at Phase 1 were also on schedule at Phase 3, compared with 35% of those who were not on schedule for at least four domains. 65% of those whose development was not on schedule on at least four domains at Phase 1 were not on schedule at Phase 3 compared with 29% of those who were largely on schedule.
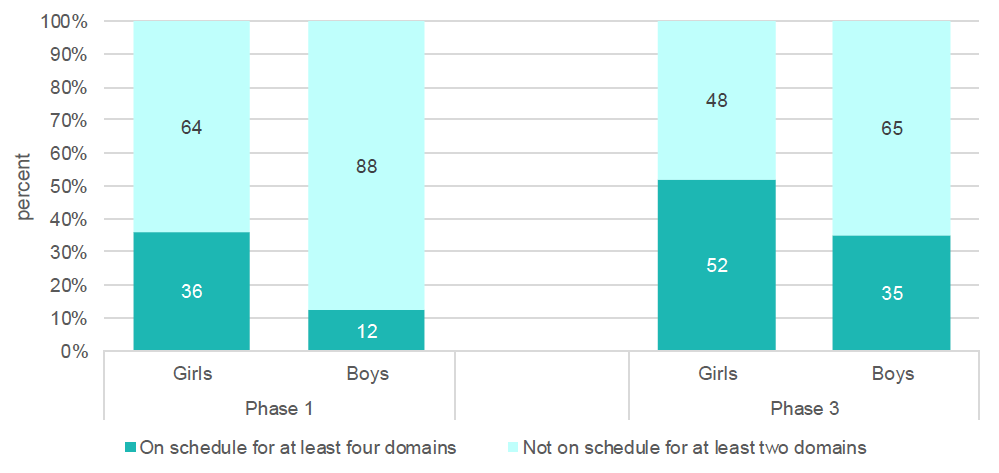
The sex of the child showed a marginally statistically significant association with being on schedule for at least four domains and Figure 9 demonstrates quite a strong association between the sex of the child and being mostly on schedule at Phase 3[23]. However once other factors are taken into account, the association becomes much weaker. This is because girls were more likely than boys to be on schedule at Phase 1 also, so the score at Phase 1 included in the model already accounts for some of the difference between boys and girls at Phase 3. The modelling process identifies the score at Phase 1 as the key driver behind the ASQ score at Phase 3, and being a girl only makes a small difference on top of that.
Base: All children (with ASQ scores at both Phase 1 and Phase 3, unweighted)
Figure 9: On schedule for at least four ASQ domains Phase 1 and Phase 3, by sex of child. This stacked column chart shows that 52% of girls were on schedule for at least 4 domains at Phase 3 compared with 35% of boys. In Phase 1, 36% of girls were on schedule for at least four ASQ domains at Phase 1 compared to 12% of boys.
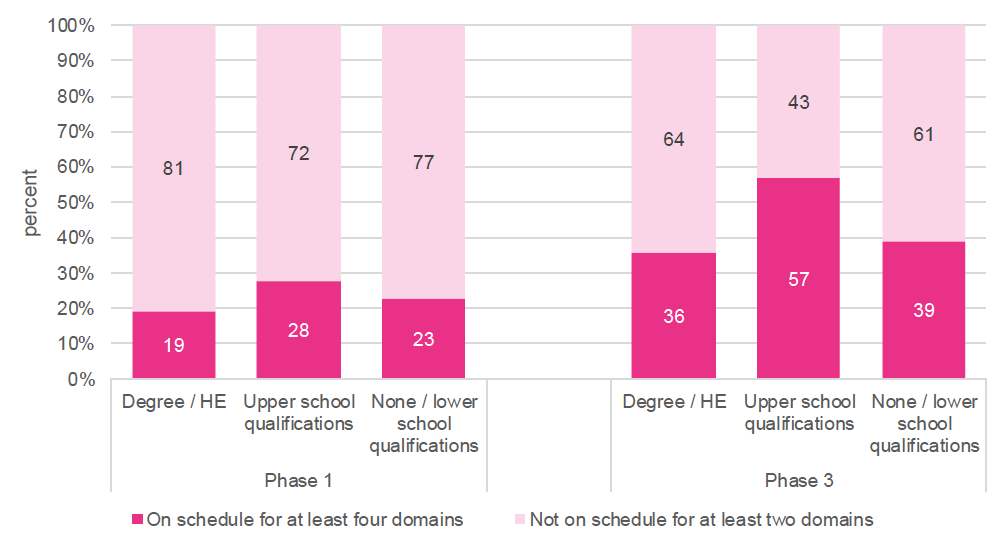
Two other variables included in the model – parent's level of education and frequency of home learning activities - showed significant associations with being on schedule on at least four domains at Phase 3. These are illustrated in Figures 10 and 11. Unlike sex, both of these showed little association at age two, but differences had emerged by the age of three. Parents with upper school qualifications, such as Highers, or equivalent were more likely than those with no qualification or only lower school qualifications to have a child who was on schedule for at least four of the ASQ domains at Phase 3. This difference is much larger than at Phase 1. Perhaps surprisingly, they also appear more likely than those with a degree to have a child who was mostly on schedule, although we should not read too much into this because of the small sample size of parents of the Eligible 2s with a degree.
Base: All children (with ASQ scores at both Phase 1 and Phase 3, unweighted)
Figure 10: On schedule for at least four ASQ domains Phase 1 and Phase 3, by highest qualification of respondent Phase 1. This stacked column chart shows that 57% of parents with upper school qualifications, such as Highers, had a child who was on schedule for at least four of the ASQ domains at Phase 3, compared with 29% with no or only lower school qualifications and 36% with a degree or equivalent. In Phase 1, 28% of parents with upper school qualifications had a child who was on schedule for at least four of the ASQ domains, compared with 23% with no or only lower school qualifications and 19% with a degree or equivalent.
Differences in the proportion of children mostly on schedule were much larger at Phase 3 than at Phase 1 when we compare children according to their home learning environment, as illustrated in Figure 11. Three fifths (58%) of those in the highest quartile of the home learning environment scale at age two were on schedule at age three, compared with two fifths (41%) in the other quartiles. This suggests that frequent learning activities at home around the age of two can make a difference a year later in helping children whose development may not be on schedule at the age of two. As seen earlier, good habits in home learning tend to persist, so it is likely that many of those involved in frequent activities at age two are also involved in frequent activities at age three, and it is the duration of home learning activities, rather than any instantaneous effect that helps children reach their developmental milestones.
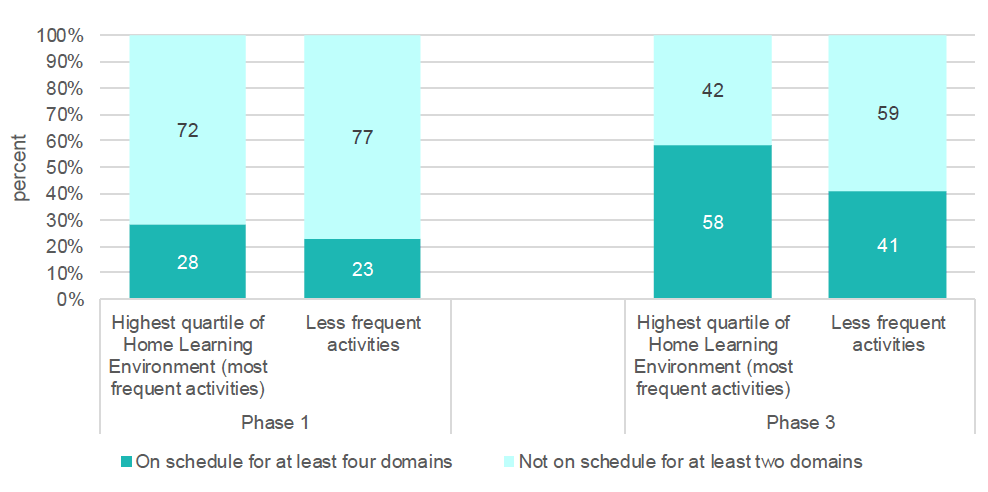
Base: All children (with ASQ scores at both Phase 1 and Phase 3, unweighted)
Figure 11: On schedule for at least four ASQ domains Phase 1 and Phase 3, by home learning environment Phase 1 Description. This stacked column chart shows that 58% of those in the highest quartile of the home learning environment scale at Phase 1 were on schedule at Phase 3, compared with 41% in the other quartiles. In phase 1, 28% of those in the highest quartile of the home learning environment scale were on schedule, compared with 23% in the other quartiles.
Two other variables were included in the model, but were not statistically significantly associated with the outcome measure. The rating of the ELC setting using ITERS was discussed earlier. Area deprivation also showed no association with being mostly on schedule. The associations with many other variables from Phase 1 were also tested, but not included in the final model. These included the number of parents in the household, whether the child had a long-term illness, and whether the respondent was in employment. None of these showed any significant association with being mostly on schedule. A full list of all the variables tested is included in Appendix D.
A similar model was constructed for having a close to average score on the total difficulties scale. Three variables were identified as the key drivers of achieving a close to average score at age three: a close to average score at age two, being female, and doing frequent home learning activities at age two.
The relationship between SDQ scores at Phase 1 and Phase 3 was discussed earlier and illustrated in Figure 6.
Figure 12 shows a slight widening of the gap between boys and girls in the proportion of children with a close to average SDQ score, from nine percentage points (49% of girls and 40% of boys) at age two, to 16 percentage points (66% of girls and 50% of boys) at age three.
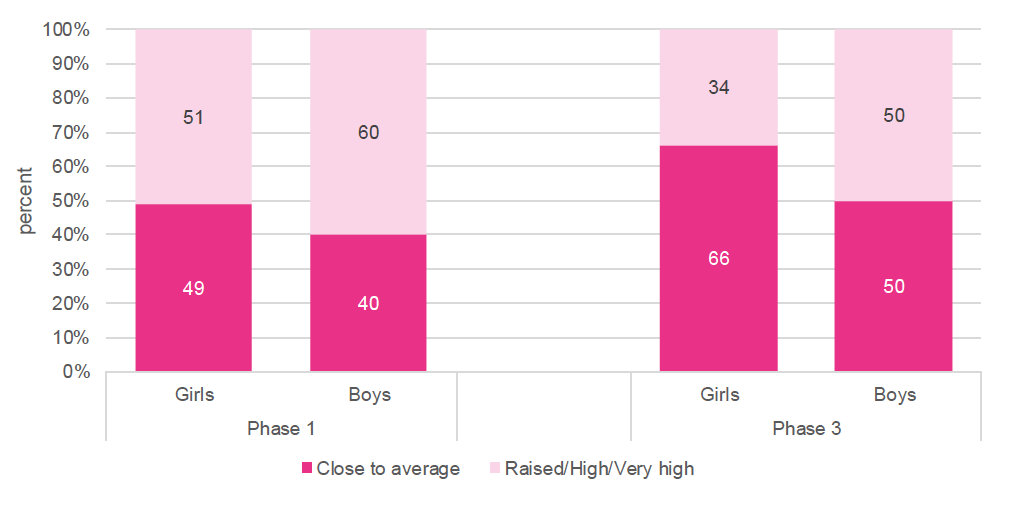
Base: All children (with ASQ scores at both Phase 1 and Phase 3, unweighted)
Figure 12: Close to average SDQ total difficulties score Phase 1 and Phase 3, by sex of child Description. This stacked column chart shows that 66% of girls had a close to average Total Difficulties score at Phase 3 compared with 50% of boys. In Phase 1, 49% of girls had a close to average Total Difficulties score compared with 40% of boys.
Figure 13 shows the increase in the gap in the proportion with close to average SDQ total difficulties scores between those undertaking learning activities at home most frequently and other children following one year of ELC. At age two, this gap was twelve percentage points (54% of those in the highest quartile of home learning environment scores compared with 42% of other children); by age three the gap had increased to 23 percentage points (75% of those in the highest quartile compared with 52% of other children). As noted earlier, while the home learning environment quartiles are a snapshot of the situation when the questionnaires were completed, at age two, in most cases they represent a continued level of home learning activity.
Other factors, including the rating of the ELC setting, area deprivation and parental education showed no association with SDQ total difficulties score at age three, once scores at age two, sex and home learning environment were taken into account.
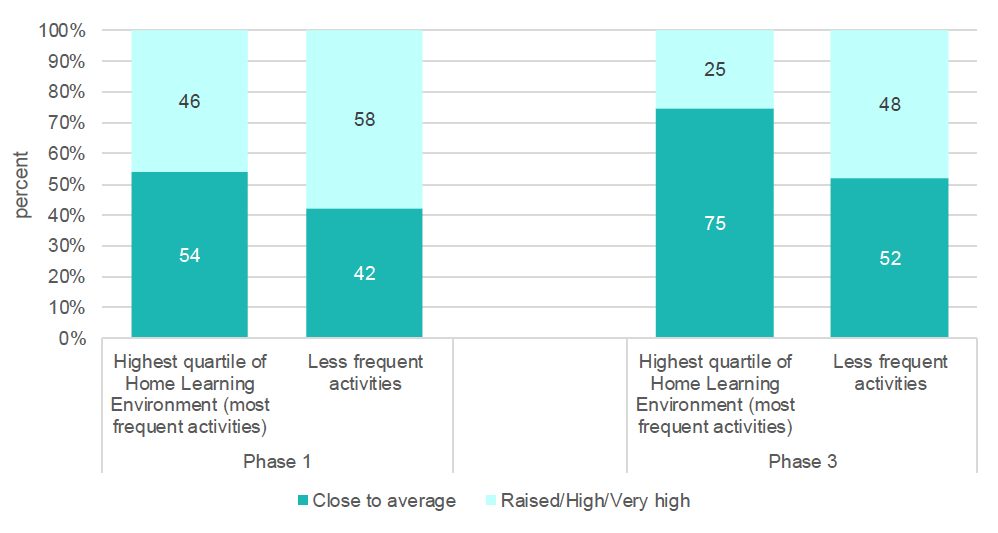
Base: All children (with ASQ scores at both Phase 1 and Phase 3, unweighted)
Figure 13: Close to average SDQ total difficulties score Phase 1 and Phase 3, by home learning environment Phase 1 Description. This stacked column chart shows that 75% of those in the highest quartile of home learning environment scores at Phase 1 had a close to average Total Difficulties score at Phase 3 compared with 52% of other children. In Phase 1, 54% of those in the highest quartile of home learning environment scores had a close to average Total Difficulties score compared with 42% of other children.
Contact
Email: socialresearch@gov.scot