Scottish Social Attitudes Survey 2021/22: public views of telephone and video appointments in general practice

Findings from the Scottish Social Attitudes Survey (2021/22) of public views towards face-to-face and remote appointments in General Practices. The key themes of the research are to understand comfort, ease, influences on, and impacts of remote appointments on public attitudes.

This document is part of a collection


8. Annexes

8.1 Remote Services Questions as part of SSA 2021/22

Say you needed to talk to your doctor or nurse in your surgery about a medical problem of yours. In general, would you be comfortable or uncomfortable if the appointment was:

Face-to-face in the surgery

Over the phone

Via video call

1 Very comfortable

2 Fairly comfortable

3 Neither comfortable nor uncomfortable

4 Fairly uncomfortable

5 Very uncomfortable

And if you had to talk to your doctor or nurse about a medical problem of yours, how easy or difficult would it be for you to:

Visit them in their surgery

Talk to your doctor or nurse over the phone

Talk to your doctor via a video call

1 Very easy

2 Fairly easy

3 Neither easy nor difficult

4 Fairly difficult

5 Very difficult

Say your doctor offered you an appointment over the phone [or via video] instead of face-to-face. Which of the following would matter most to you in deciding whether to accept such an appointment?

How quickly I could get the appointment

How easily I could attend the appointment

How well I know the doctor

How worried I was about the condition

Say your doctor reduced the number of people they saw in their surgery and instead spoke to more people over the phone or via a video call.

How much do you agree or disagree that this would:

Reduce the risk that serious medical conditions are missed

Be more convenient for most patients

Mean my doctor would know their patients less well

Ensure that those who need one can get a face-to-face appointment quickly

1 Agree strongly

2 Agree

3 Neither agree nor disagree

4 Disagree

5 Disagree strongly

8.2 Respondent Characteristics

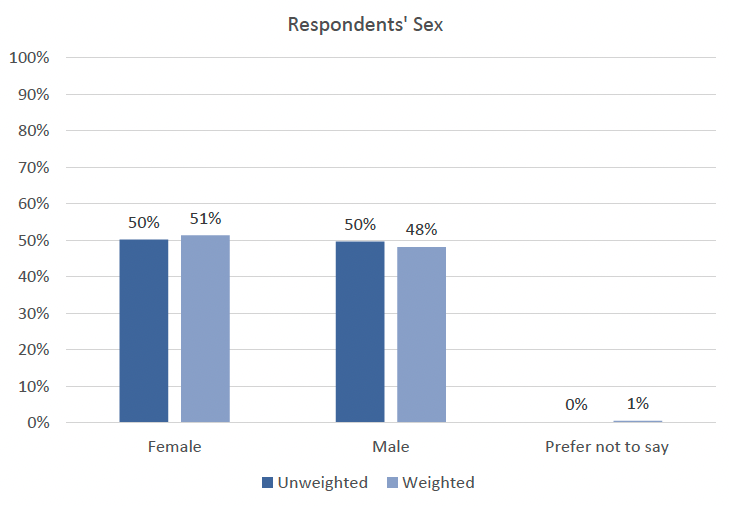
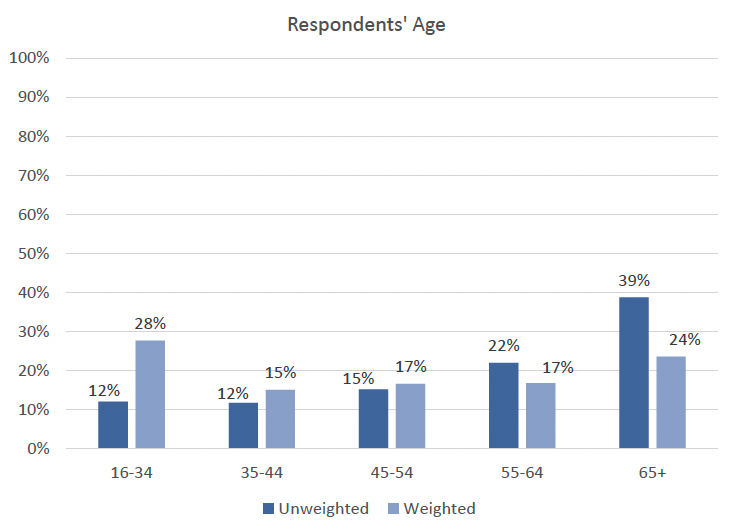
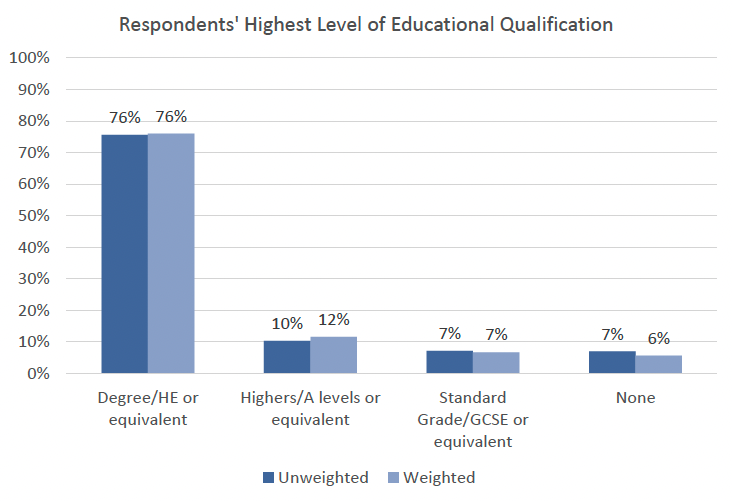
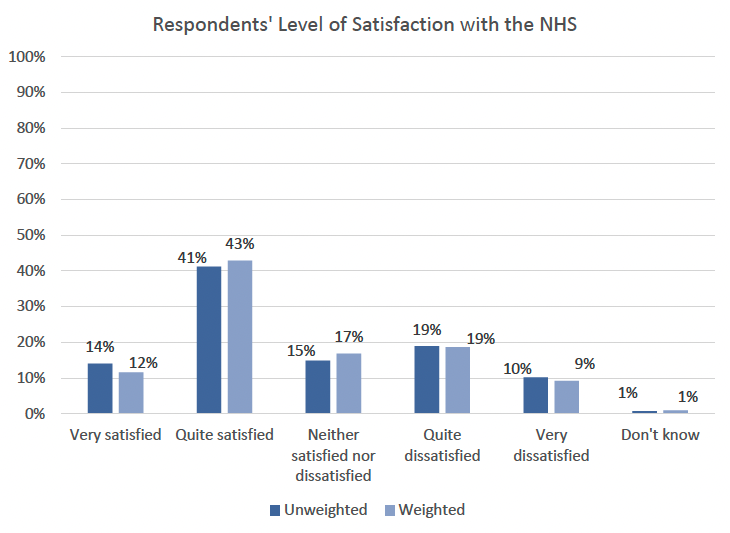
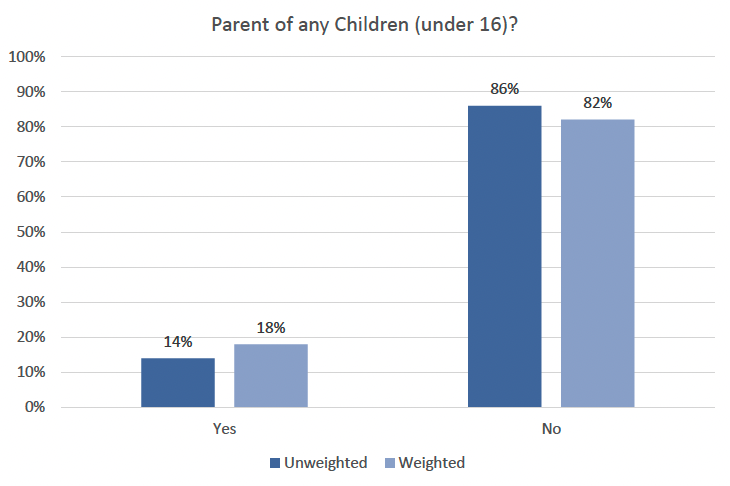
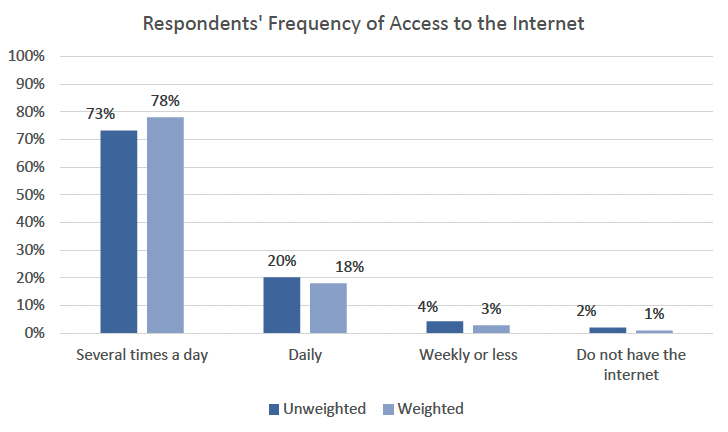
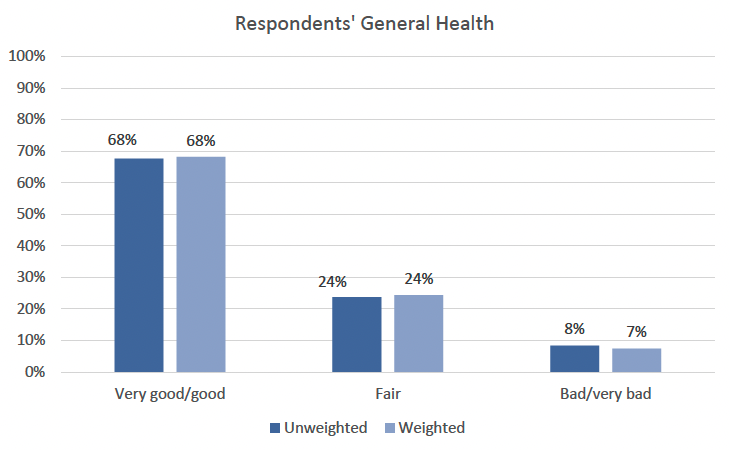
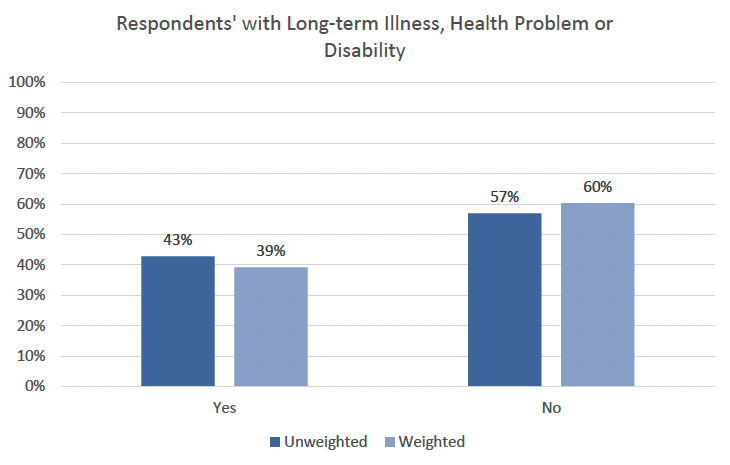
All graphs below are representative of the 1,130 respondents. All percentages used in the results below show weighted and unweighted data. Any figures that note a 0%' indicate that less than 0.5% of respondents selected this answer. The respondents characteristics and demographics were obtained as part of the core module of the SSA 2021/22. Relevant characteristics, such as satisfaction with the NHS, were analysed against the digital services questions shown in this report.

Figure 18: Respondents' sex.

This vertical bar graph shows the respondents’ gender in percentages for both the weighted and unweighted data. The unweighted data shows that 50% were female, 50% were male. The weighted data shows that 51% were female, 48% were male, and 1% preferred not to say.

Figure 19: Respondents' age.

This vertical bar graph shows the respondents age in percentages for both unweighted and weighted data. The unweighted data shows that 12% were 16-34, 12% were 35-44, 15% were 45-54, 22% were 55-64, and 39% were 65+. The weighted data shows that 28% were 16-34, 15% were 35-44, 17% were 45-54, 17% were 55-64, and 24% were 65+.

Figure 20: Respondents' highest level of educational qualification.

This vertical bar graph shows the respondents’ highest level of educational qualification in percentages for both unweighted and weighted data. The unweighted data shows that 76% had a Degree/HE or equivalent, 10% had Highers/A levels or equivalent, 7% had Standard Grade/GCSE or equivalent, and 7% had none. The weighted data shows that 76% had a Degree/HE or equivalent, 11% had Highers/A levels or equivalent, 7% had Standard Grade/GCSE or equivalent, and 6% had none.

Figure 21: Distribution of respondents by SIMD quintile.

This vertical bar graph shows respondents’ geographical location based on the Scottish Index of Multiple Deprivation (SIMD) for both unweighted and weighted data. The unweighted data shows that 9% were in the 20% most deprived areas in Scotland, 14% in category 2, 25% in category 3, and 30% in category 4, and 22% were in the 20% least deprived areas in Scotland. The weighted data shows that 16% were in the 20% most deprived areas in Scotland, 18% in category 2, 22% in category 3, and 25% in category 4, and 19% were in the 20% least deprived areas in Scotland.

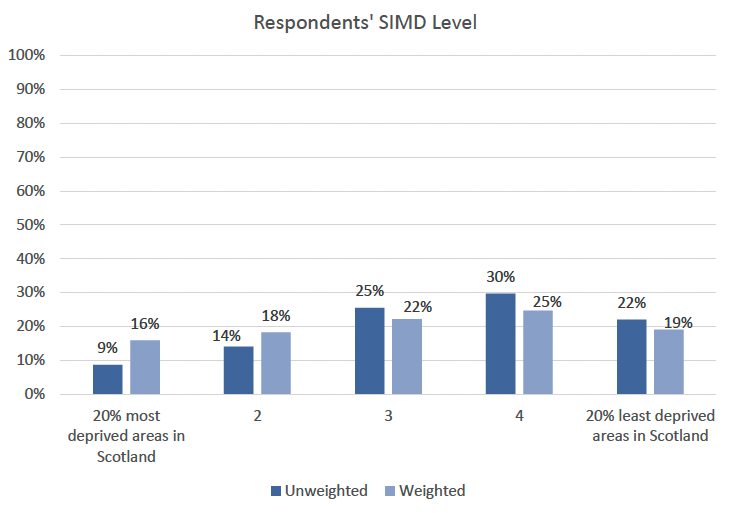
It is important to note that SIMD categorisation of an area is not representative of all the individuals that live within it. There can be individuals experiencing deprivation within areas classed as the 'least deprived'.

Figure 22: Respondents' level of satisfaction with the NHS.

This vertical bar graph shows respondent distribution based on level of satisfaction with the NHS for both unweighted and weighted data. The unweighted data shows that 14% were very satisfied with the NHS, 41% were quite satisfied, 15% were neither satisfied nor dissatisfied, 19% were quite dissatisfied, 10% were very dissatisfied, and 1% did not know. The weighted data shows that 12% of respondents were very satisfied with the NHS, 43% were quite satisfied, 17% were neither satisfied nor dissatisfied, 19% were quite dissatisfied, 9% were very dissatisfied, and 1% did not know.

Figure 23: Respondents with/without any children under 16.

This vertical bar graph shows respondents’ with or without children under the age of 16 based on unweighted and weighted data. The unweighted data shows that 14% did have children under 16 and 86% did not. The weighted data shows that 18% of people did have children under 16 and 82% said they did not.

Figure 24: Respondents' frequency of access to the internet.

This vertical bar graph shows the distribution of respondents’ based on their frequency of access to the internet based on unweighted and weighted data. The unweighted data shows that 73% of respondents’ accessed the internet several times a day, 20% used the internet daily, 4% weekly or less, and 2% did not have the internet. The weighted data shows that 78% of respondents’ accessed the internet several times a day, 18% used the internet daily, 3% weekly or less, and 1% did not have the internet.

Figure 25: Respondents' general health.

This vertical bar graph shows respondents’ based on general health based on unweighted and weighted data. The unweighted data shows that 68% of respondents’ self-reported very good/good health, 24% reported fair general health, and 8% reported bad/very bad general health. The weighted data shows that 68% of respondents’ self-reported very good/good health, 24% reported fair general health, and 7% reported bad/very bad general health.

Figure 26: Respondents' with/without long-term illness, health problem or disability.

This vertical bar graph shows respondent distribution based on long-term illness, health problem or disability based on unweighted and weighted data. The unweighted data shows that 43% of respondents’ self-reported having a long-term illness, health problem or disability and 57% reported that they did not. The weighted data shows that 39% of respondents’ self-reported having a long-term illness, health problem or disability and 60% reported that they did not.

Contact

Email: socialresearch@gov.scot

Back to top