Scottish Social Attitudes Survey 2021/22: public views of telephone and video appointments in general practice
Findings from the Scottish Social Attitudes Survey (2021/22) of public views towards face-to-face and remote appointments in General Practices. The key themes of the research are to understand comfort, ease, influences on, and impacts of remote appointments on public attitudes.
4. Results
This section will summarise the results of the survey in relation to the themes explored for this survey. Each theme will discuss the general overview of the results and any significant differences between respondent demographics or characteristics. Due to the limited number of questions that could be asked, this survey did not capture if respondents had experience of all three (face-to-face, phone, and video) consultations. Thus, the results below are assumed to be the attitudes and perceptions of the Scottish public rather than reporting on personal experience.
In addition, existing evidence outwith this survey may suggest correlations between respondent characteristics and response, for example poor general health and age may be influential in a respondent's answer about which consultation method they prefer. The results below will only explore the significant differences found in this survey data as well as where there were no links to respondent characteristics/demographics.
4.1 Comfort accessing healthcare by video/phone compared with face-to-face
4.1.1 General Overview
In the first theme of 'Comfort accessing healthcare by video/phone compared with face-to-face', people were asked if they would be comfortable talking to their doctor or nurse via a face-to-face, phone, and video appointment separately. In this research analysis, comfort was associated with feelings and attitudes.
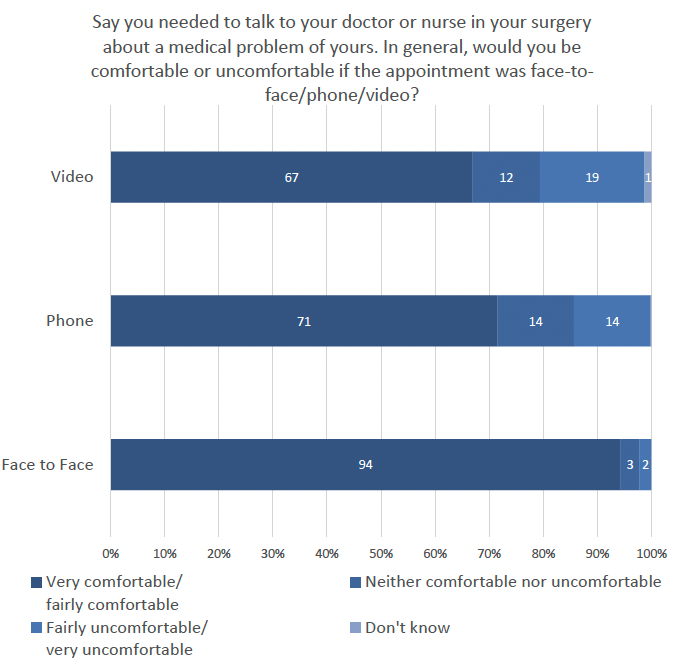
Figure 2 shows that 94% (n=1130) of people thought they would be very/fairly comfortable with face-to-face appointments, compared to phone appointments (71%) and video appointments (67%). This trend reversed for 'fairly/very uncomfortable' where only 2% people thought this was the case for face-to-face appointments, 14% for video, and 19% for video.
4.1.2 Respondents' Characteristics – Significant Differences
There were no significant differences with comfort levels and long-term illness, health problems or disability; Educational qualification; SIMD; and Participants with or without children under 16. Age
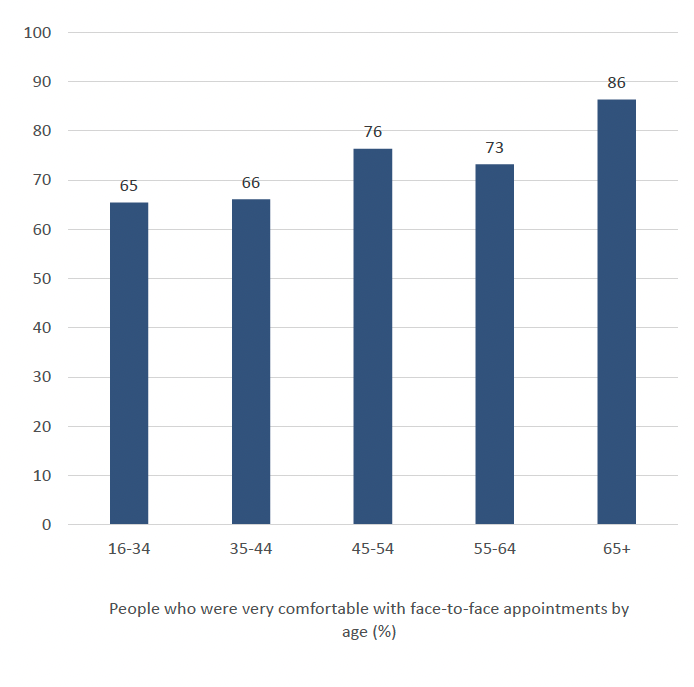
As seen in Figure 3, over half of all age groups selected 'very comfortable' as their response to face-to-face appointments. A significantly higher percentage of those aged 65 and over (86%) were more likely to say that they were 'very comfortable' with a face-to-face appointment than any other age group (n= 267). There were no significant differences found for age in relation to phone or video appointments.
Sex
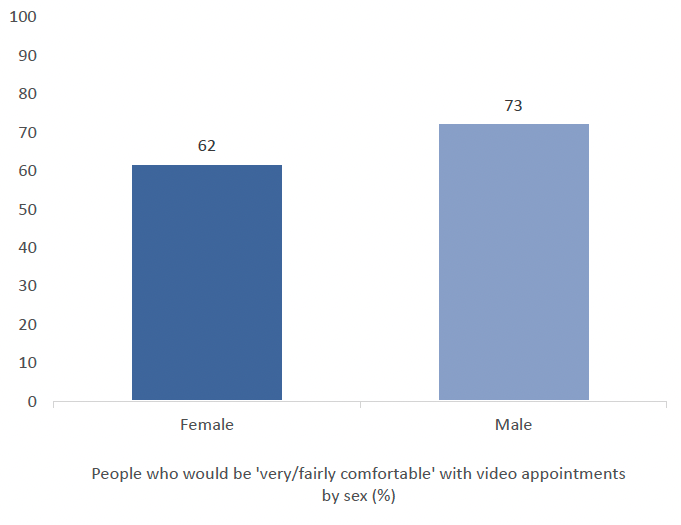
In response, 73% of males (n=544) to this question were more likely to say that they would be 'very/fairly comfortable' with video appointments than females (62%, n=581). The sample size was too small to include a representative sample in 'other/prefer not to say'. There were no significant differences found for face-to-face or phone.
Level of Satisfaction
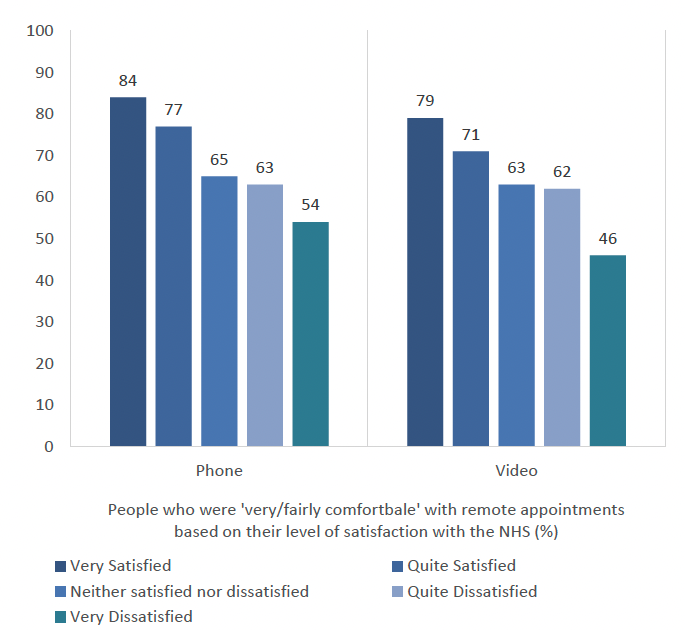
Higher satisfaction with the NHS also emerged as a correlating factor with those were 'very/fairly comfortable' with remote appointments. Those who said they were very (n=131) or quite satisfied with the NHS (n=484) were also more likely to report being 'very/fairly comfortable' with medical appointments over the phone and through video.
The proportion of people who said that they would be 'very/fairly comfortable' for both phone and video appointments decreased as satisfaction with the NHS decreased.
Frequency of Internet Access
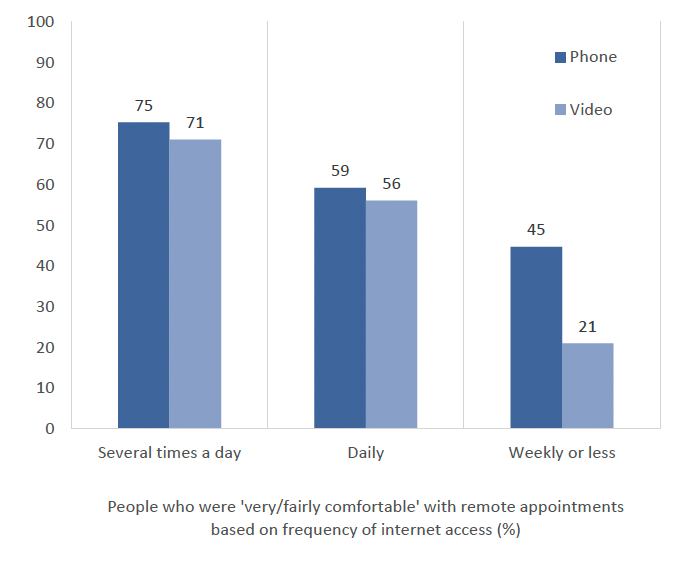
Those who said they were 'very/fairly comfortable' with phone and video appointments were more likely to use the internet 'several times a day' (n=882). A higher percentage of people who used the internet weekly or less said they would be 'very/fairly comfortable' with phone appointments but a lower percentage said the same for video appointments.General Health
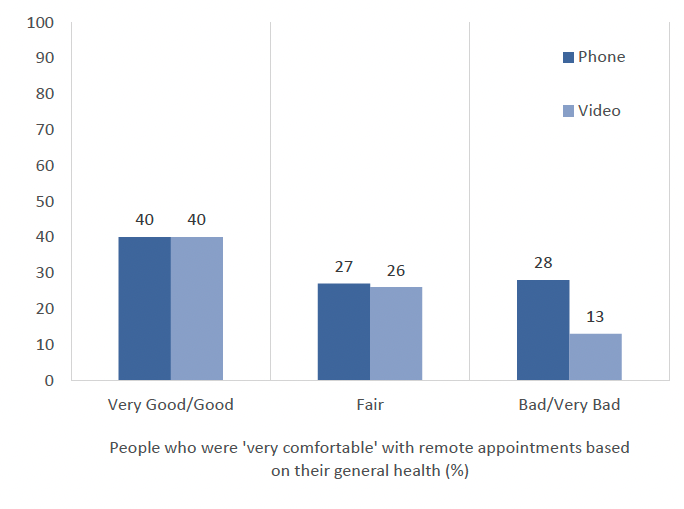
In repsonse to this question, those who reported 'very good/good' general health (n=770) were also more likely to say they would be 'very comfortable' having an appointment over the phone or via video than those with 'fair' or 'bad/very bad' health.
A higher percentage of people with bad/very bad general health said they would be 'very comfortable' with phone appointments, than those who said the same for video appointments.
4.2 Ease of accessing healthcare by video/phone/in-person
4.2.1 General Overview
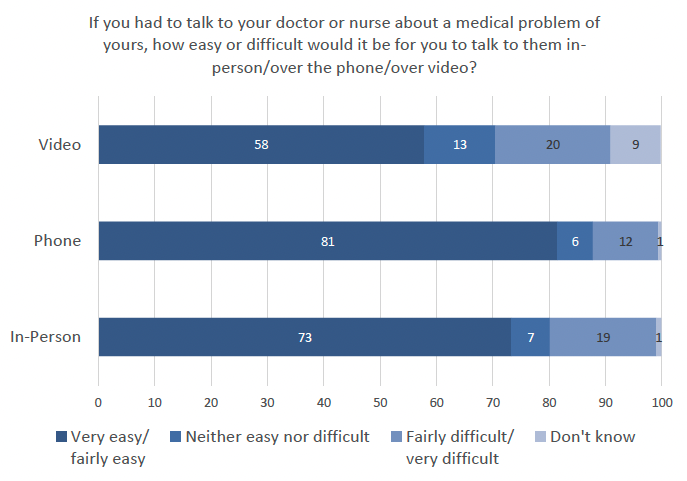
In the theme of general ease of access to appointments, people were asked if they would find it easy talking to their doctor or nurse via a face-to-face, phone, and video appointment separately. In this research analysis, ease was associated with practicalities of attending an appointment. As shown in the graph below, more people selected that phone appointments were easier than those who selected face-to-face or video (n=1130). Those who reported that they 'did not know' for video appointments could suggest that these people do not have experience with this method of consultation.
4.2.2 Respondents' Characteristics - Significant Differences
There were no significant differences with educational qualification; Gender; Age; SIMD; and Participants with or without children under 16.
General Health
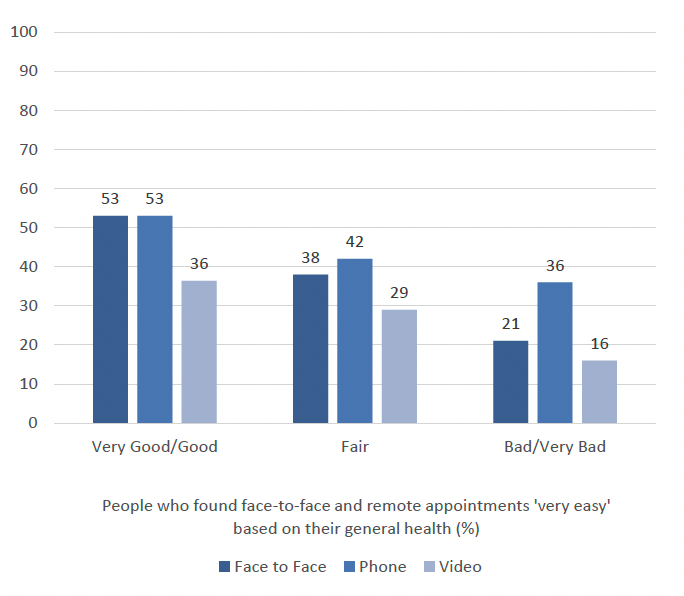
Figure 9 shows that peoples' health could potentially be seen as an influencing factor on ease of attending appointments. In this question, those who reported 'very good/good' general health (n=770) were more likely to say that attending a face-to-face appointment would be 'very easy' (53%). Those who said their health was 'very good/good' were also more likely to say that talking to a doctor or nurse would be 'very easy' than those with 'fair', 'bad/very bad' general health. In addition, those who reported 'very good/good' general health (n=770) were more likely to say that video appointments were 'very easy'' (36%).
Long Term Illness, Health Problem or Disability
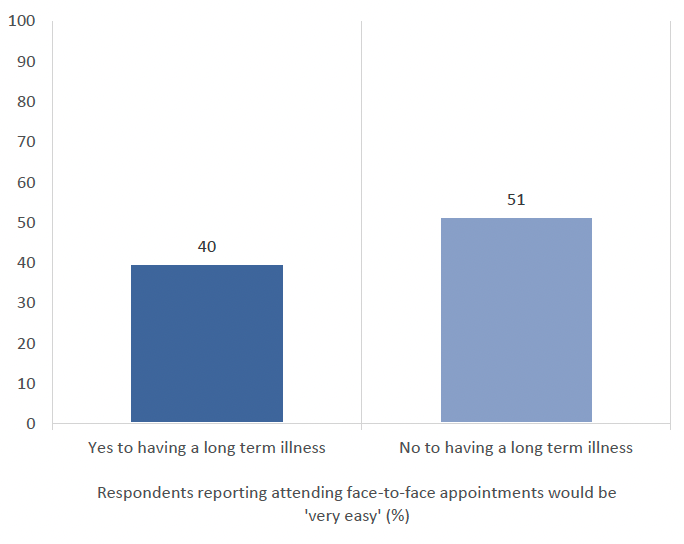
In the above graph, those who reported that they did not have a long-term illness were more likely to say that attending an in-person appointment would be 'very easy' (51% n=682) than those with a long term illness (40%, n=443).
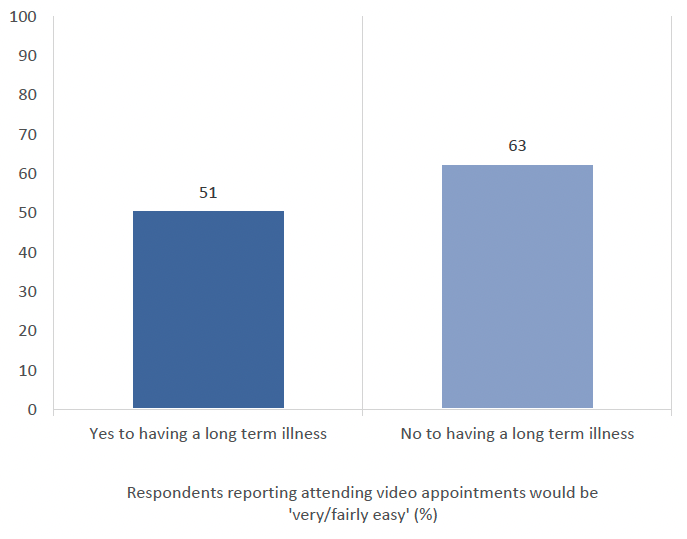
In the above graph, those who said they do not have a long-term illness or disability were more likely to say that video consultations would be 'very/fairly easy' (63%, n=682) than those with a long term illness (51%, n=443).
There were no significant differences between long term illness and phone appointments.
Satisfaction with the NHS
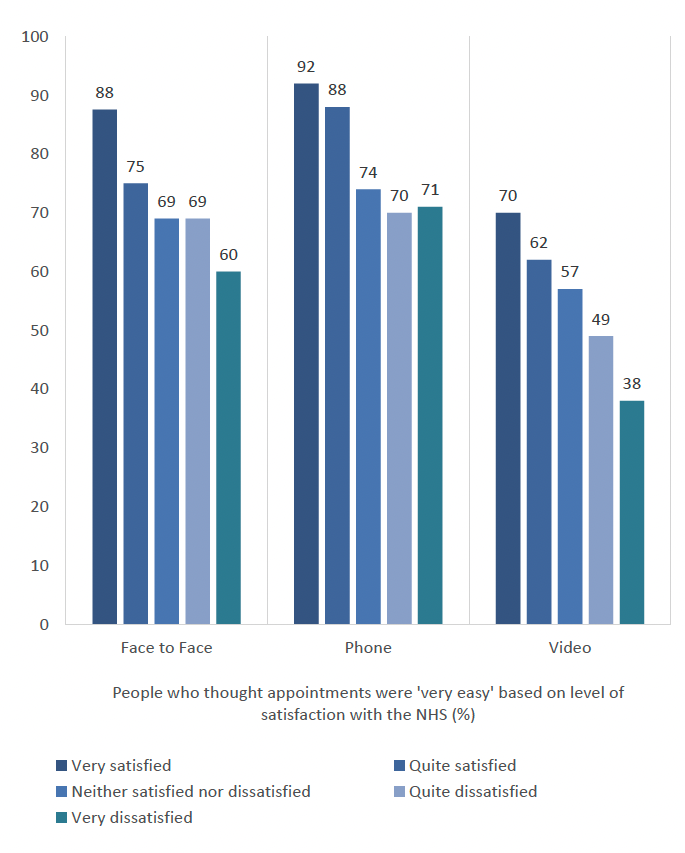
Higher satisfaction with the NHS also emerged as a correlating factor with those who said attending an in-person, video, and phone appointment would be 'very/fairly easy'. The proportion of people who said that these would be 'very/fairly easy' decreased as satisfaction with the NHS decreased.
Frequency of Internet Use
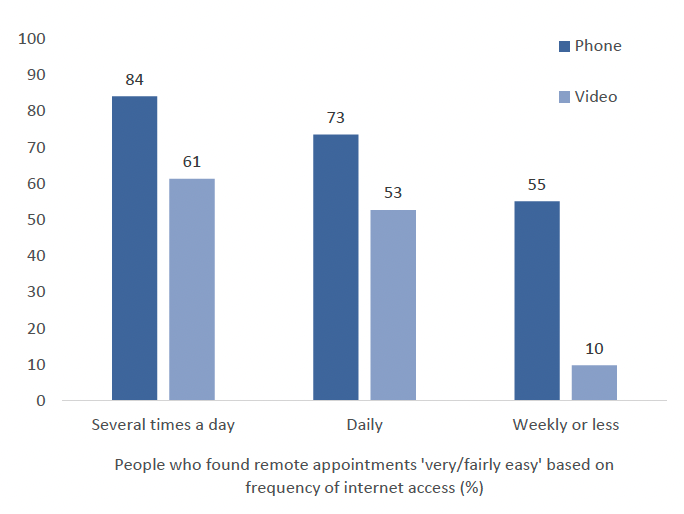
As with levels of comfort with appointments, internet use emerged as a factor contributing to phone and video appointments. Those who reported using the internet 'several times a day' were also the most likely to say that talking to their doctor or nurse via phone or video would be 'very/fairly easy'. As internet access would be required to attend a video appointment these results are not surprising.
4.3 What impacts people's chosen method of accessing healthcare?
People in Scotland were asked what mattered most to them when considering whether to accept a remote appointment over a face-to-face appointment.
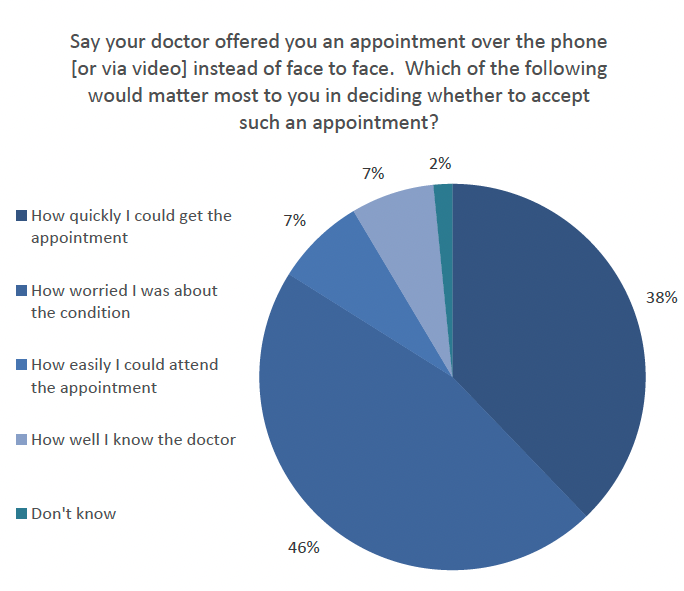
As shown in figure 14 above, 46% (n=1130) of people in this research stated that how worried they were about their condition would dictate whether they would accept a remote appointment over face-to-face. The next most frequent answer was based on how quickly they could get an appointment (38%, n=1130).
There were no noted significant differences in the data related to any characteristic or demographic variables.
4.4 Use of remote services (in place of face-to-face)
4.4.1 General Overview
People in Scotland were asked whether they agreed or disagreed with four hypothetical impacts from different modes of appointment in general practice.
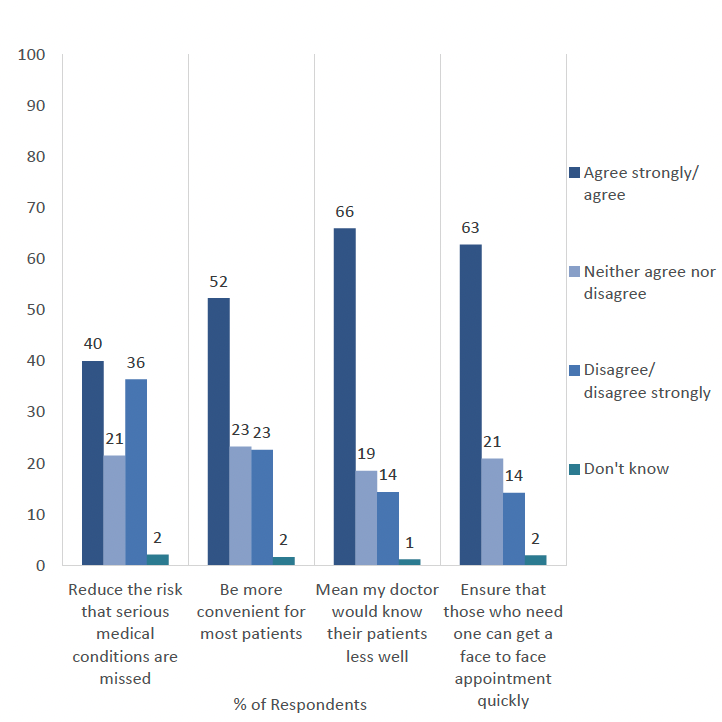
Shown in Figure 15, people (n=1130) were asked about increasing remote appointments.
- 66% agreed or strongly agreed that this meant that their doctor would know their patients less well
- 63% agreed or strongly agreed that it would ensure those who needed a face-to-face appointment would get one quickly.
Those who did not know may highlight those who have had no experience of remote appointments and, thus, could not comment on the above question with certainty.
4.4.2 Respondent Characteristics Significant Differences
Only two significant differences were found in relation to two of the scenarios, general health and patient-doctor relationship as well as people with/without children under 16 and convenience of appointment. There were no significant differences found in relation to any of the other demographic variables such as age or gender. There were no significant differences related to the respondent characteristics variables for the other two attitudes in this question: 'reducing the risk that serious medical conditions are missed' or that remote appointments 'would ensure that those who need one can get a face-to-face appointment'.
General Health
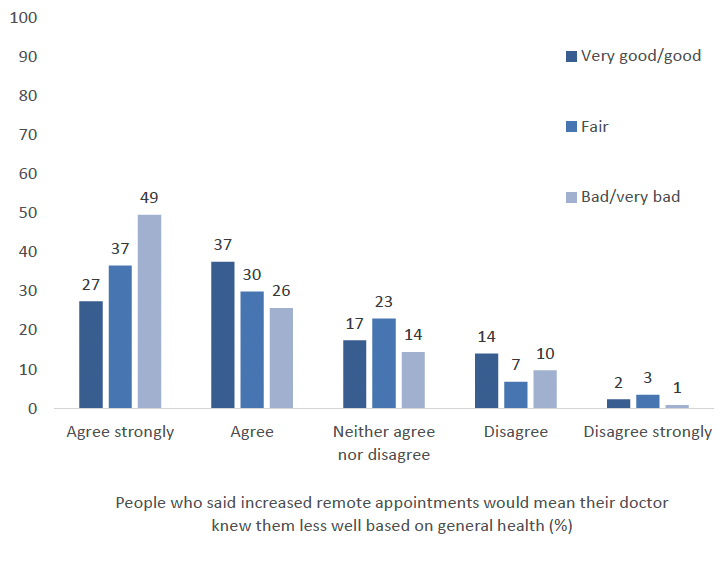
In response to this question, people with 'bad/very bad' general health were more likely to select 'agree strongly' (49% n=84) to the assumption that doctors may know their patients less well if there was an increase in remote appointments (replacing face-to-face).
People with/without children under 16
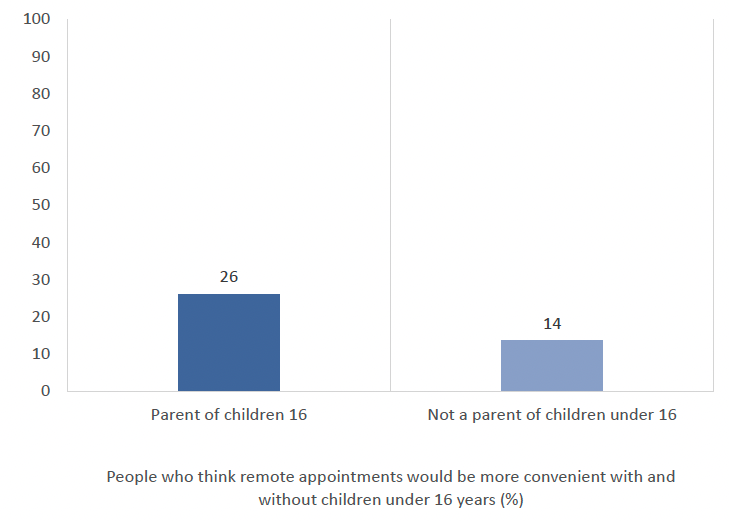
There is a significant difference in convenience of appointment and having children under 16 to care for. Those with children under 16 were more likely to 'agree strongly' (26%, n=203) that remote appointments would be more convenient for most patients in comparison to those without children under 16 (14%, n=927).
Contact
Email: socialresearch@gov.scot