Scottish social attitudes survey 2021/22: Attitudes to Scotland's handling of the pandemic
Findings from the Scottish Government funded Scottish Social Attitudes Survey 2021/22 ‘Attitudes to Scotland’s Handling of the Pandemic’ module.
Chapter 2 – Views on the use of data and science during the pandemic
This chapter examines peoples’ views on the use of data and science during the pandemic and how these attitudes differed by demographic and attitudinal variables. It addresses the following key questions:
- How much, if at all, did people trust the data provided during the pandemic about the spread of coronavirus?
- How much did people trust the information provided by scientists during the pandemic?
- How much did people trust the information provided by the Scottish Government during the pandemic?
- How much did people feel the Scottish Government relied on the evidence provided by scientists?
- How much did people feel the Scottish Government were influenced by the views of the public?
Levels of trust
Trust in the data provided about the spread of coronavirus
To determine the level of trust people had in the data available to them about the spread of coronavirus, all respondents were asked how much, if at all, they trusted the data provided during the pandemic. The responses to this question are summarised in Table 2.1 below.
| (%) | |
|---|---|
| A great deal | 37 |
| Quite a lot | 30 |
| Somewhat | 19 |
| Not very much | 10 |
| Not at all | 4 |
| Don’t know/Refusal | 0 |
| Weighted base | 1130 |
| Unweighted base | 1130 |
Base: All respondents
Overall, people trusted the data that was made available to them during the pandemic about the spread of coronavirus. Around two thirds (67%) trusted the data that was provided ‘a great deal/quite a lot’, compared with a fifth (19%) who trusted the given data ‘somewhat’, and 14% who trusted it ‘not very much/not at all’.
How do these attitudes vary by sub-group?
Levels of trust in the data provided during the pandemic varied by attitudes towards trusting others and perceived feelings of social support. Those who felt most people can be trusted were more likely to trust the data provided during the pandemic ‘a great deal/quite a lot’ (79%) while this was lower among those who felt they ‘can’t be too careful in dealing with people’ (49%).
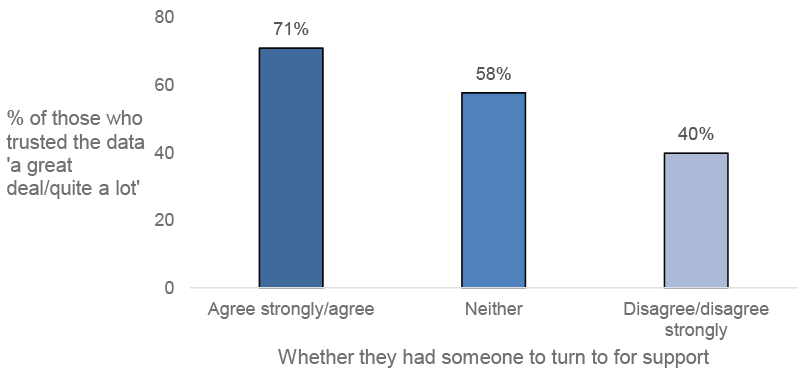
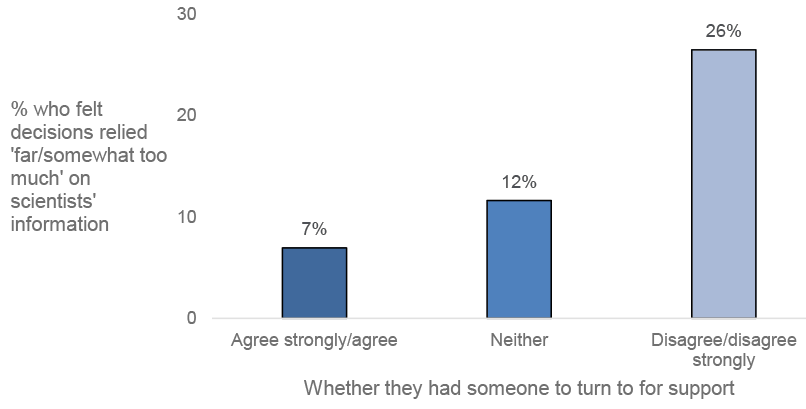
Likewise, as reported in Figure 2.1, a difference was observed between those who said they ‘agree/agree strongly’ (71%) that they had someone to turn to for advice and support, and those who said they ‘disagree/disagree strongly’ (40%) that this was the case.
Base: All respondents
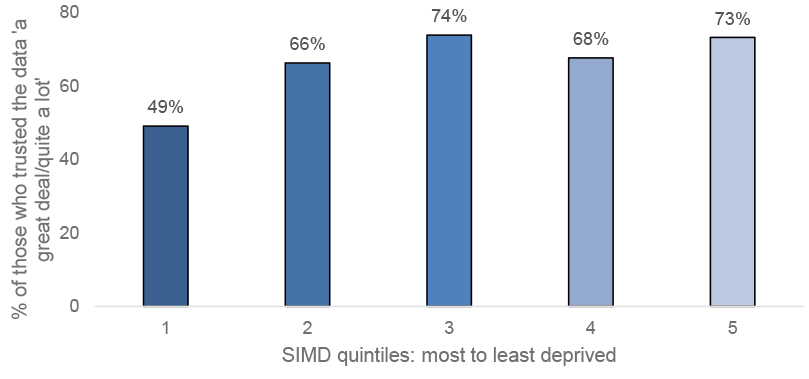
Results also varied by level of deprivation. As reported in Figure 2.2, those living in the most deprived areas of Scotland (SIMD1) were significantly less likely to trust the data provided ‘a great deal/quite a lot’ (49%) than those living in the other SIMD quintiles (66-74%).[26]
Base: All respondents
There was also variation according to the level of educational attainment with those with a degree/higher education most likely to trust the data ‘a great deal/somewhat’ (73%) compared with those with highers/A levels (49%) or standard grades/GCSEs (40%). Those stating that they have no qualifications reported high levels of trust (67%) compared to those with lower level qualifications.
Trust in the information provided by scientists
People were asked how much they trusted the information provided by scientists during the pandemic. Table 2.2 summarises these responses.
| (%) | |
|---|---|
| Just about always | 47 |
| Most of the time | 34 |
| Only some of the time | 15 |
| Almost never | 3 |
| Don’t know/Refusal | 1 |
| Weighted base | 1130 |
| Unweighted base | 1130 |
Base: All respondents
The results showed a high level of trust in the information given by scientists. The majority (81%) trusted the information provided by scientists during the pandemic ‘just about always’ or ‘most of the time’, with almost half (47%) feeling this way ‘just about always’. In comparison, 15% said they trusted the information given by scientists ‘only some of the time’ while just 3% felt they ‘almost never’ trusted such information.
How do these attitudes vary by sub-group?
There were again associations in the level of trust reported in the information provided by scientists by how generally trusting respondents were of others and how much social support they experienced. The vast majority of those who felt that most people can be trusted said they trusted the information provided by scientists ‘just about always/most of the time’ (89%), compared with two thirds (68%) of those who felt they ‘can’t be too careful in dealing with people’. Similarly, 84% of those who ‘agree/agree strongly’ that they had people to turn to reported that they trusted the information provided by scientists, whilst 65% of those who ‘disagree/disagree strongly’ that they had people to turn to trusted such information.
There was also an association between whether people had or suspected they had contracted Covid and levels of trust in information provided by scientists. Just under nine in ten (87%) of those who had Covid confirmed by test indicated that this was the case ‘just about always/most of the time’ compared with around eight in ten (81%) of those who did not think they had contracted Covid and around seven in ten (71%) of those who did but had not had it confirmed by a test.
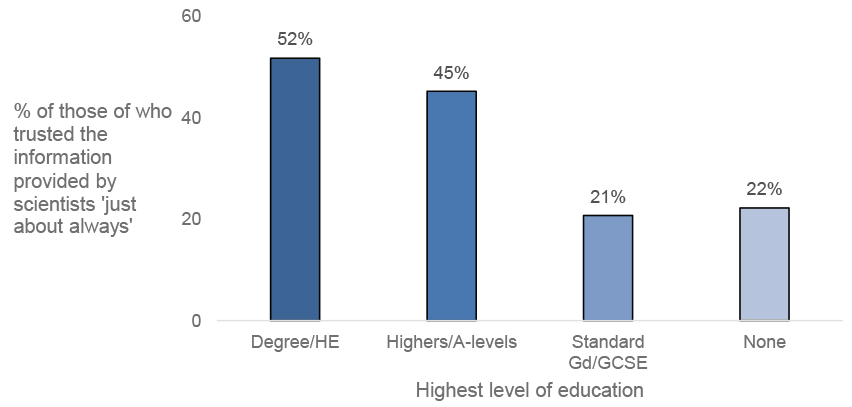
In addition, as shown in Figure 2.3 below, just over half (52%) of those who held a degree/equivalent said they trusted the information provided by scientists ‘just about always’, compared with around one-fifth of those with Standard Grades or an equivalent qualification (21%) and of those with no qualifications (22%).
Base: All respondents
Trust in the information provided by the Scottish Government
Attitudes towards the information provided during the pandemic by the Scottish Government were also measured. These responses are summarised in Table 2.3.
| (%) | |
|---|---|
| Just about always | 38 |
| Most of the time | 36 |
| Only some of the time | 19 |
| Almost never | 7 |
| Don’t know/Refusal | 1 |
| Weighted base | 1130 |
| Unweighted base | 1130 |
Base: All respondents
Just under two-fifths indicated that they trusted the information provided by the Scottish Government during the pandemic ‘just about always’ (38%) and a similar proportion (36%) said that they did so ‘most of the time’. Smaller proportions indicated that they trusted such information from the Scottish Government ‘only some of the time’ (19%) or ‘almost never’ (7%).
How do these attitudes vary by sub-group?
Similarly, trust in the data provided by the Scottish Government during the pandemic varied according to trust in others and experience of social support. The majority (83%) of those who felt most people can be trusted also trusted the information provided by the Scottish Government ‘just about always/most of the time’ compared with 59% of those who felt they ‘can’t be too careful in dealing with people’. In addition, 78% of those who said they ‘agree/agree strongly’ that they had someone to turn to for advice and support trusted the information provided by the Scottish Government ‘just about always/most of the time’ compared with 52% of those who indicated that they ‘disagree/disagree strongly’ that they have someone to turn to.
Higher educational attainment was associated with a higher level of trust in the information provided by the government. Among those with a degree or equivalent, 77% trusted the information provided ‘just about always/most of the time’ compared with 69% of those with Highers or equivalent and 43% of those with Standard Grades or equivalent. However, there was also a comparably fairly high level of trust among those with no qualifications (73%).
How do attitudes vary in levels of trust according to the source of information on the pandemic?
The responses demonstrated that the majority of the public trusted the information provided by the Scottish Government during the pandemic. Albeit, a lower proportion trusted such information compared with information given by scientists.
Base: All respondents
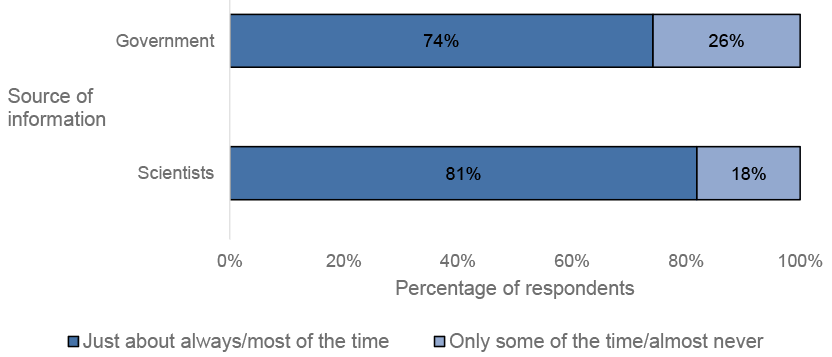
Three quarters of people (74%) said they trusted the information provided by the Scottish Government ‘just about always/most of the time’, a lower proportion than the 81% who reported this same level of trust in the information provided by scientists. A quarter (26%) felt they trusted the information given by the Scottish Government ‘only some of the time/almost never’ compared with 18% who felt this way in relation to the information given by scientists.
Views on the route of the decisions made
The use of science in decisions made
To gauge attitudes towards the use of science in Scotland’s handling of the pandemic, respondents were asked to give their opinion on whether the decisions made relied enough on evidence provided by scientists, as summarised in Table 2.4.
| (%) | |
|---|---|
| Far too much | 3 |
| Somewhat too much | 6 |
| About right | 72 |
| Somewhat too little | 13 |
| Far too little | 4 |
| Don’t know/Refusal | 3 |
| Weighted base | 1130 |
| Unweighted base | 1130 |
Base: All respondents
Just under three quarters (72%) felt that the level of reliance on evidence provided by scientists in influencing decisions was ‘about right’. A greater proportion (17%) felt that there was ‘somewhat too little/far too little’ reliance on scientific evidence than felt that this was ‘far too much/somewhat too much’ (9%).
How do these attitudes vary by sub-group?
As before, attitudes towards the reliance on evidence provided by scientists to make decisions varied significantly by people’s levels of trust and social support. Those who felt most people can be trusted were less likely to feel the decisions made relied ‘far/somewhat too much’ on the information provided by scientists than those who felt they ‘can’t be too careful in dealing with people’ (6% and 14% respectively). This was in line with the finding that the majority of those who felt that most people can be trusted said they trusted the information provided by scientists (89%) and the Scottish Government (83%) ‘just about always/most of the time’ compared with 68% (in relation to information from scientists) and 59% (in relation to information from the Scottish Government) of those who felt they can’t be too careful in dealing with people.
As shown in Figure 2.5, just 7% of those who ‘agree/agree strongly’ that they had someone to turn to for advice and support felt the decisions made relied ‘far/somewhat too much’ on the information provided by scientists, compared with 26% of those who ‘disagree/disagree strongly’ that they had someone to turn to. This is similar to the finding that those who ‘agree/agree strongly’ that they had people to turn to for advice and support were more likely to trust the information provided by scientists (84%) and the Scottish Government (78%) compared with 65% of those who ‘disagree/disagree strongly’ that they have someone to turn to (65% in relation to information from scientists) and 52% (in relation to information from the Scottish Government).
Base: All respondents
The influence of public views on decisions made
To determine attitudes towards the role of public opinion on Scotland’s handling of the pandemic, respondents were asked how much they think the decisions made were influenced by the views of the public. These responses are summarised in Table 2.5.
| (%) | |
|---|---|
| Far too much | 4 |
| Somewhat too much | 12 |
| About right | 61 |
| Somewhat too little | 13 |
| Far too little | 5 |
| Don’t know/Refusal | 4 |
| Weighted base | 1130 |
| Unweighted base | 1130 |
Base: All respondents
Six out of ten (61%) felt that the amount of influence the views of the public had on decisions made was ‘about right’. A similar proportion felt that the reliance on the public’s views to make decisions was ‘somewhat/far too little’ (18%) as felt this was ‘far/somewhat too much’ (16%).
How do these attitudes vary by sub-group?
Perceptions of the influence of the public’s views on the decisions made during the pandemic varied by demographic information and life circumstances, such as household composition, age and coronavirus status, which showed less or no association with the previous attitudinal questions.
Those who lived with at least one other person over the age of 16 were more likely to feel the decisions made were influenced ‘far too much’ by the public than those who lived alone (6% and 1% respectively), albeit this perception was low overall (4%).
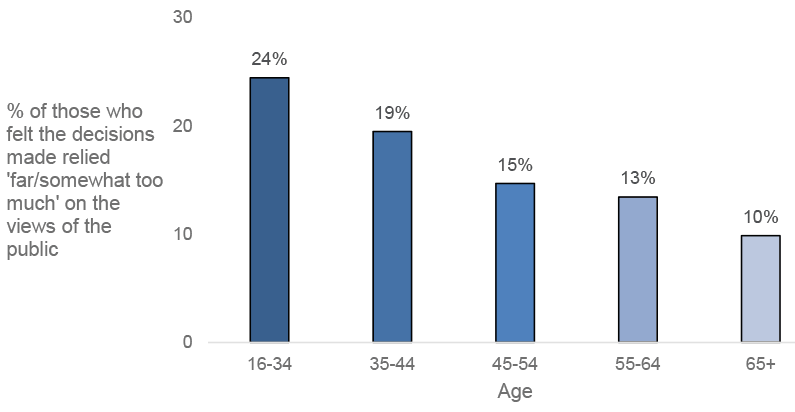
As shown in Figure 2.6 below, there is a linear relationship between this perception and age, with those aged 16-34 over twice as likely (24%) to have felt that the decisions made were influenced ‘far/somewhat too much’ by the public than those aged 65 and over (10%).
Base: All respondents
Base: All respondents
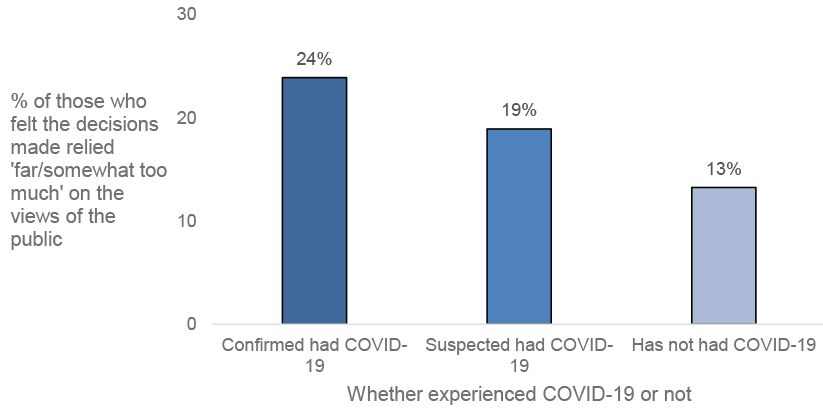
As shown in Figure 2.7, differences in attitudes towards perceived levels of public influence on decision making were also associated with whether or not people had tested positive for coronavirus. Just under a quarter (24%) of those who tested positive felt that the decisions made were influenced ‘far/somewhat too much’ by the public compared with 13% of those who did not think they had experienced having coronavirus.
These demographic associations were in addition to those according to social trust and support. Around a fifth of those who felt you ‘can’t be too careful in dealing with people’ indicated that public opinion was relied on too much (22%) compared with 14% of those who felt that ‘most people can be trusted’.
Just over a quarter of those who indicated that they ‘disagree/disagree strongly’ that they have people to turn to (27%) felt that public opinion was relied on too much compared with 15% of those who ‘agree/agree strongly’ that they have others to turn to.
How do attitudes compare between whether decision making during the pandemic sufficiently relied on science or public views?
Attitudes towards the level of reliance on views of the public to influence decisions made in Scotland during the pandemic differed from perceptions towards the level of reliance on evidence from scientists.
Base: All respondents
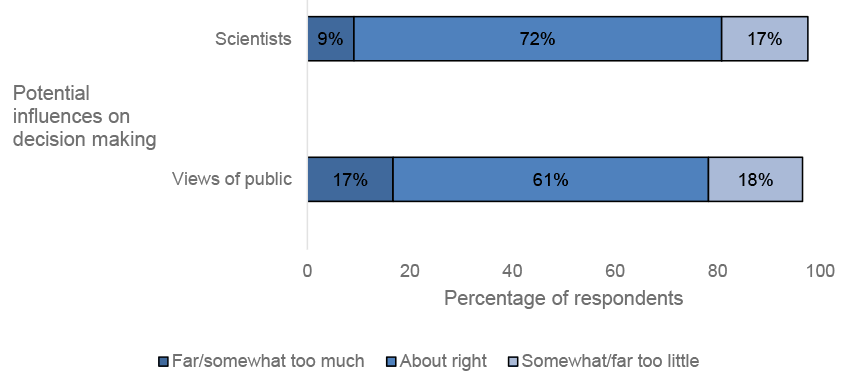
Most felt the decisions made were based on about the right amount of reliance on both science and public opinion, although a higher proportion thought this was the case for reliance on scientific evidence (72%) compared with views of the public (61%).
Looked at side by side, a higher proportion felt there was too much reliance on the views of the public (17%) compared with evidence provided by scientists (9%). Similar proportions felt there was ‘somewhat/far too little’ reliance on the views of the public and evidence provided by scientists (17% and 18% respectively).
Contact
Email: socialresearch@gov.scot