Scottish Social Attitudes survey 2021/22: attitudes data
Findings from the Scottish Government funded Scottish Social Attitudes Survey 2021/22 Core Module
Chapter 4: Political engagement and levels of social trust
This chapter outlines the level of political engagement and social trust among people in Scotland. Social trust, for the purposes of this chapter, can be defined as
"confidence in the moral orientation or trustworthiness of our fellow citizens…[levels of social trust] play an important role in how secure individuals feel and how well society functions."[40]
Specifically, the following research questions are addressed:
Is voting in each type of election deemed to be equally important, or is voting in some considered to be more important than in others?
Do people feel that others be trusted and that there are people in their local area that can be turned to for help and support?
This chapter also provides an analysis of how political engagement and levels of social trust differ between various subgroups.
Importance of voting
All respondents were asked how important they thought it was to vote in Scottish Parliament, UK House of Commons and local council elections. Although the majority of people felt that it was 'very important' to vote in each of the three elections, as shown in Table 4.1, there was a slight variation in how important it was considered to be to vote in each one.
| Scottish Parliament (%) | UK House of Commons (%) | Local council (%) | |
|---|---|---|---|
| Very important | 88 | 78 | 72 |
| Fairly important | 9 | 14 | 23 |
| Not very important | 2 | 4 | 4 |
| Not important at all | * | 3 | 1 |
| Don't know/Refused | * | * | * |
| Unweighted base | 1130 | 1130 | 1130 |
Base: all respondents
Just under 9 in 10 people (88%) living in Scotland felt that it was 'very important' to vote in Scottish Parliament elections. This was ten percentage points higher than the 78% of people who felt it was 'very important' to vote in UK House of Commons elections, and 16 percentage points higher than the proportion who thought it 'very important' to vote in local council elections (72%).
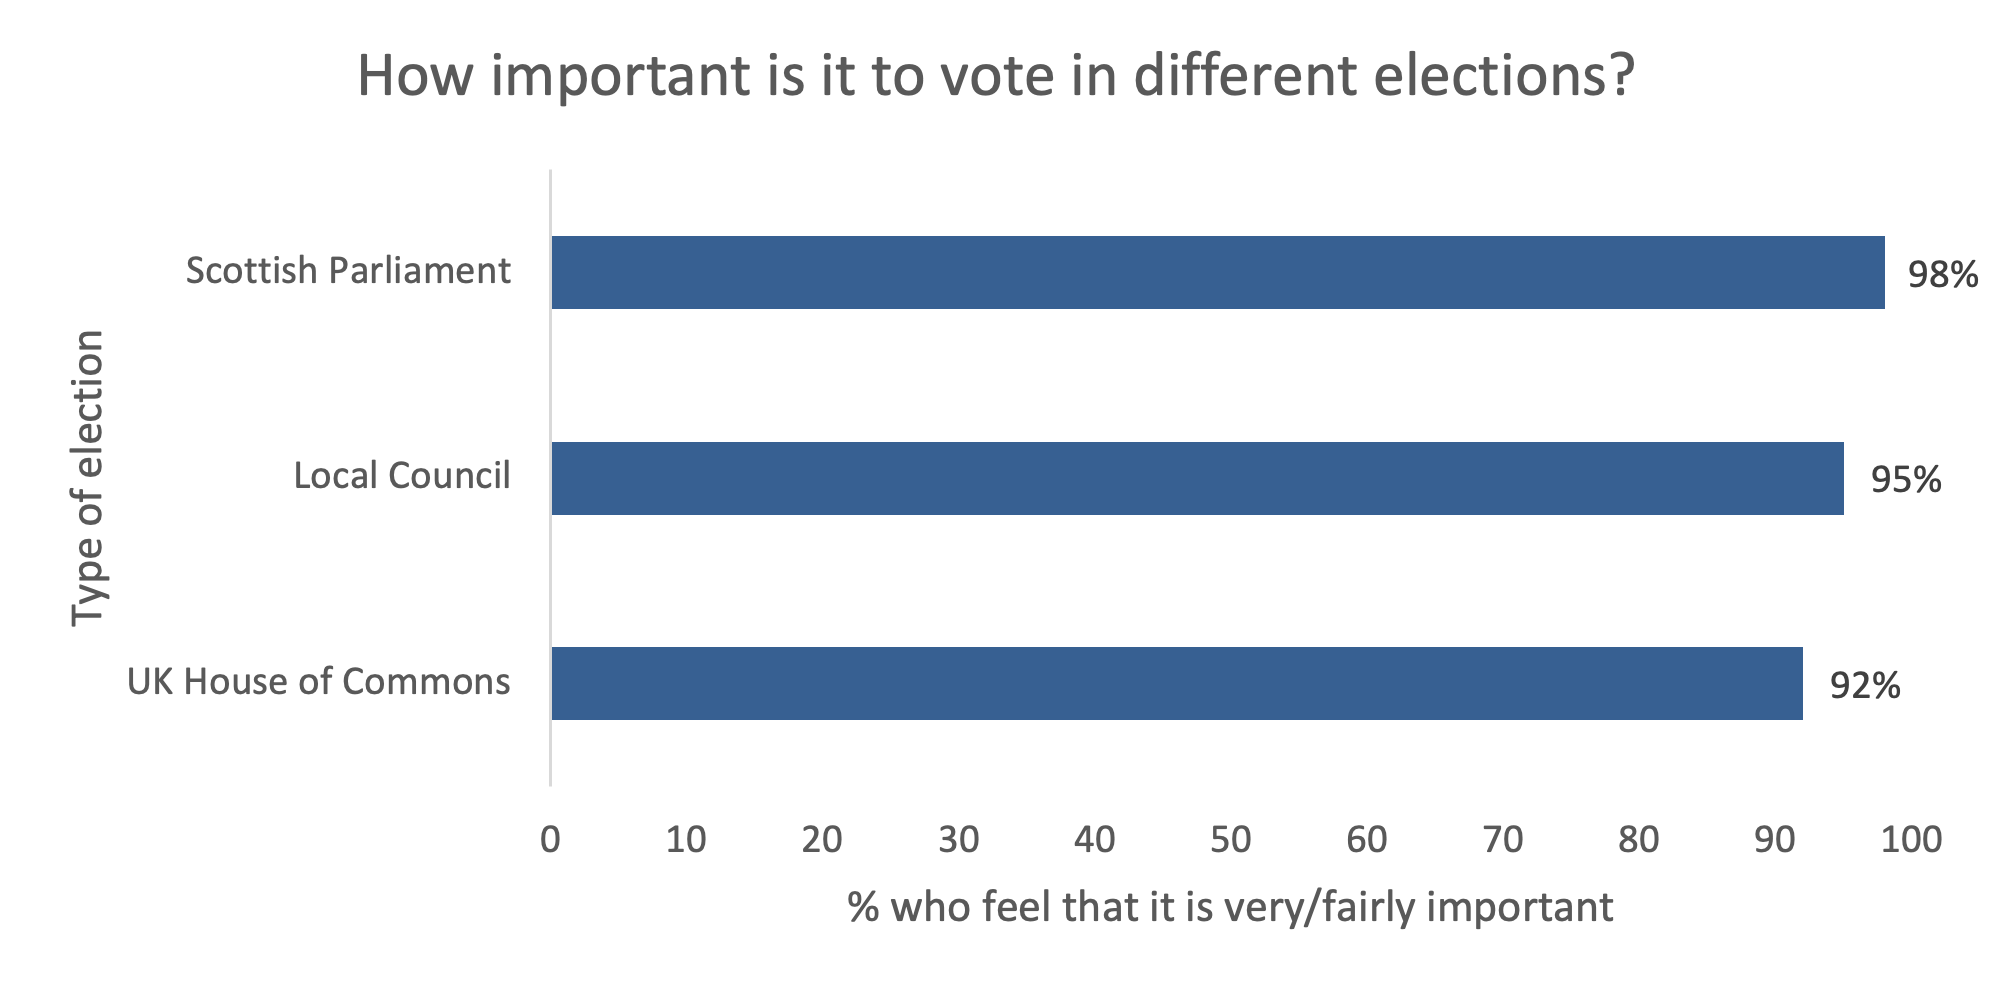
When examining overall importance by combining the categories of 'very important' and 'fairly important', the vast majority of people in Scotland regarded these three elections as important; 92% said so of the House of Commons elections, 95% of Local Council elections and 98% of Scottish Parliament elections. These figures are depicted in Figure 4.1:
Base: all respondents
How do these attitudes vary between sub-groups?
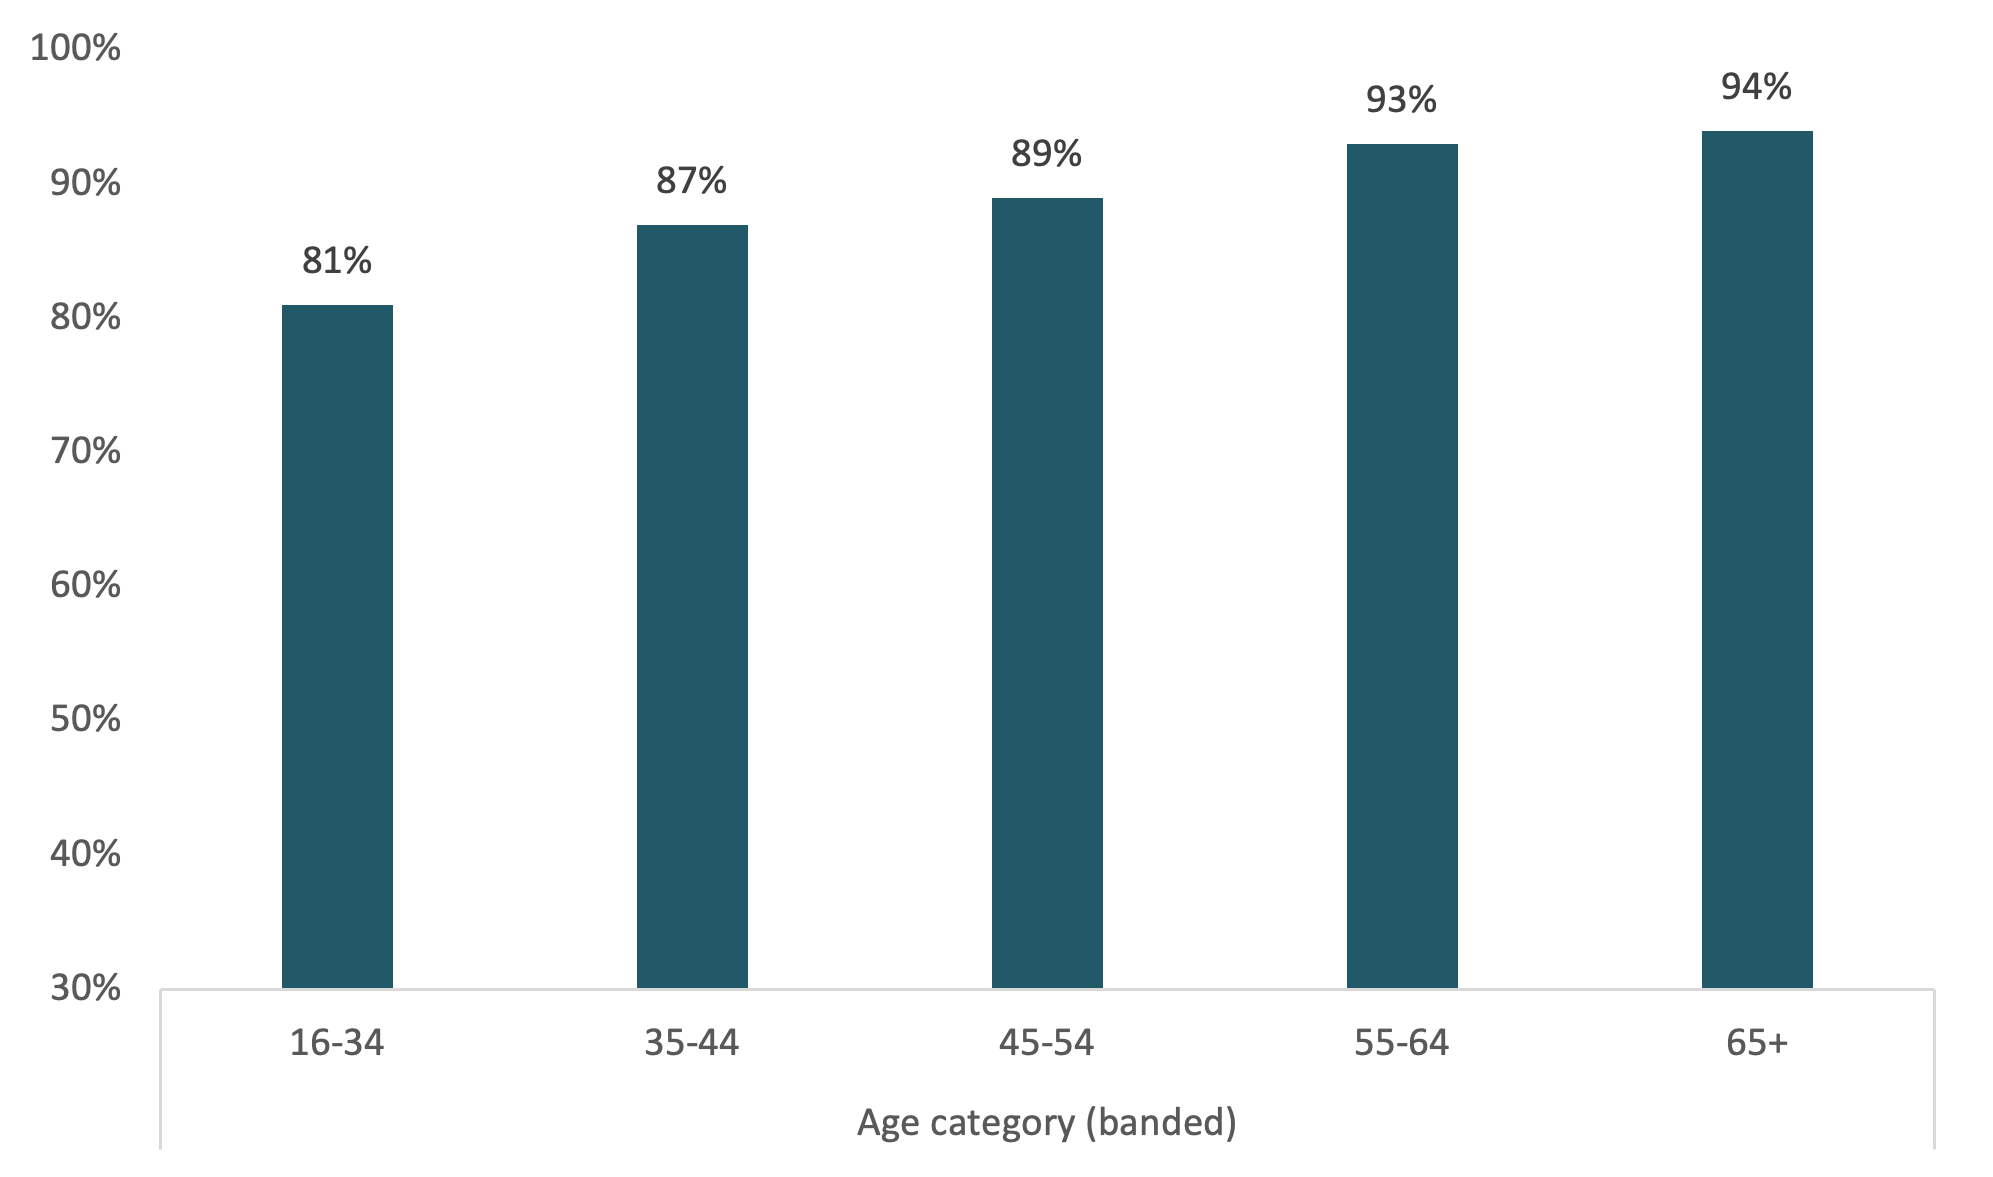
The proportion of people who felt that it was 'very' important to vote in Scottish Parliament elections was higher among older people. The vast majority of those (94%) aged 65 and over felt that it was 'very' important compared with around 8 in 10 (81%) people aged 16-34, as shown in Figure 4.2 below. There was an association with perception of income, whereby nearly all (98%) of those living 'really comfortably' on their present income felt that it was 'very important' compared with 86% of those struggling or really struggling on their present income. There was also variation by social values, with 93% of those on the left rating Scottish Parliament elections as 'very important' compared with 82% of their right-wing counterparts.
Unsurprisingly, there was an association between interest and participation in politics and the level of importance attributed to voting in Scottish Parliament elections. Those who had a greater interest in politics were more likely to think voting in Scottish Parliament elections was important than their counterparts: the vast majority (97%) who had 'a great deal' of interest in politics thought it to be 'very important' to vote in Scottish Parliament elections, compared with 73% of those with 'not very much' or 'no interest' in politics. Attitudes also varied by views on Europe with 91% of Remainers saying these elections are 'very important' compared with 83% of Leavers, and by constitutional preference, with 92% of independence supporters compared with 84% of opponents believing Scottish Parliament elections 'very important'.
Base: all respondents who said it was 'very important' to vote in Scottish Parliament elections (n=1009)
There was an association between socioeconomic status and the level of importance attributed to voting in UK House of Commons elections. Over eight in ten (82%) of those in the highest household income quartile felt that it was 'very important' to vote in UK House of Commons elections, compared with 61% of those in the lowest income quartile. Over six in ten (62%) of those who reported 'struggling' or 'really struggling' on their present income thought it was 'very important' to vote in UK House of Commons elections. In comparison, 91% of those who were 'living really comfortably' on their present income felt the same way.
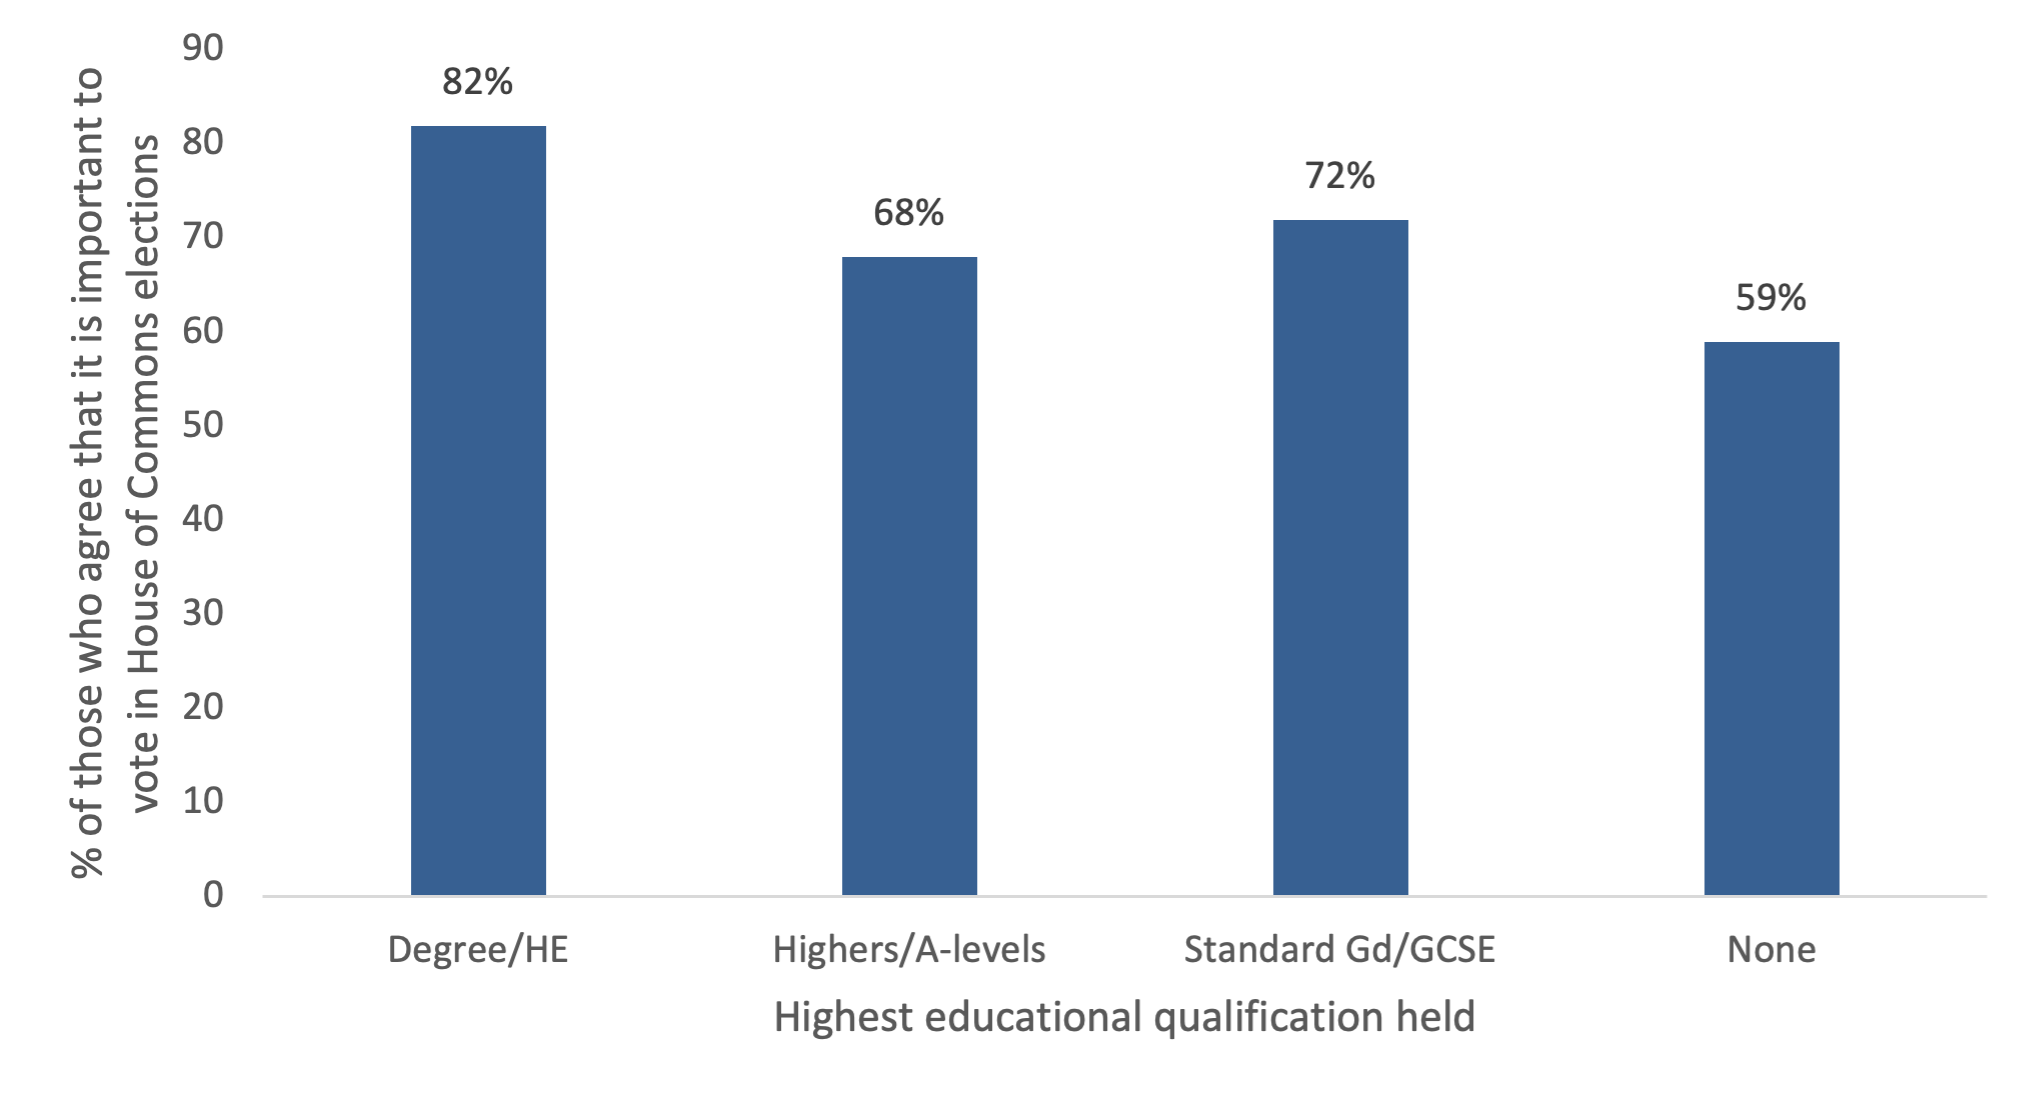
People with no educational qualifications were less likely than their counterparts to think it was important to vote in House of Commons elections. As shown in Figure 4.2, just under six in ten (59%) of those who had no qualifications felt that it was 'very important' to vote in this type of election. The proportion increased to 82% for those who held a degree or other higher education qualification.
Base: all respondents who said it was 'very important' to vote in elections to the UK House of Commons (n=910)
As with the Scottish Parliament elections, there was a relationship between a person's level of interest and participation in politics and their attributing greater importance to voting in UK House of Commons elections. Nearly nine in ten (88%) of those who had 'a great deal of interest' in politics felt it was 'very important' to vote in UK House of Commons elections, compared with nearly six in ten (58%) of those who had 'not very much' interest in politics or 'none at all'.
There was a clear linear relationship between educational level and feelings around the importance of voting in local elections. Three-quarters of those who held a degree or other higher education qualification felt that it was 'very important' to vote in their local council elections, followed by 70% of those with a Scottish Higher or A-level, 56% of those with a Standard Grade/GCSE, and 58% of those who had no qualifications.
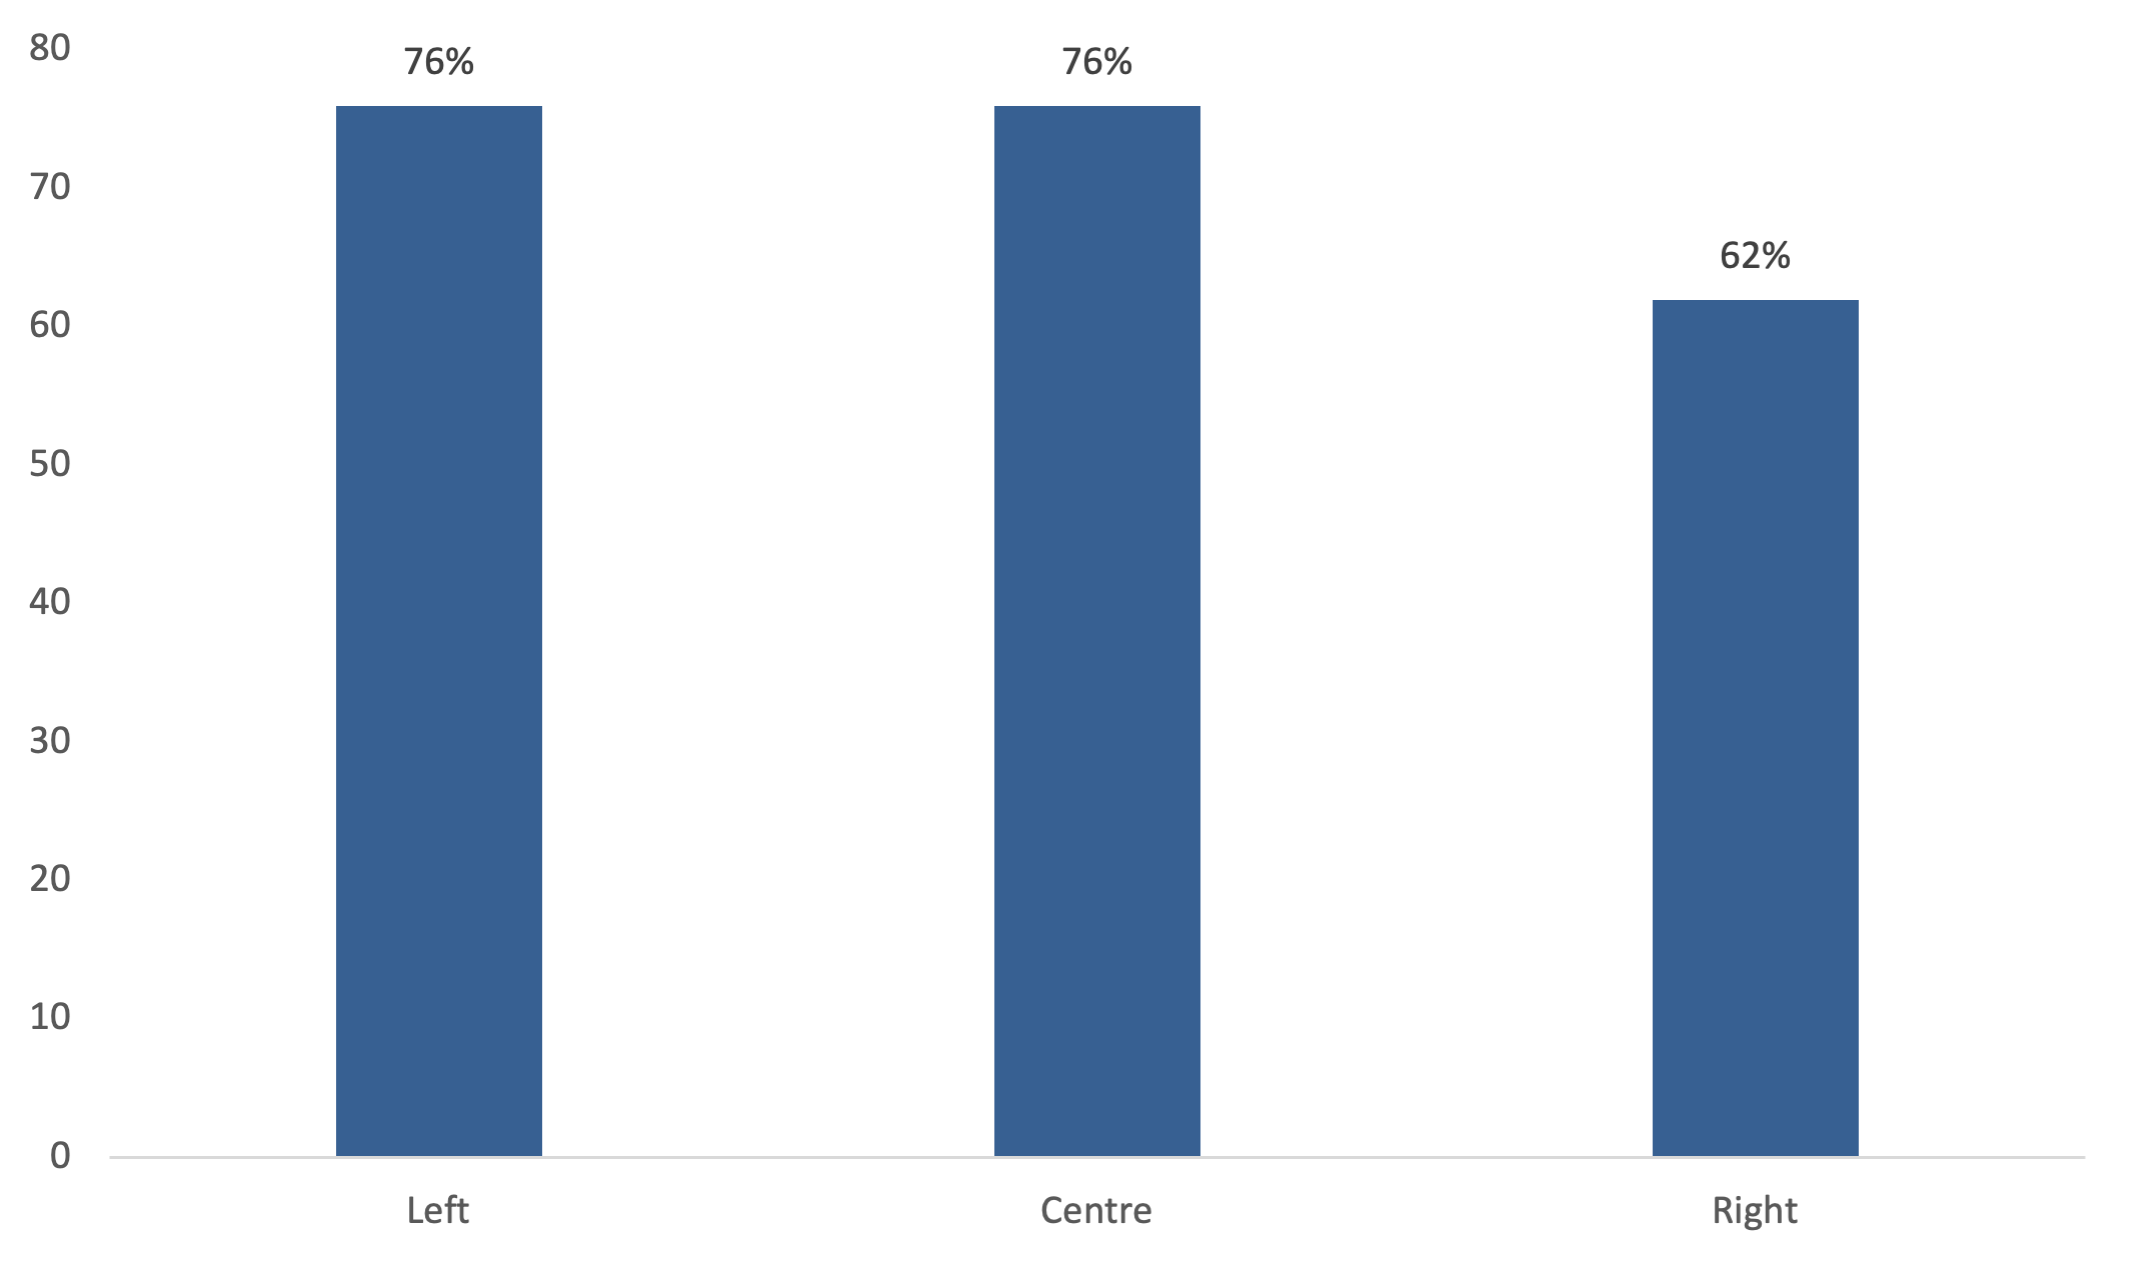
As shown in Figure 4.4, there was also variation by someone's position on the left-right scale, with 76% of those on the left rating voting in local elections as 'very important' compared with 62% of their right-wing counterparts.
Base: all respondents who said it was 'very important' to vote in local council elections (n=837)
Levels of social trust
People across Scotland were asked about the level of trust they had in others and whether they felt they could rely on others for advice and support. Table 4.2 summarises their response to the former question:
| (%) | |
|---|---|
| Most people can be trusted | 61 |
| Can't be too careful in dealing with people | 37 |
| Don't know/Refusal | 2 |
| Unweighted base | 1130 |
Base: all respondents
Around 3 in 5 (61%) said that 'most people can be trusted', while just under 2 in 5 (37%) felt that they 'can't be too careful in dealing with people'.
As shown in Table 4.3, the majority of people in Scotland (79%) agreed that there were people in their area they could turn to for advice and support, while just 8% disagreed.
| (%) | |
|---|---|
| Agree strongly | 39 |
| Agree | 40 |
| Neither agree nor disagree | 13 |
| Disagree | 6 |
| Disagree strongly | 2 |
| Don't know/Refusal | 1 |
| Unweighted base | 1130 |
Base: all respondents
How do these attitudes vary between sub-groups?
There was a high level of variation between certain subgroups in regard to the trust they held in others, indicating a polarisation in attitudes between different socioeconomic backgrounds and political beliefs.
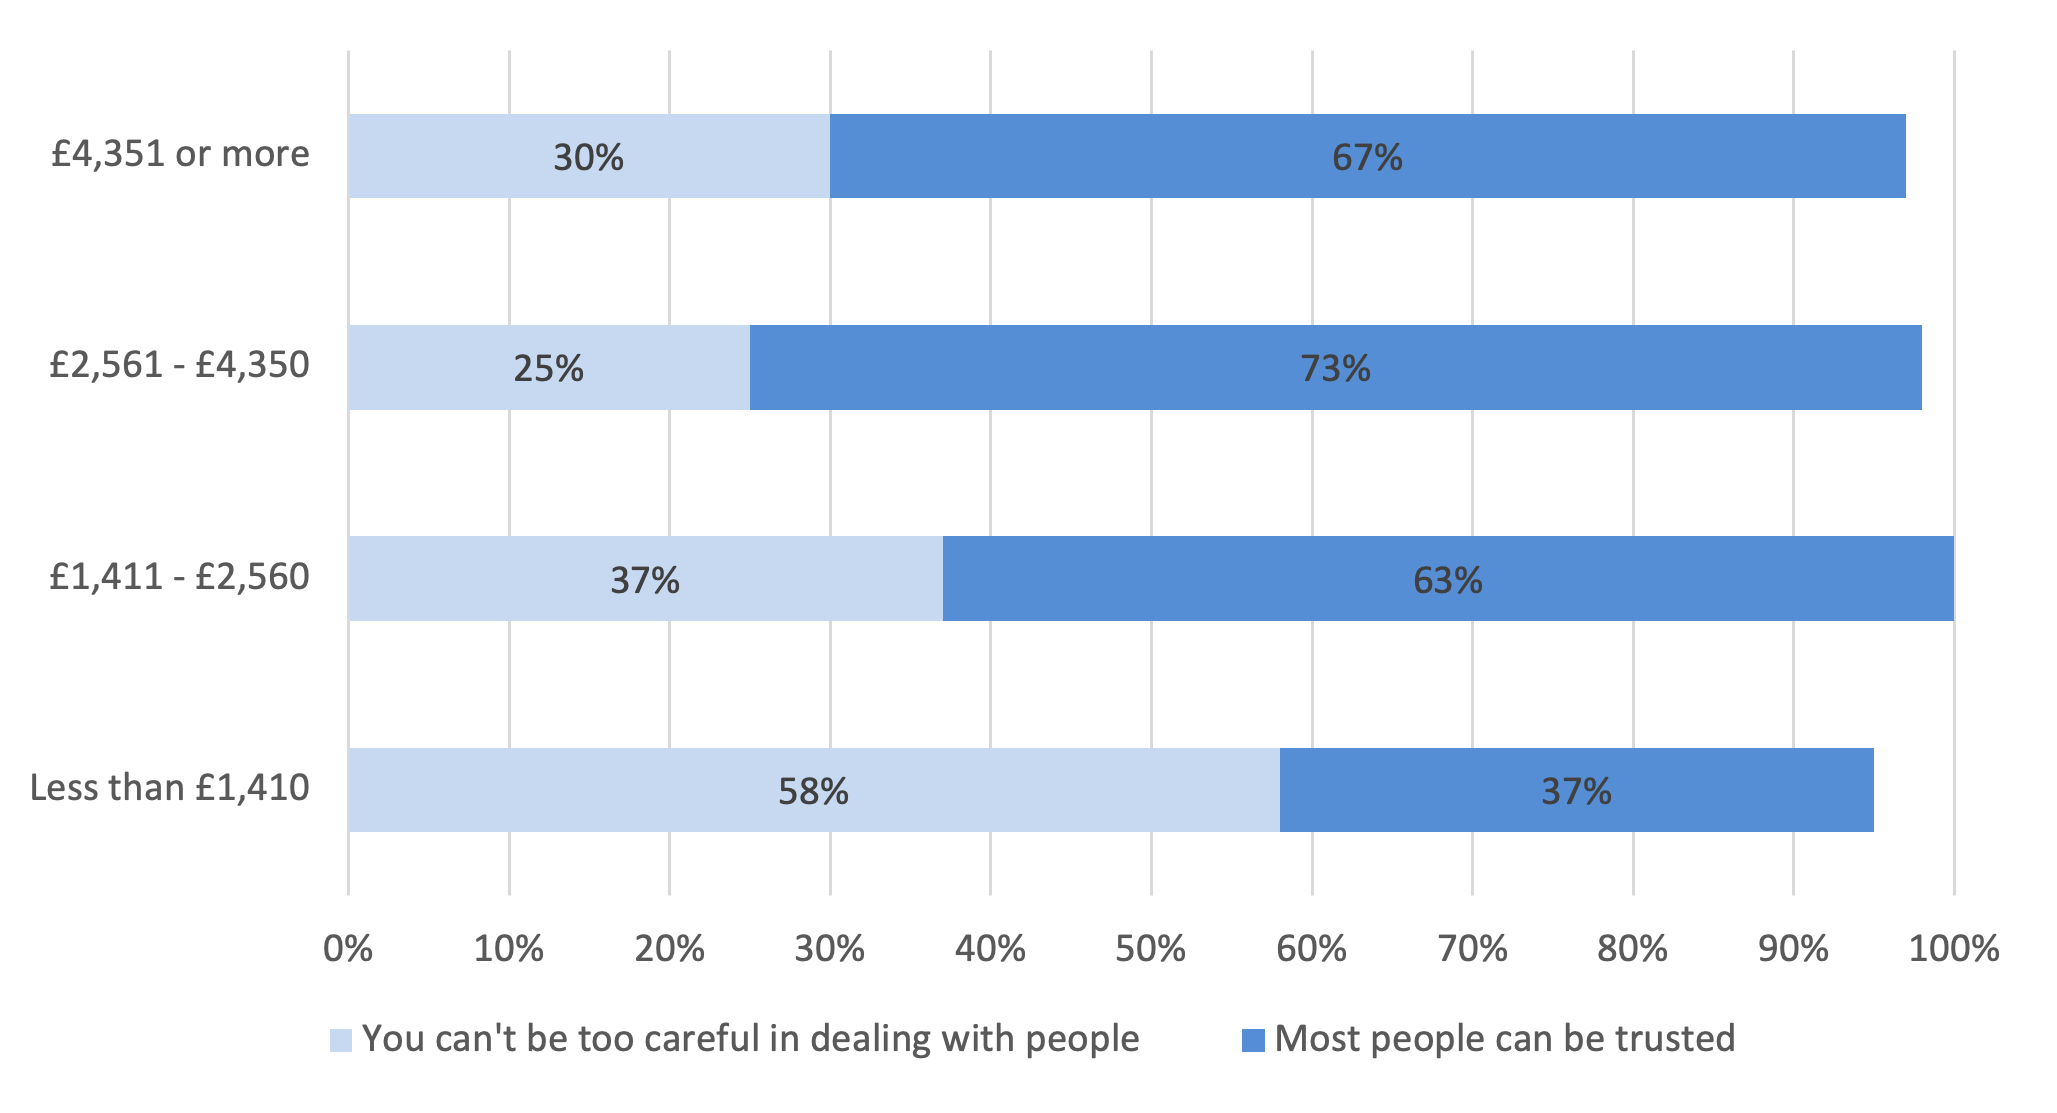
The majority of people (67%) in the highest income quartile believed that 'most people can be trusted', compared with just 37% of those in the lowest income quartile who felt this way. These figures are shown in Figure 4.5:
Base: all respondents
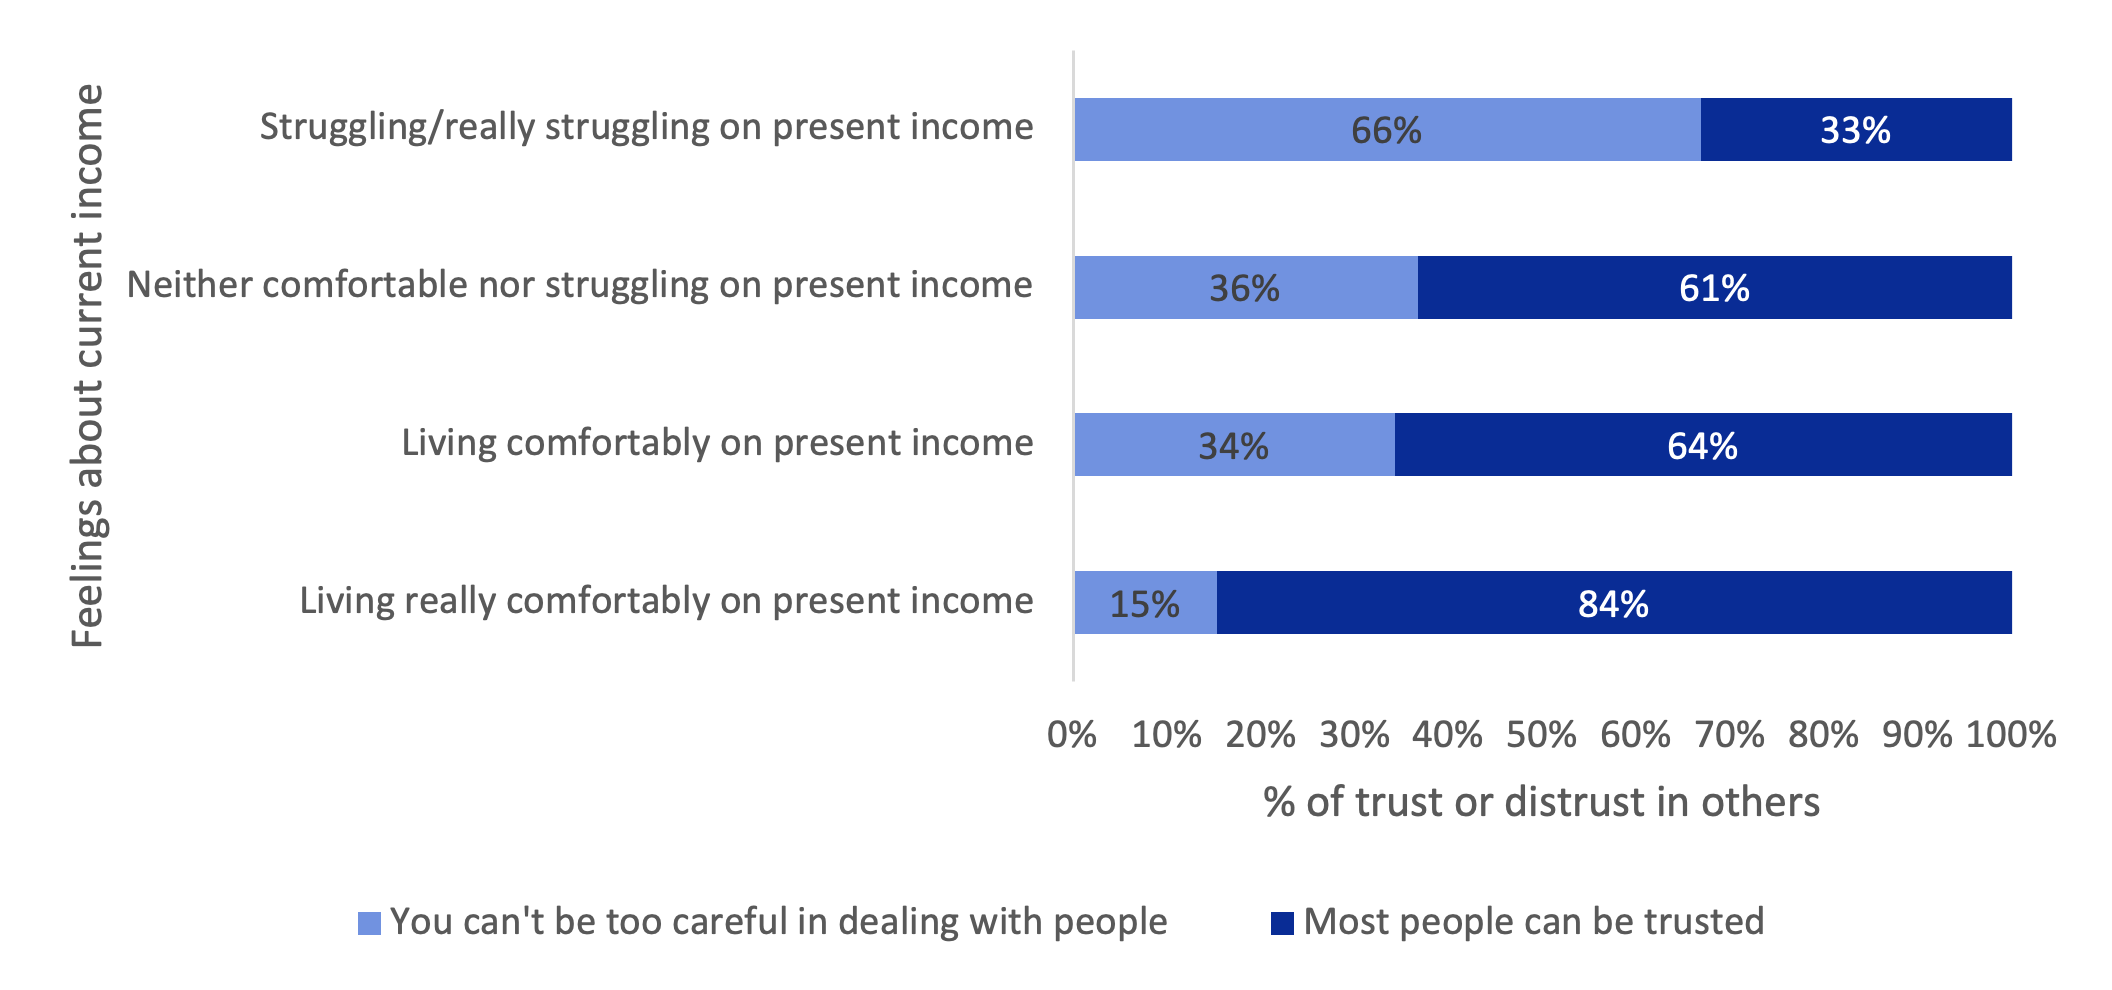
There was a similar polarisation between those who reported that they were struggling on their present income and those who were not struggling. As shown in Figure 4.6, a majority of those who were either 'struggling' or 'really struggling' on their present income (66%) said that 'you can't be too careful in dealing with people', in comparison only 15% of those who said they were 'living really comfortably' on their present income thought this was the case.
Base: all respondents
There was also a strong relationship between someone's educational level and their level of trust in others. While 67% of those who held a degree or higher education qualification felt that 'most people can be trusted', just 22% of those who held no qualifications did so.
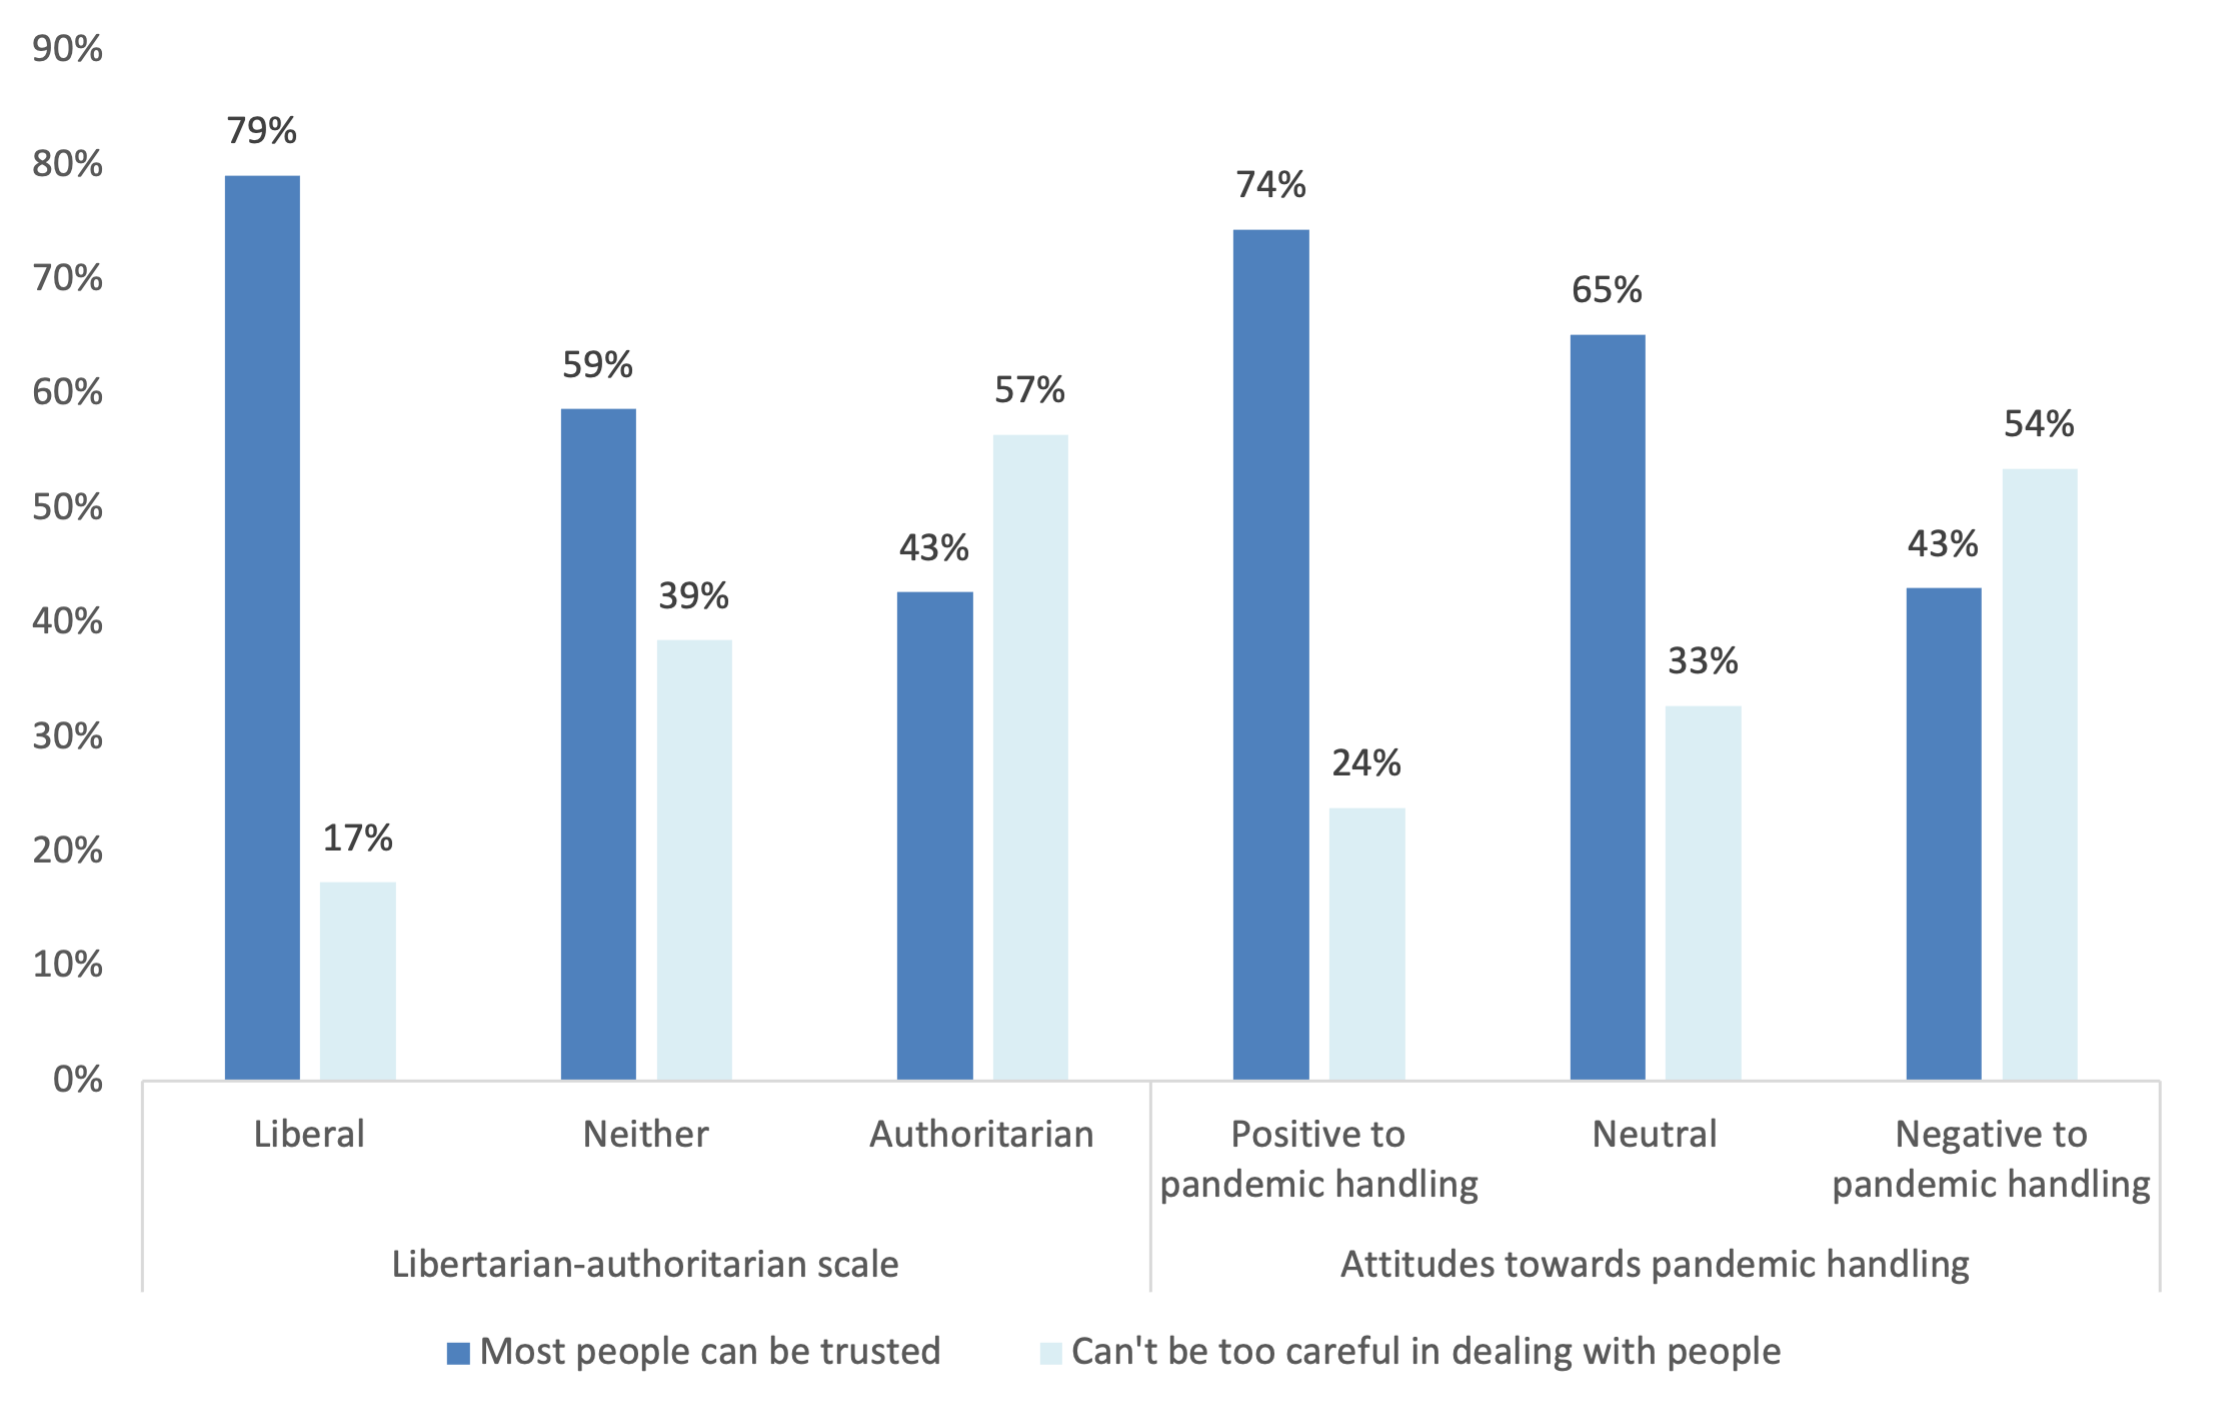
Trust in others was also found to diverge sharply by differing political attitudes. Around 4 in 5 (79%) of those who identified with liberal values on the liberal-authoritarian scale felt that 'most people can be trusted'. However, this figure was almost halved for those on the authoritarian side of the scale, with 43% of this group feeling that 'most people can be trusted'. Out of those who identified with a political party, Scottish Green Party supporters were found to be the most trusting, with 79% stating that 'most people can be trusted', while Conservative supporters were the least trusting, with 50% thinking this is the case. A greater interest in politics was also associated with having more trust in others. Just under 7 in 10 of those (68%) who had 'a great deal of interest' in politics felt that 'most people can be trusted', compared with 40% of those who had either 'not very much' interest in politics or 'none at all'. Those who would vote to remain in the EU in the event of another referendum were also more likely to say that 'most people can be trusted' with 65% of remain voters saying this was the case, compared with 45% of leave voters.
There was also evidence of a connection between trust in others and more general trust in institutions, such as the Scottish Government. For example, 72% of those who thought that 'Most people can be trusted' said they trusted the Scottish Government to work in Scotland's best interests either 'just about always' or 'most of the time', compared with 55% of those who said you 'can't be too careful in dealing with people'. Similarly, 54% of those who thought that 'most people can be trusted' said they trusted the Scottish Government to make fair decisions 'a great deal' or 'quite a lot', whereas the equivalent figure for those who thought that 'you can't be too careful in dealing with people' was 40%.
Further evidence for this connection between trust in others and trust in institutions can be found by examining attitudes by views on Scotland's handling of the pandemic. While 74% of those who had a positive view of Scotland's pandemic handling felt that 'most people can be trusted', only 43% of those with a negative view felt the same way. Figure 4.7 shows the full breakdown for trust in others by both attitudes towards Scotland's handling of the pandemic and position on the liberal-authoritarian scale.
Additional regression analysis was conducted to find out which variables were the key drivers of the level of social trust in others. Controlling for all other variables, someone's position on the liberal-authoritarian scale was found to be a key driver of a person's level of trust in others. The odds of someone on the liberal end of the scale saying that 'most people can be trusted' was 4 times greater than someone on the authoritarian end of the scale.[41]
Although variation by subgroup was less polarised than the question on whether others could be trusted, there were still marked differences between groups in response to the question on whether there were people in this area that could be turned to for advice and support. There was a clear association between someone's socioeconomic circumstances and the extent to which they agreed that they could turn to others for advice and support in the area. Those on the highest incomes were more likely to 'agree' or 'strongly agree' that they could turn to others for help in the area. While 85% of those in the highest household income quartile 'agreed' or 'strongly agreed' that they could turn to others to help, 74% of those in the lowest household income quartile did, a difference of 11 percentage points.
For people living in rural areas, it was more common for them to 'agree' or 'strongly agree' (86%) that there were people they could turn to for advice and support than people living in urban areas (76%). Again, those who had a degree or higher education qualification were far more likely to 'agree' or 'strongly agree' that they could rely on others for support, with 83% of this group stating this compared with 62% of those with no qualifications.
Contact
Email: Arfan.Iqbal@Gov.Scot