Scottish Shellfish Farm Production Survey 2024
Statistics on the employment, production and value of shellfish from the Scottish shellfish farming sector.
Businesses and sites
The numbers of authorised and active shellfish farming businesses in 2024 was 100. This value has steadily declined in the last ten years from a value of 144 in 2015, dropping 31% over the decade. There were many sites that held stock not yet ready for market, others were fallow, and some were located in remote areas where cost-effective production and marketing of shellfish proved difficult. In 2024,178 sites produced shellfish for sale, an increase of 5% from 2023 (169), with 60% of these sites located in Shetland.
| Region | 2015 | 2016 | 2017 | 2018 | 2019 | 2020 | 2021 | 2022 | 2023 | 2024 |
|---|---|---|---|---|---|---|---|---|---|---|
| Highland | 49 | 47 | 48 | 45 | 44 | 43 | 41 | 38 | 35 | 33 |
| Orkney | 3 | 3 | 2 | 3 | 5 | 5 | 4 | 4 | 2 | 2 |
| Shetland | 26 | 25 | 23 | 23 | 23 | 24 | 24 | 23 | 20 | 21 |
| Strathclyde | 49 | 49 | 45 | 45 | 43 | 41 | 40 | 37 | 36 | 35 |
| Western Isles | 17 | 14 | 14 | 14 | 14 | 12 | 11 | 11 | 10 | 9 |
| All Scotland | 144 | 138 | 132 | 130 | 129 | 125 | 120 | 113 | 103 | 100 |
Data Source: Scottish Shellfish Farm Production Survey 2024, Supplementary Tables, Table 3.
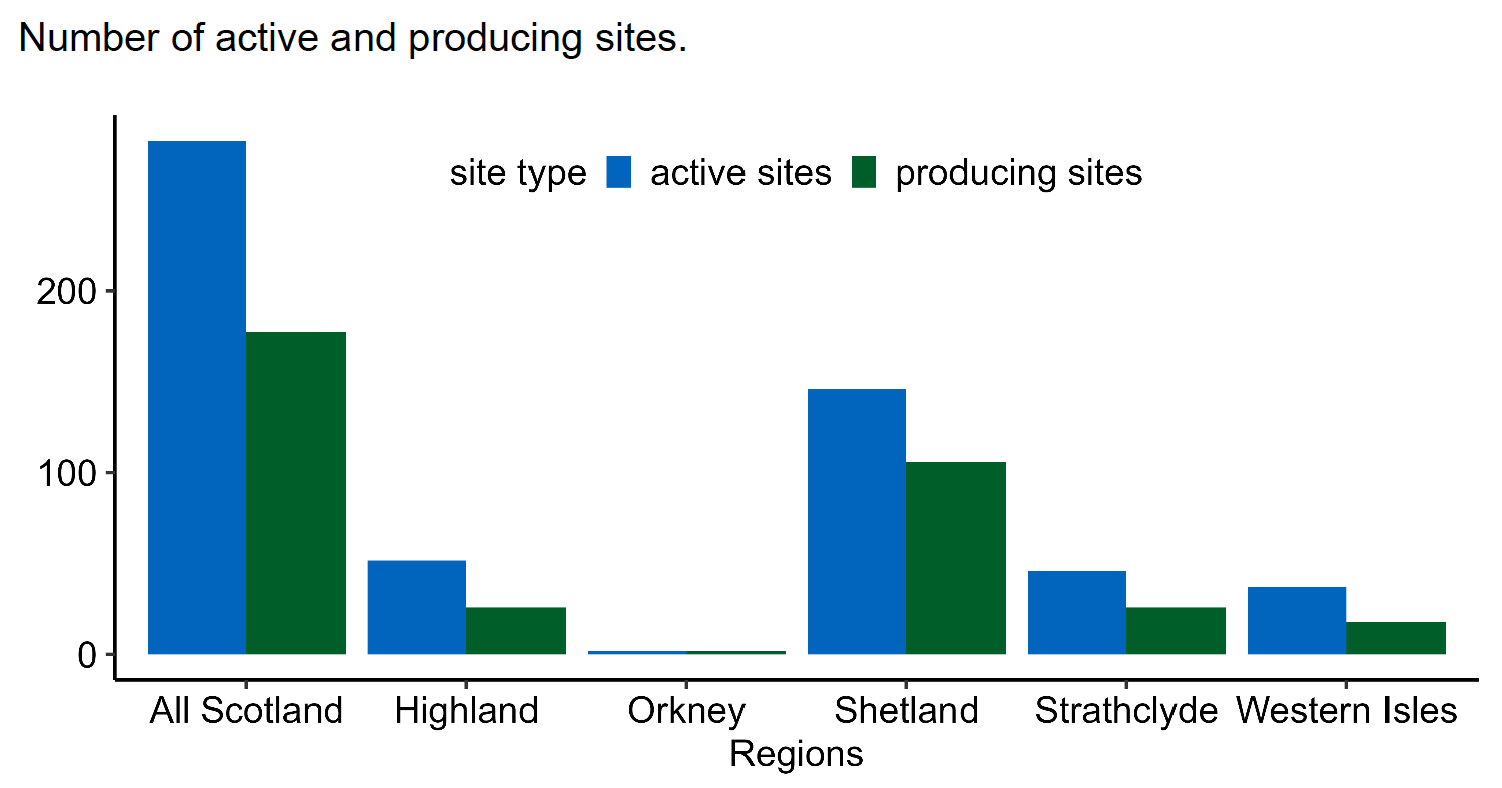
The blue bars show the number of active sites and the green bars show the producing sites.
Note: A business may produce more than one species and in more than one region. Active = Farm sites in a production growing cycle which may contain stock or be fallow. Producing = Farm sites placing shellfish on the market for the table and/or on-growing.
Data Source: Scottish Shellfish Farm Production Survey 2024, Supplementary Tables, Table 4.

The number of active sites shown by each region with the number producing given in brackets. The proportion of business producing each species in each region are shown in the pie charts beside the map. A single business located within the Dumfries and Galloway region continues to be included the Strathclyde regional level statistics to protect individual business information.
There were five Several Orders in place for scallop fisheries in 2024 (see figure 1) all of which were located in the Highland region.
Chart 6 shows number of businesses by region and by species with table production, chart 7 with on-growing production and chart 8 with no production. Many businesses cultivate more than one species on site, a practice made possible by similar cultivation techniques. For example, Pacific oyster can be grown with native oyster, and mussel with Pacific oyster. The highest proportion of Pacific oyster businesses are located in Strathclyde while the highest proportion of mussel businesses are in Shetland.
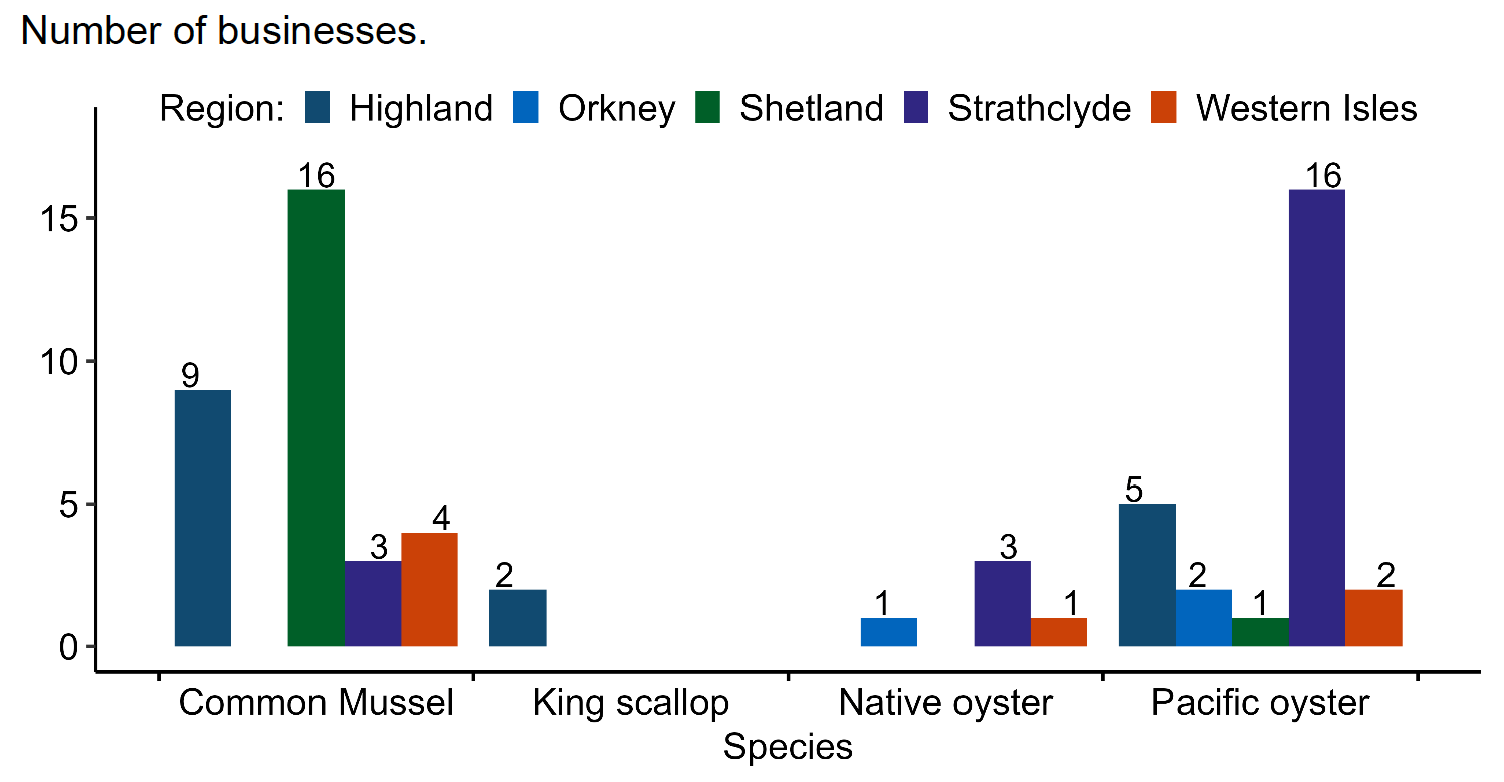
Regions surveyed were Highland, Orkney, Shetland, Strathclyde and Western Isles and species shown are common mussel, king scallop, native oyster and Pacific oyster.
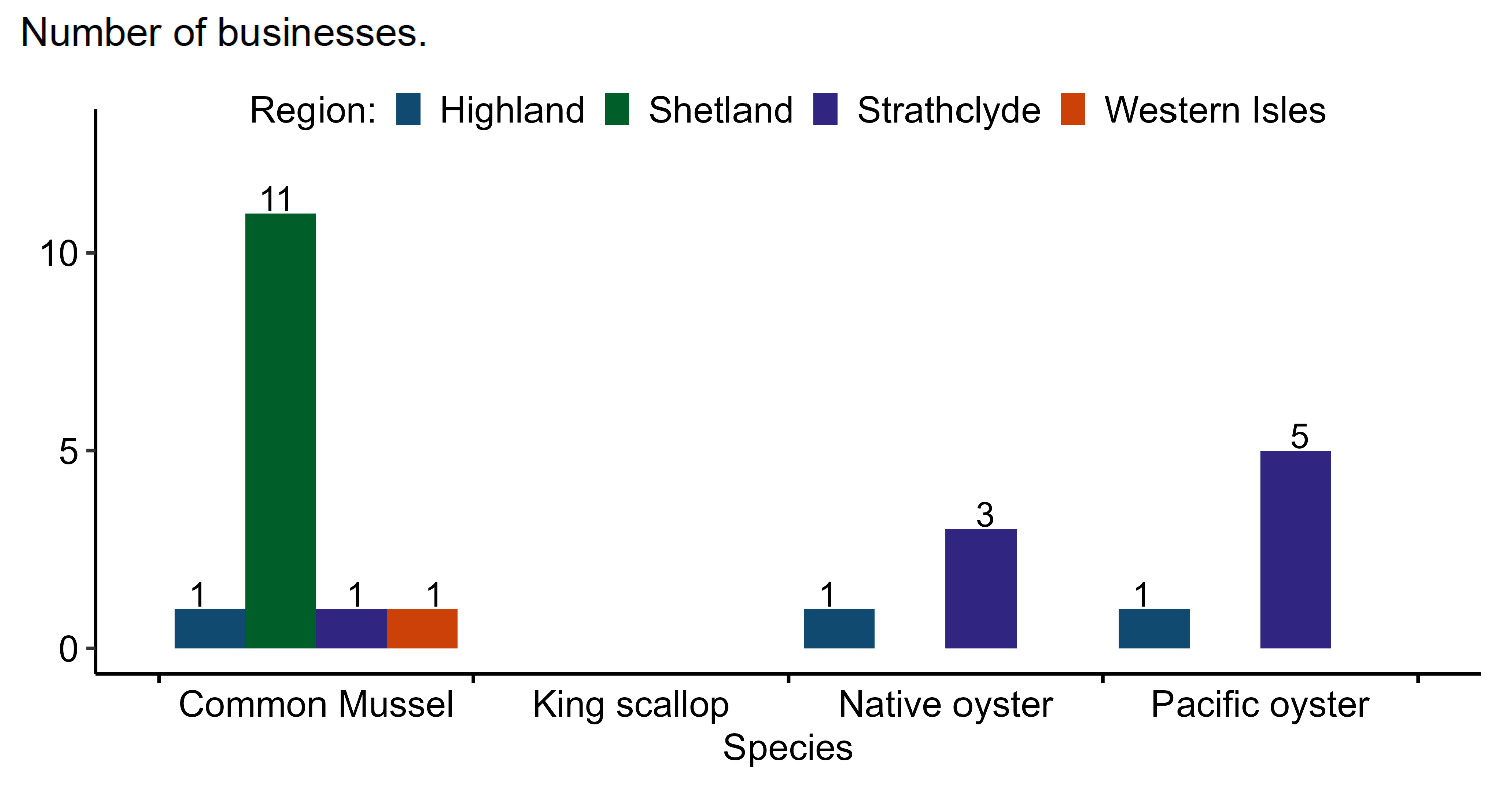
Regions surveyed were Highland, Orkney, Shetland, Strathclyde and Western Isles and species shown are common mussel, king scallop, native oyster and Pacific oyster. There was no production for on-growing in Orkney.
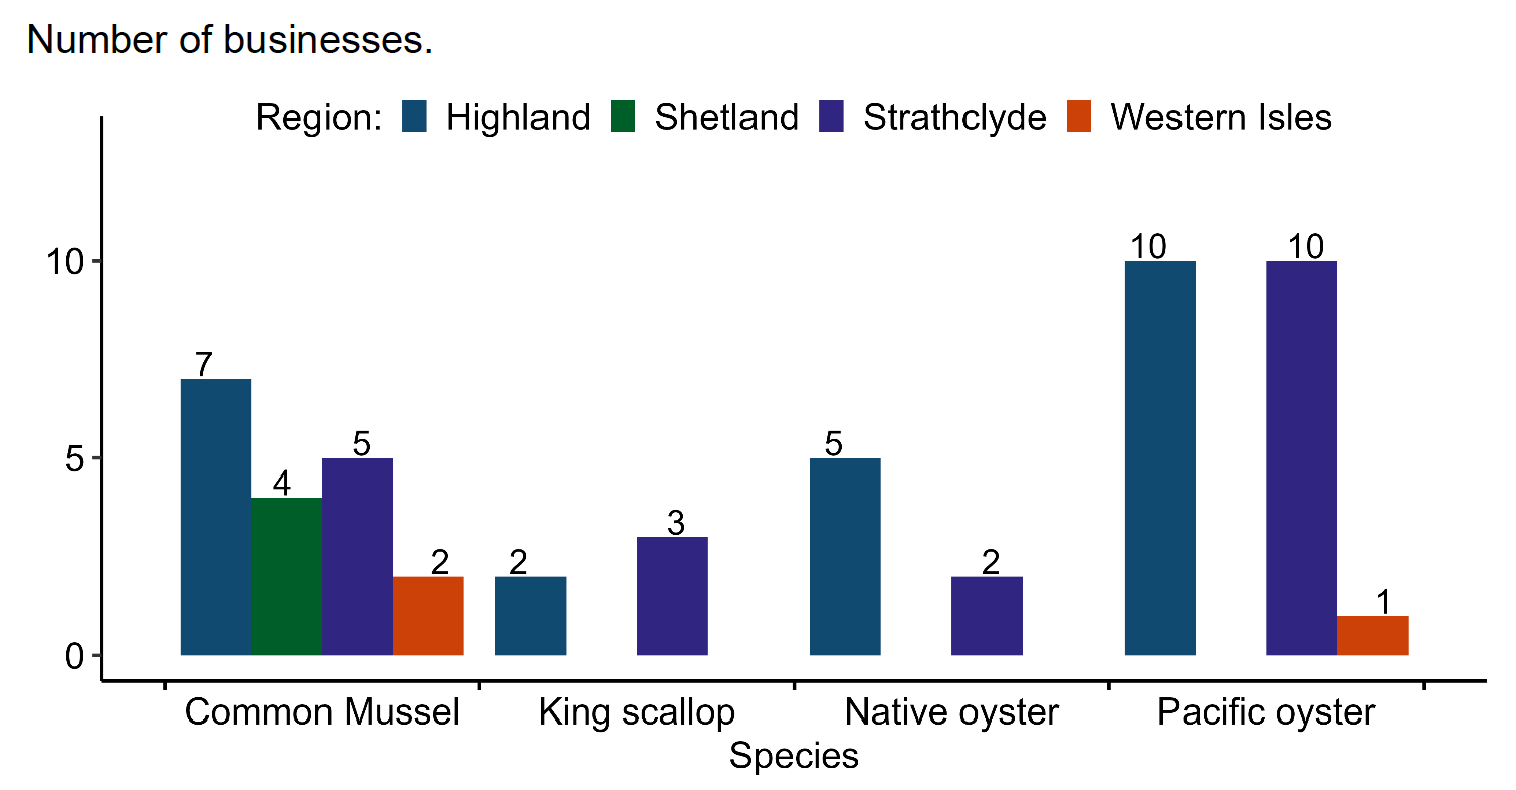
Regions surveyed were Highland, Orkney, Shetland, Strathclyde and Western Isles and species shown are common mussel, king scallop, native oyster and Pacific oyster. There were no businesses with no production in Orkney.
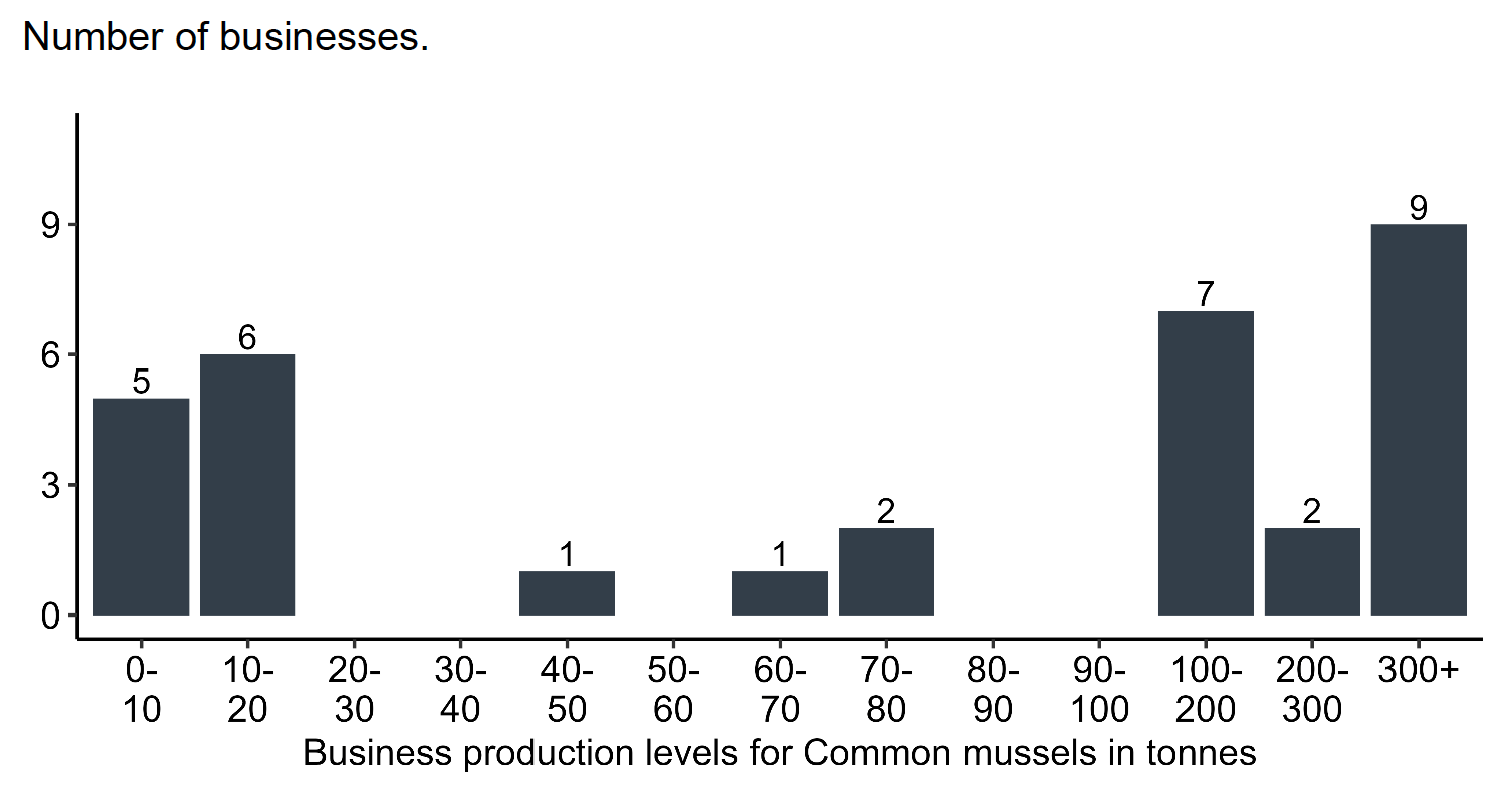
Numbers of businesses categorised by production levels, with production ranging from 0-10 tonnes to over 300 tonnes.
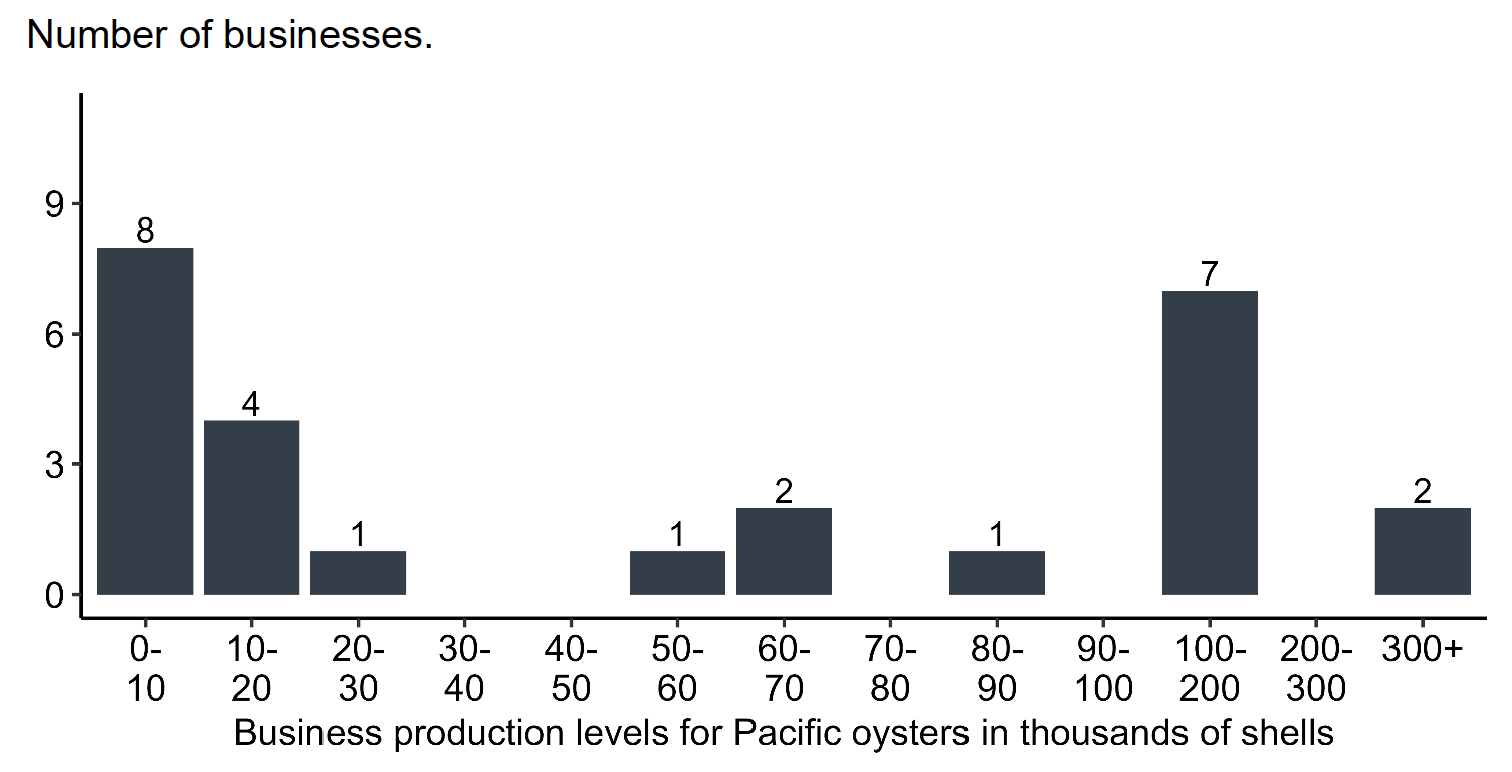
Numbers of businesses categorised by production levels, with production ranging from 0-10,000 shells to over 300,000 shells.
There were 11 businesses producing more than 200 tonnes of common mussel, this was one less than in 2023. These 11 businesses produced 88% (10,301 tonnes) of the total common mussel production in Scotland. There were two businesses that produced more than 300,000 Pacific oysters. The production from these businesses accounted for 42% (1,015,000 shells) of the Scottish Pacific oyster total.
For king scallop, one business produced 0-10,000 shells and one produced 10,000-20,000 shells. For native oyster, four businesses produced 0-10,000 shells and one produced 100,000-200,000 shells.
Contact
Email: MD.Productionsurvey@gov.scot