Scottish Shellfish Farm Production Survey 2021
This report is based on the returns of an annual survey questionnaire sent to all active authorised shellfish farming businesses in Scotland. Statistics on employment, production and value of shellfish from Scottish shellfish farms are presented.
Businesses and sites
The numbers of authorised, active businesses and sites in operation are presented in Tables 3 and 4. There are many sites that held stock not yet ready for market, others were fallow, and some were located in remote areas where cost-effective production and marketing of shellfish proved difficult. In 2021, 165 sites produced shellfish for sale, a decrease of 1% from 2020, with 61% of these sites located in Shetland.
| Number of Businesses | ||||||||||
|---|---|---|---|---|---|---|---|---|---|---|
| 2012 | 2013 | 2014 | 2015 | 2016 | 2017 | 2018 | 2019 | 2020 | 2021 | |
| Active | 153 | 142 | 144 | 144 | 138 | 132 | 130 | 129 | 125 | 120 |
| Region | ||||||
|---|---|---|---|---|---|---|
| Highland | Orkney | Shetland | Strathclyde | Western Isles | All Scotland | |
| Sites | ||||||
| Active | 66 | 5 | 140 | 53 | 45 | 309 |
| Producing | 24 | 3 | 100 | 27 | 11 | 165 |
Active = Farms in a production growing cycle which may contain stock or be fallow.
Producing = Placing on the market for the table and/or on-growing.
NB: A business may produce more than one species and in more than one region.
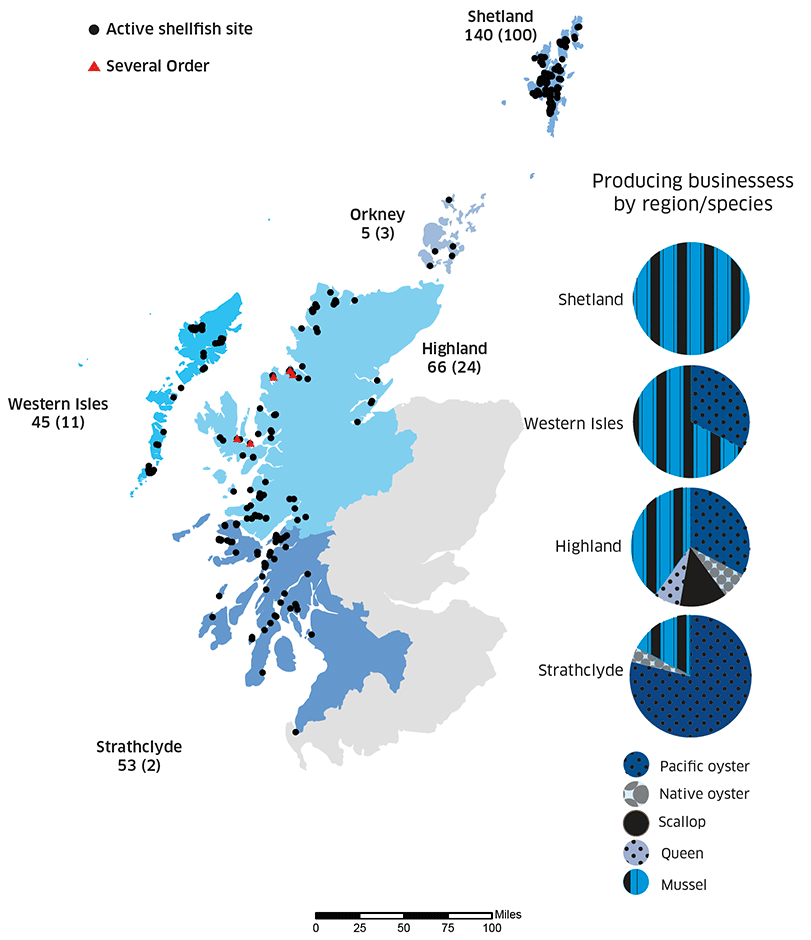
There were five Several Orders in place for scallop fisheries in 2021 (see Fig. 2) all of which are located in the Highland region.
Table 5 depicts the number of businesses by region and by species: A) in table production,
B) in on-growing production and C) showing no production. Many businesses cultivate more than one species on site, a practice made possible by similar cultivation techniques. For example, scallop can be grown together with queen, Pacific oyster with native oyster, and mussel with Pacific oyster. The highest proportion of Pacific oyster businesses are located in Strathclyde while the highest proportion of mussel businesses are in Shetland.
| Region | ||||||
|---|---|---|---|---|---|---|
| Highland | Orkney | Shetland | Strathclyde | Western Isles | All Scotland | |
| Pacific oyster | 5 | 2 | 0 | 19 | 2 | 28 |
| Native oyster | 1 | 0 | 0 | 1 | 0 | 2 |
| Scallop | 2 | 0 | 0 | 0 | 0 | 2 |
| Queen | 1 | 0 | 0 | 0 | 0 | 1 |
| Mussel | 6 | 0 | 21 | 4 | 4 | 35 |
| Total | 15 | 2 | 21 | 24 | 6 | 68 |
| Region | ||||||
|---|---|---|---|---|---|---|
| Highland | Orkney | Shetland | Strathclyde | Western Isles | All Scotland | |
| Pacific oyster | 1 | 0 | 0 | 3 | 0 | 4 |
| Native oyster | 1 | 1 | 0 | 1 | 0 | 3 |
| Scallop | 0 | 0 | 0 | 0 | 0 | 0 |
| Queen | 0 | 0 | 0 | 0 | 0 | 0 |
| Mussel | 2 | 0 | 14 | 1 | 0 | 17 |
| Total | 4 | 1 | 14 | 5 | 0 | 24 |
| Region | ||||||
|---|---|---|---|---|---|---|
| Highland | Orkney | Shetland | Strathclyde | Western Isles | All Scotland | |
| Pacific oyster | 12 | 0 | 1 | 10 | 2 | 25 |
| Native oyster | 4 | 0 | 1 | 2 | 0 | 7 |
| Scallop | 6 | 0 | 0 | 3 | 0 | 9 |
| Queen | 2 | 0 | 0 | 2 | 0 | 4 |
| Mussel | 13 | 1 | 2 | 6 | 5 | 27 |
| Total | 37 | 1 | 4 | 23 | 7 | 72 |
Business production levels by species are shown in Table 6. There were 11 businesses producing more than 200 tonnes of mussels, this was an increase of one from 2020. These 11 businesses produced 84% of the total mussel production in Scotland. There were seven businesses that produced more than 200,000 Pacific oysters. The production from these businesses accounted for 82% of the Scottish Pacific oyster total.
| Species | 1- 10 | 11- 20 | 21- 30 | 31- 40 | 41- 50 | 51- 60 | 61- 70 | 71- 80 | 81- 90 | 91- 100 | 101-200 | >200 | Total |
|---|---|---|---|---|---|---|---|---|---|---|---|---|---|
| Pacific oyster (000s) | 9 | 1 | 4 | 2 | 0 | 1 | 1 | 0 | 0 | 0 | 3 | 7 | 28 |
| Native oyster (000s) | 2 | 0 | 0 | 0 | 0 | 0 | 0 | 0 | 0 | 0 | 0 | 0 | 2 |
| Scallop (000s) | 0 | 2 | 0 | 0 | 0 | 0 | 0 | 0 | 0 | 0 | 0 | 0 | 2 |
| Queen (000s) | 1 | 0 | 0 | 0 | 0 | 0 | 0 | 0 | 0 | 0 | 0 | 0 | 1 |
| Mussel (tonnes) | 8 | 3 | 2 | 2 | 1 | 0 | 0 | 0 | 1 | 0 | 7 | 11 | 35 |
Contact
Email: lorna.munro@gov.scot