Scottish Shellfish Farm Production Survey 2021
This report is based on the returns of an annual survey questionnaire sent to all active authorised shellfish farming businesses in Scotland. Statistics on employment, production and value of shellfish from Scottish shellfish farms are presented.
Production
The survey reports that the shellfish species cultivated in Scottish waters in 2021 were:
Mussel: Mytilus spp.
Pacific oyster: Crassostrea gigas[1]
Native oyster: Ostrea edulis
Queen scallop: Aequipecten opercularis
Scallop: Pecten maximus
Production was dominated by mussel and Pacific oyster, although small quantities of scallop, queen scallop (queen) and native oyster were also produced. The 2021 production data for each species by region are given in Table 1.
| Region | Mussel | Pacific oyster | Native oyster | Queen | Scallop | |||||
|---|---|---|---|---|---|---|---|---|---|---|
| (tonnes) | (000s) | (000s) | (000s) | (000s) | ||||||
| Table | On-growing | Table | On-growing | Table | On-growing | Table | On-growing | Table | On-growing | |
| Highland | 854 | 241 | 2,097 | 2,200 | 1 | 3 | 0.5 | 0 | 27 | 0 |
| Orkney | 0 | 0 | 28 | 0 | 0 | 30 | 0 | 0 | 0 | 0 |
| Shetland | 6,850 | 2,302 | 0 | 0 | 0 | 0 | 0 | 0 | 0 | 0 |
| Strathclyde | 497 | 710 | 2,345 | 1,328 | 7 | 8 | 0 | 0 | 0 | 0 |
| Western Isles | 389 | 0 | 383 | 0 | 0 | 0 | 0 | 0 | 0 | 0 |
| All Scotland | 8,590 | 3,253 | 4,853 | 3,528 | 8 | 41 | 0.5 | 0 | 27 | 0 |
| Weight (Tonnes) | 8,590 | 3,253 | 388 | <1 | <1 | 3 | ||||
NB: This report lists regions with active shellfish farms operated by authorised aquaculture production businesses.
Conversion to weight used the following assumptions (based on industry figures): individual oysters averaged 80g; individual scallops averaged 120g; individual queens averaged 40g.
Table = sales directly for human consumption;
On-growing = sales to other businesses for on-growing.
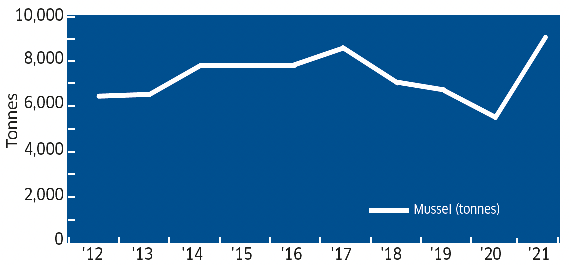
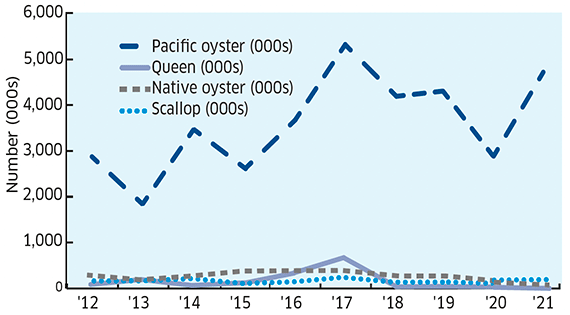
Table production by species is illustrated in Figure 1, while trends in production for the table market and on-growing in Scotland are presented in Table 2.
| For the table | 2012 | 2013 | 2014 | 2015 | 2016 | 2017 | 2018 | 2019 | 2020 | 2021 | % change 20-21 |
|---|---|---|---|---|---|---|---|---|---|---|---|
| Pacific oyster (000s) | 2,706 | 1,891 | 3,392 | 2,693 | 3,534 | 5,034 | 4,031 | 4,393 | 2,863 | 4,853 | 70 |
| Native oyster (000s) | 317 | 260 | 242 | 200 | 201 | 200 | 142 | 103 | 35 | 8 | -77 |
| Queen (000s) | 9 | 33 | 18 | 33 | 155 | 273 | 18 | 18 | 0.5 | 0.5 | 0 |
| Scallop (000s) | 58 | 40 | 48 | 30 | 35 | 47 | 31 | 26 | 19 | 27 | 42 |
| Mussel (tonnes) | 6,277 | 6,757 | 7,683 | 7,270 | 7,732 | 8,232 | 6,874 | 6,699 | 5,661 | 8,590 | 52 |
| For on-growing | 2012 | 2013 | 2014 | 2015 | 2016 | 2017 | 2018 | 2019 | 2020 | 2021 | % change 20-21 |
|---|---|---|---|---|---|---|---|---|---|---|---|
| Pacific oyster (000s) | 3,190 | 6,216 | 6,792 | 5,864 | 4,584 | 3,849 | 4,240 | 2,405 | 1,663 | 3,528 | >100 |
| Native oyster (000s) | 677 | 1,015 | 749 | 13 | 323 | 481 | 344 | 327 | 10 | 41 | >100 |
| Queen (000s) | 0 | 1,490 | 500 | 900 | 17 | 300 | 0 | 0 | 0 | 0 | 0 |
| Scallop (000s) | 16 | 1,470 | 136 | 49 | 23 | 9 | 4 | 0 | 0 | 0 | 0 |
| Mussel (tonnes) | 309 | 1,281 | 1,263 | 1,841 | 2,619 | 4,437 | 2,137 | 3,493 | 4,127 | 3,253 | -21 |
Mussel production, for the table, increased by 52% in 2021 (see figure 1) to 8,590 tonnes. This is the highest level of mussel production recorded in Scotland. The greatest regional contribution to mussel production was from Shetland, accounting for 6,850 tonnes (80%) of Scotland's total. Pacific oyster production increased by 70% from 2020. The production of farmed scallops increased by 42% while production of native oysters decreased by 77%. There was a very small amount of queen scallop production during 2021 as the main producer reported no production during 2021 due to impacts from the COVID-19 pandemic. Historical data for all shellfish species show that production levels vary year on year. This can be due to a number of different factors such as poor spat fall, algal toxins, poor growth, adverse weather, pandemic restrictions and fluctuations in market prices.
Prices of farmed shellfish fluctuated throughout the year. Their value at first sale was estimated from the following figures obtained from the shellfish farming industry. These vary with demand, level of production and geographical area of origin. The average price of Pacific oyster was £0.37 per shell; native oyster, £0.60 per shell; scallop, £2.31 per shell; queen scallop, £0.13 per shell and mussel £916 per tonne. The value of the table trade is estimated from the production figures shown in Table 1.
Mussel: £7.9 million
Native oyster: £0.005 million
Queen: >£0.0001 million
Pacific oyster: £1.8 million
Scallop: £0.06 million
In 2021, the total value at first sale for all species was calculated at approximately £9.8 million, an increase of 61% from the £6.1 million estimated in 2020.
Contact
Email: lorna.munro@gov.scot