We use cookies to collect anonymous data to help us improve your site browsing
experience.
Click 'Accept all cookies' to agree to all cookies that collect anonymous data.
To only allow the cookies that make the site work, click 'Use essential cookies only.' Visit 'Set cookie preferences' to control specific cookies.
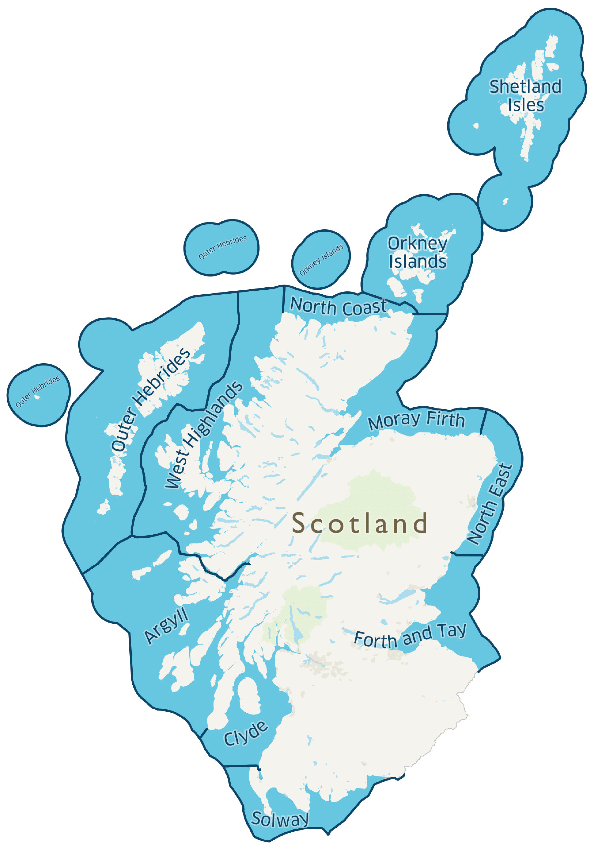
This report is based on the returns of an annual survey questionnaire sent to all active authorised shellfish farming businesses in Scotland. Statistics on employment, production and value of shellfish from Scottish shellfish farms are presented.
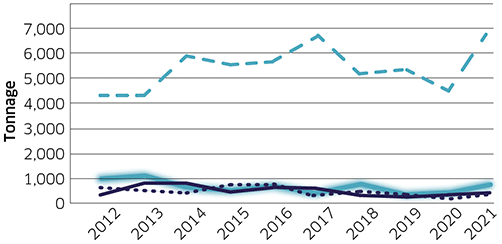
Mussel Production by Scottish Marine Region (Tonnage and Value)
Scottish Marine Region
2012
2013
2014
Tonnage
Value £
Tonnage
Value £
Tonnage
Value £
Argyll & Clyde
323
469,642
770
1,101,870
755
1,056,245
Outer Hebrides
629
914,566
528
755,568
411
574,989
Shetland Isles
4,340
6,310,360
4,337
6,206,247
5,919
8,280,681
West Highlands, Moray Firth & North Coast
985
1,432,190
1,122
1,605,582
598
836,602
All Scotland
6,277
9,126,758
6,757
9,669,267
7,683
10,748,517
Scottish Marine Region
2015
2016
2017
Tonnage
Value £
Tonnage
Value £
Tonnage
Value £
Argyll & Clyde
491
688,873
615
915,735
631
866,994
Outer Hebrides
718
1,007,354
727
1,082,503
396
544,104
Shetland Isles
5,565
7,807,695
5,686
8,466,454
6,647
9,132,978
West Highlands, Moray Firth & North Coast
496
695,888
704
1,048,256
558
766,692
All Scotland
7,270
10,199,810
7,732
11,512,948
8,232
11,310,768
Scottish Marine Region
2018
2019
2020
Tonnage
Value £
Tonnage
Value £
Tonnage
Value £
Argyll & Clyde
442
554,268
363
360,822
425
400,350
Outer Hebrides
555
695,970
544
540,736
282
265,644
Shetland Isles
5,160
6,470,640
5,324
5,292,056
4,427
4,170,234
West Highlands, Moray Firth & North Coast
717
899,118
468
465,192
527
496,434
All Scotland
6,874
8,619,996
6,699
6,658,806
5,661
5,332,662
Scottish Marine Region
2021
Tonnage
Value £
Argyll & Clyde
497
455,252
Outer Hebrides
389
356,324
Shetland Isles
6,850
6,274,600
West Highlands, Moray Firth & North Coast
854
782,264
All Scotland
8,590
7,868,440
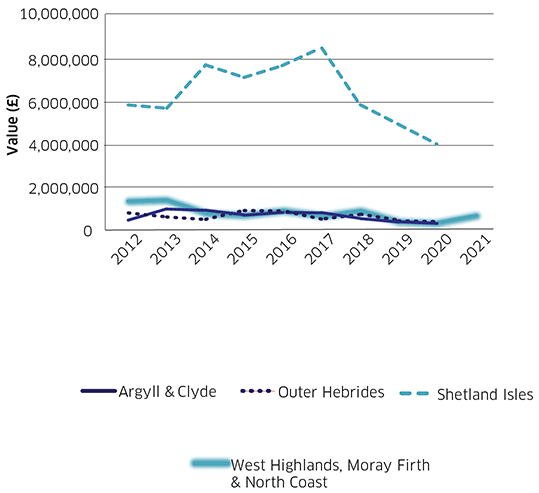
Footnote – Figures for Argyll & Clyde and the West Highlands, Moray Firth & the North Coast have been merged due to commercial confidentiality. Average prices (real) have been adjusted for inflation based on 2021 price estimates.
Mussel Production by Scottish Marine Region
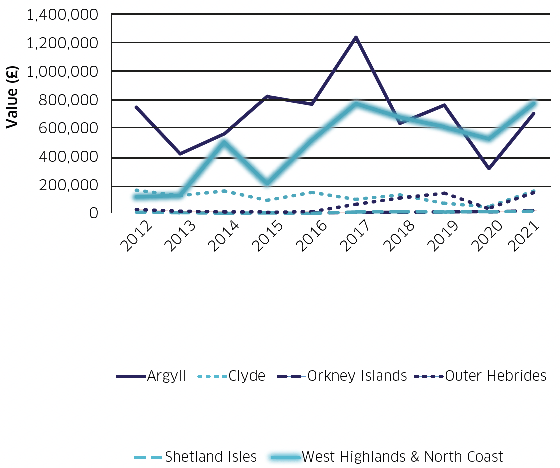
Mussel Production Value (£) by Scottish Marine Region
Pacific Oyster Production by Scottish Marine Region (Number of Shells and Value)
Scottish Marine Region
2012
2013
2014
2015
No. of Shells (000s)
Value (£)
No. of Shells (000s)
Value (£)
No. of Shells (000s)
Value (£)
No. of Shells (000s)
Value (£)
Argyll
1,837
789,910
1,172
457,080
1,549
588,620
1,884
847,800
Clyde
485
208,550
331
129,090
404
153,520
249
112,050
Orkney Islands
0
0
0
0
0
0
0
0
Outer Hebrides
46
19,780
19
7,410
26
9,880
4
1,800
Shetland Isles & Orkney Islands
15
6,450
0
0
0
0
0
0
West Highlands & North Coast
323
138,890
369
143,910
1,413
536,940
556
250,200
All Scotland
2,706
1,163,580
1,891
737,490
3,392
1,288,960
2,693
1,211,850
Scottish Marine Region
2016
2017
2018
2019
No. of Shells (000s)
Value (£)
No. of Shells (000s)
Value (£)
No. of Shells (000s)
Value (£)
No. of Shells (000s)
Value (£)
Argyll
1,774
798,300
2,857
1,285,650
1,672
685,520
2,274
841,380
Clyde
369
166,050
229
103,050
304
124,640
162
59,940
Orkney Islands
0
0
0
0
0
0
0
0
Outer Hebrides
70
31,500
149
67,050
268
109,880
411
152,070
Shetland Isles & Orkney Islands
0
0
0
0
0
0
0
0
West Highlands & North Coast
1,321
594,450
1,799
809,550
1,787
732,670
1,546
572,020
All Scotland
3,534
1,590,300
5,034
2,265,300
4,031
1,652,710
4,393
1,625,410
Scottish Marine Region
2020
2021
No. of Shells (000s)
Value (£)
No. of Shells (000s)
Value (£)
Argyll
1,002
350,700
1,929
713,730
Clyde
140
49,000
416
153,920
Orkney Islands
2
700
28
10,360
Outer Hebrides
85
29,750
383
141,710
Shetland Isles & Orkney Islands
75
0
0
0
West Highlands & North Coast
1,634
571,900
2,097
775,890
All Scotland
2,938
1,002,050
4,853
1,795,610
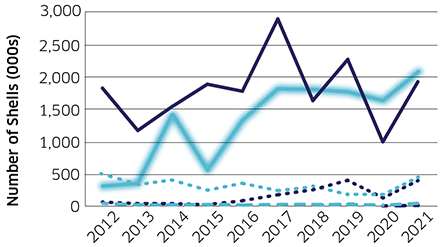
Footnote – Figures for West Highlands & the North Coast have been merged due to commercial confidentiality. Average prices (real) have been adjusted for inflation based on 2021 price estimates.
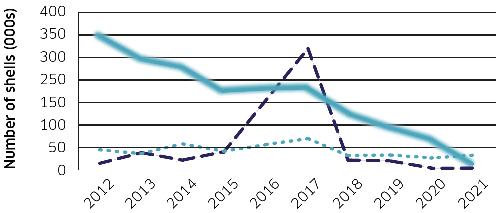
Pacific Oyster Production by Scottish Marine Region
Pacific Oyster Production Value (£) by Scottish Marine Region
Other Scottish Shellfish Production (Number of Shells and Value)
Species
2012
2013
2014
No. of Shells (000s)
Value (£)
No. of Shells (000s)
Value (£)
No. of Shells (000s)
Value (£)
Native Oyster
317
231,410
260
187,200
242
169,400
Queen Scallop
10
1,300
33
5,940
18
3,060
Scallop
58
78,300
40
61,600
48
72,000
All Scotland
385
311,010
333
254,740
308
244,460
Species
2015
2016
2017
No. of Shells (000s)
Value (£)
No. of Shells (000s)
Value (£)
No. of Shells (000s)
Value (£)
Native Oyster
200
138,000
201
138,690
200
134,000
Queen Scallop
33
4,290
155
21,700
273
35,490
Scallop
30
65,400
35
81,550
47
96,820
All Scotland
263
207,690
391
241,940
520
266,310
Species
2018
2019
2020
No. of Shells (000s)
Value (£)
No. of Shells (000s)
Value (£)
No. of Shells (000s)
Value (£)
Native Oyster
142
93,720
103
66,950
35
22,050
Queen Scallop
18
2,520
100
2,520
0.5
70
Scallop
31
62,620
26
51,740
19
46,550
All Scotland
191
158,860
229
121,210
95
68,670
Species
2021
No. of Shells (000s)
Value (£)
Native Oyster
8
4,800
Queen Scallop
0.5
75
Scallop
27
62,370
All Scotland
36
67,245
Footnote – Other shellfish species including native oyster (Argyll & Solway), queen scallop (Clyde & West Highlands) and scallop (Argyll & West Highlands) were also produced however these figures cannot be attributed to Scottish Marine Regions due to commercial confidentiality. Average prices (real) have been adjusted for inflation based on 2021 price estimates.
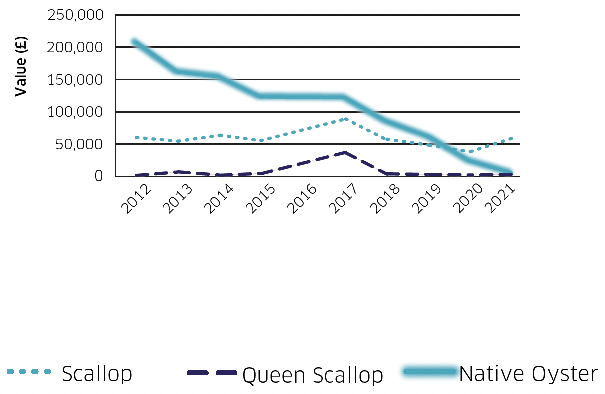
Other Scottish Shellfish Production
Other Scottish Shellfish Production Value (£)