Scottish Scallop Stocks: Results of 2025 Stock Assessments
This report presents the results of Scottish regional king scallop stock assessments carried out by the Marine Directorate including data up to 2024. It also provides background information on Scottish fisheries for scallops, and the current management and regulatory framework.
3. Results and discussion by area
3.1. Regional and temporal trends
Since 2022, total Scottish scallop landings have slightly increased, from just over six thousand tonnes in 2022 to almost eight thousand tonnes in 2024, though still lower than the over 12 thousand tonnes in 2016. The majority of the landings are dredge caught, and it is the reduction in this fishery that is responsible for the overall decline in landings since 2016 (Tables A.2 and A.3). Dive caught scallops typically make up less than 10% of the total landings.
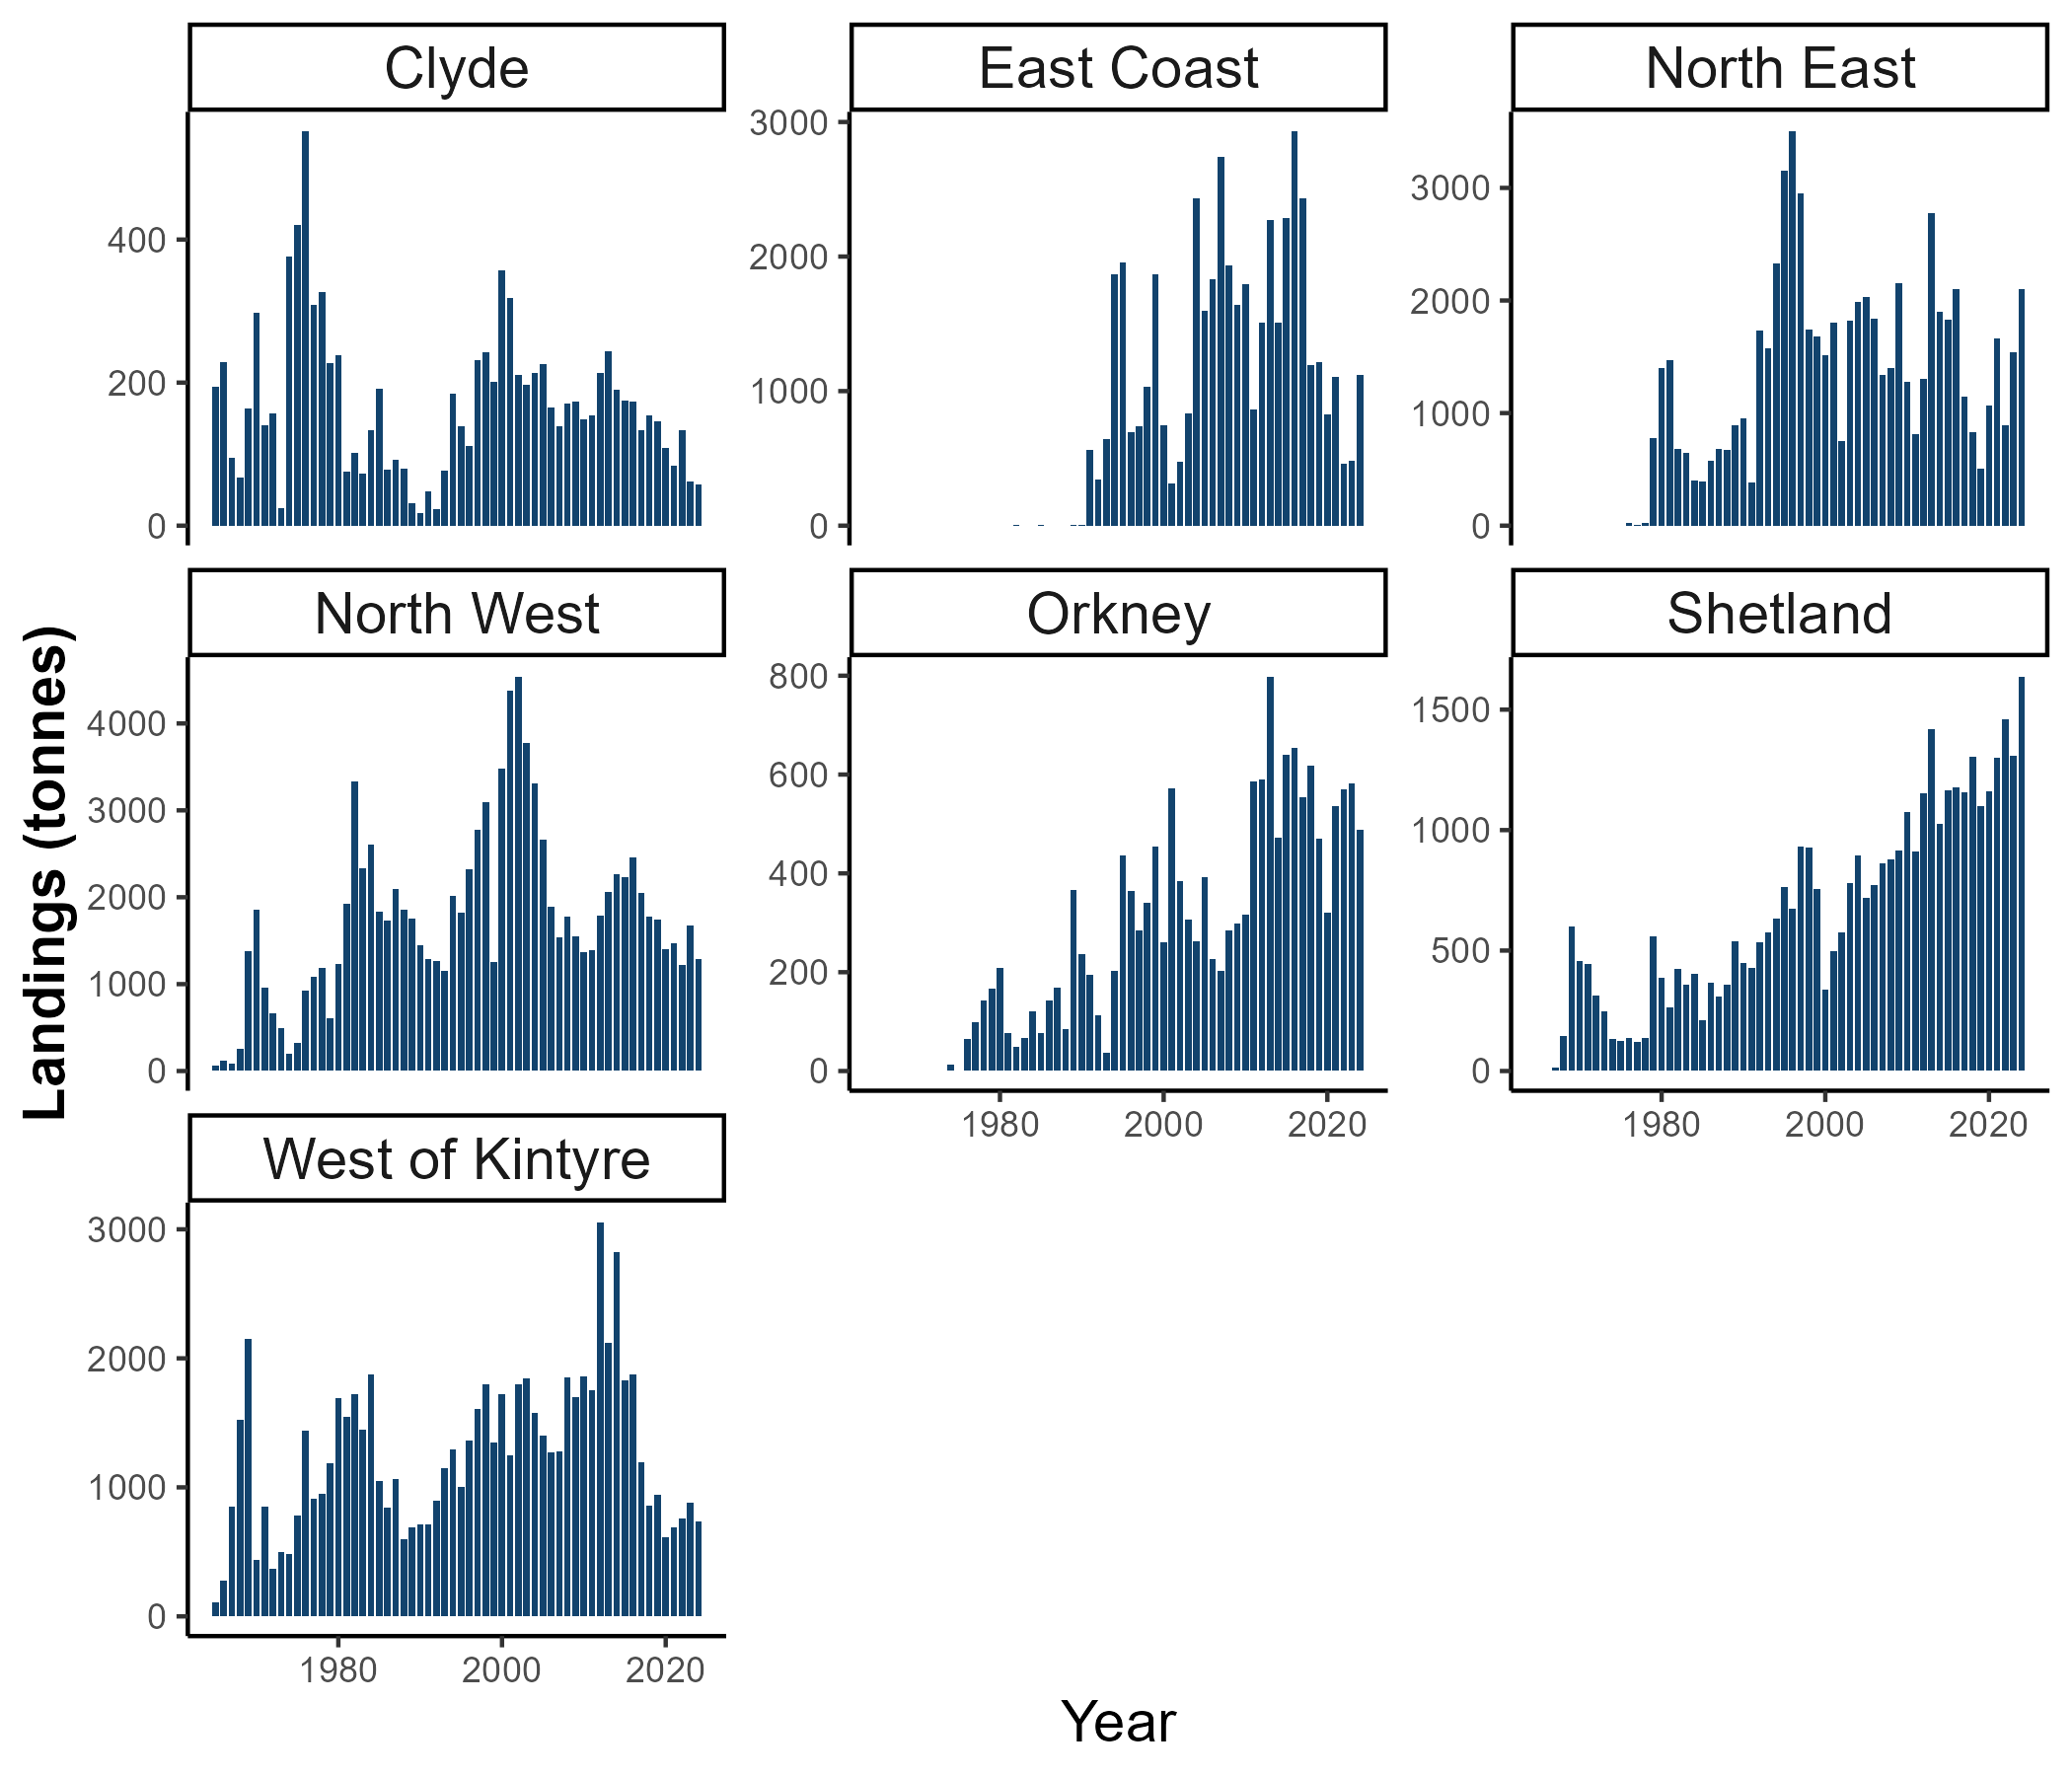
Temporal trends in total landings (by all vessels into all countries) vary considerably between assessment areas and are shown in Figure 3.1 (and Table A.4). In some areas, particularly to the west of Scotland, there appear to have been substantial declines in the fisheries over the last 10 years whilst in other areas such as Orkney and Shetland the landings show a generally increasing trend over the time series of data.
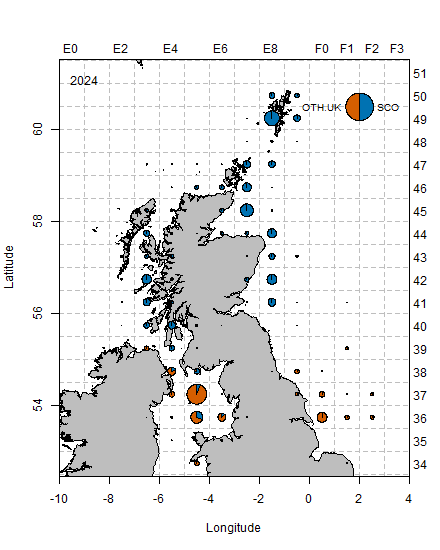
The spatial distribution of UK landings in 2024 (split by country: Scotland and Other UK) is shown in Figure 3.2. ICES rectangle 49E8 (to the west of Shetland) has been the most important rectangle for Scottish landings in recent years,. A number of statistical rectangles off the west coast and northeast coast of Scotland are also very important and over the last two years, the North West, North East, and Shetland assessment areas have each accounted for around 20% of the total Scottish landings. There are also substantial scallop fisheries further south in the Irish Sea, off the northeast English coast and in the English Channel which are also prosecuted by Scottish vessels. The majority of the landings from these more southern areas are reported into non-Scottish UK ports.
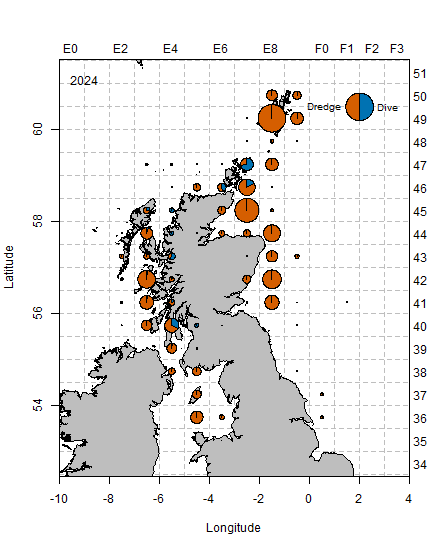
The main dive fisheries are located in the coastal waters of the west of Scotland and also around Orkney (Figure 3.3) where diving accounted for approximately 50% of total landings in 2024.
3.2. Clyde
Description of the fishery
Landings from this area have fluctuated markedly over time, from over 400 tonnes per year in the late 1970s to under 20 tonnes in 1990. There has been a general decline in the fishery over the last 10 years, with landings of 57 tonnes in 2024 (Figure 3.1) which is the lowest landings since 1992, and the fifth lowest in the available data time series. The majority of landings in this area are taken by the dive fishery. The dredge fishery is prosecuted by both local and visiting vessels, with the majority of these landings going into Campbeltown and Carradale. Note that the partitioning of landings from statistical rectangle 40E4 into east (Clyde) and west (West of Kintyre) components relies on an estimation procedure (see Section 2.1) and hence there is likely to be greater uncertainty associated with the total landings values for Clyde than for other areas.
Data
Raised catch-at-age data are available for the Clyde, and although in some years these are based on quite low levels of sampling there are improvements in recent years (Table A.5). In 2019, MD began a dredge survey in the Clyde. So far, the survey has been relatively exploratory in nature and a set of stations with appropriate coverage of the scallop grounds is in the process of being established. It is envisaged that as the survey coverage becomes more standardised from year to year and the time series increases in length, there should be sufficient data to provide a stock assessment for scallops in this area.
3.3. East Coast
Description of the fishery
The scallop fishery in the East Coast assessment area developed in the 1990s. There has been marked variability in the landings throughout the time period, from 313 t in 2001 to a high of almost 3,000 t landed in 2016 (Figure 3.1). Since then, landings have declined quite substantially and were 1119 t in 2024. The landings from this area are almost entirely from the dredge fleet. A large number of vessels operate in the area, some based locally and others which are more itinerant, fishing on different grounds around the coast of the UK. Over 90% of the landed weight from this area goes into ports in northeast Scotland (Fraserburgh and Peterhead).
Catch-at-age data
Sampling of the landings has been carried out since the beginning of the fishery (Table A.5). In recent years, sampling levels have been particularly poor (with no samples obtained for 2023) and this is likely to be due to a lack of sampling opportunities given the recent lower level of landings. The Covid-19 pandemic is also likely to have resulted in reduced sampling opportunities during 2020 to 2022.
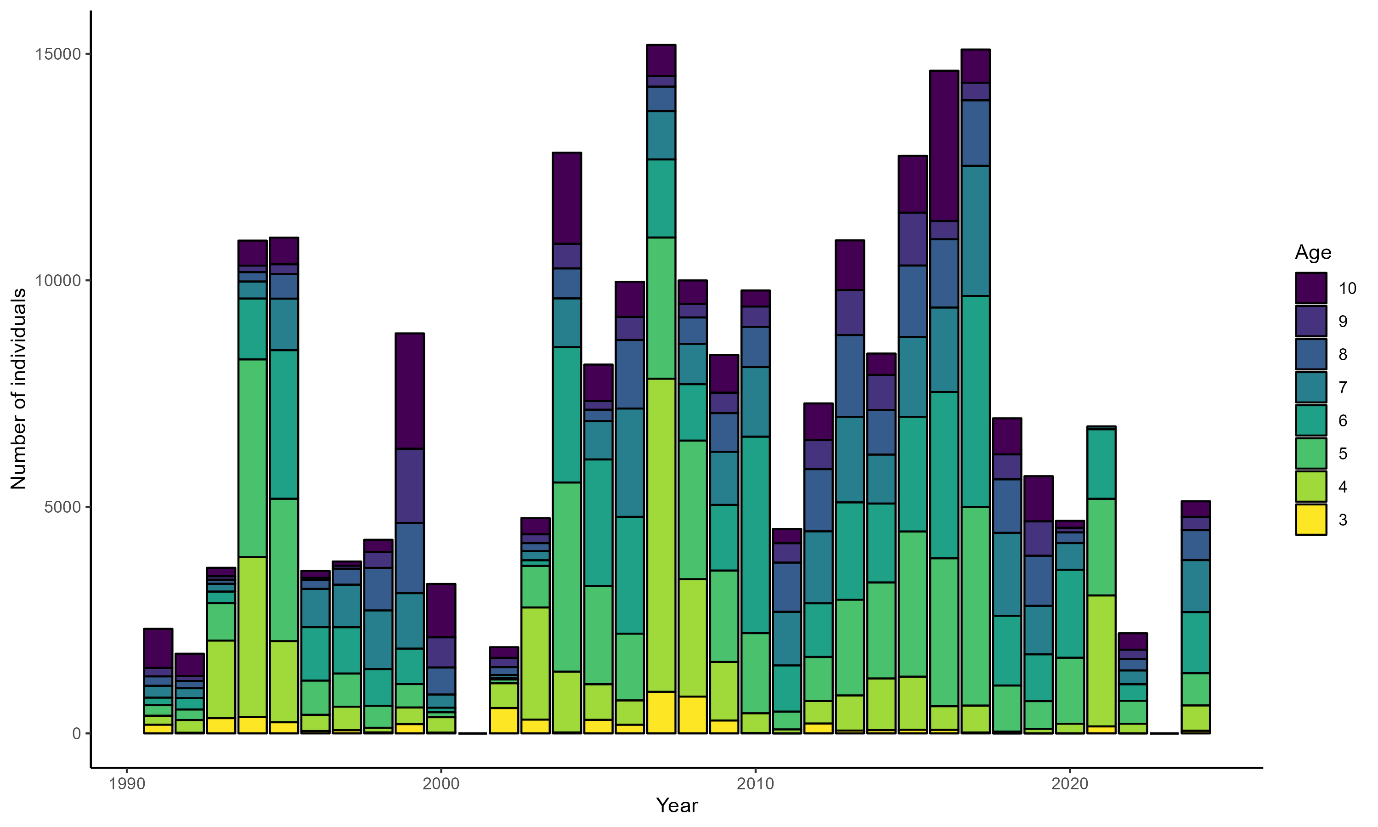
Catch-at-age data for the East Coast are shown in Figure 3.4 and Table A.6 for 1991 onwards. No specific age classes consistently dominate the landings and there are no apparent trends in age composition. The high landings in 1994-1995 consist mainly of young-mid (ages four to six) individuals from the 1989-1991 year classes, which dominate the landings in 1999-2000 at older ages (8-10+). The catch-at-age data generally show low numbers of individuals at young ages (three and four year olds) indicating only partial recruitment to the fishery up to age five.
Biological data
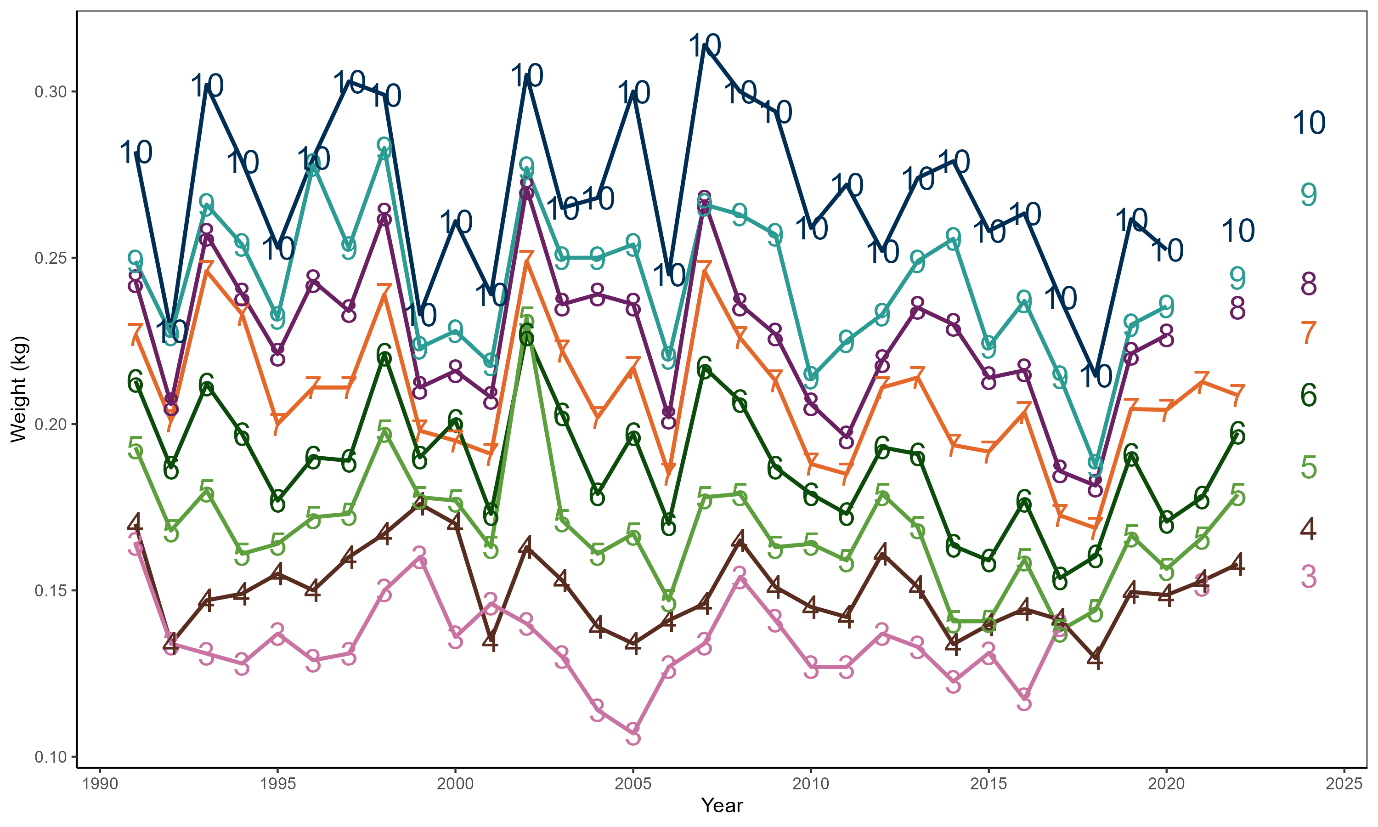
The mean weights-at-age are shown in Figure 3.5 and Table A.7. There are no apparent systematic temporal trends although interannual fluctuations in mean weight-at-age are similar across age classes.
Exploratory analysis
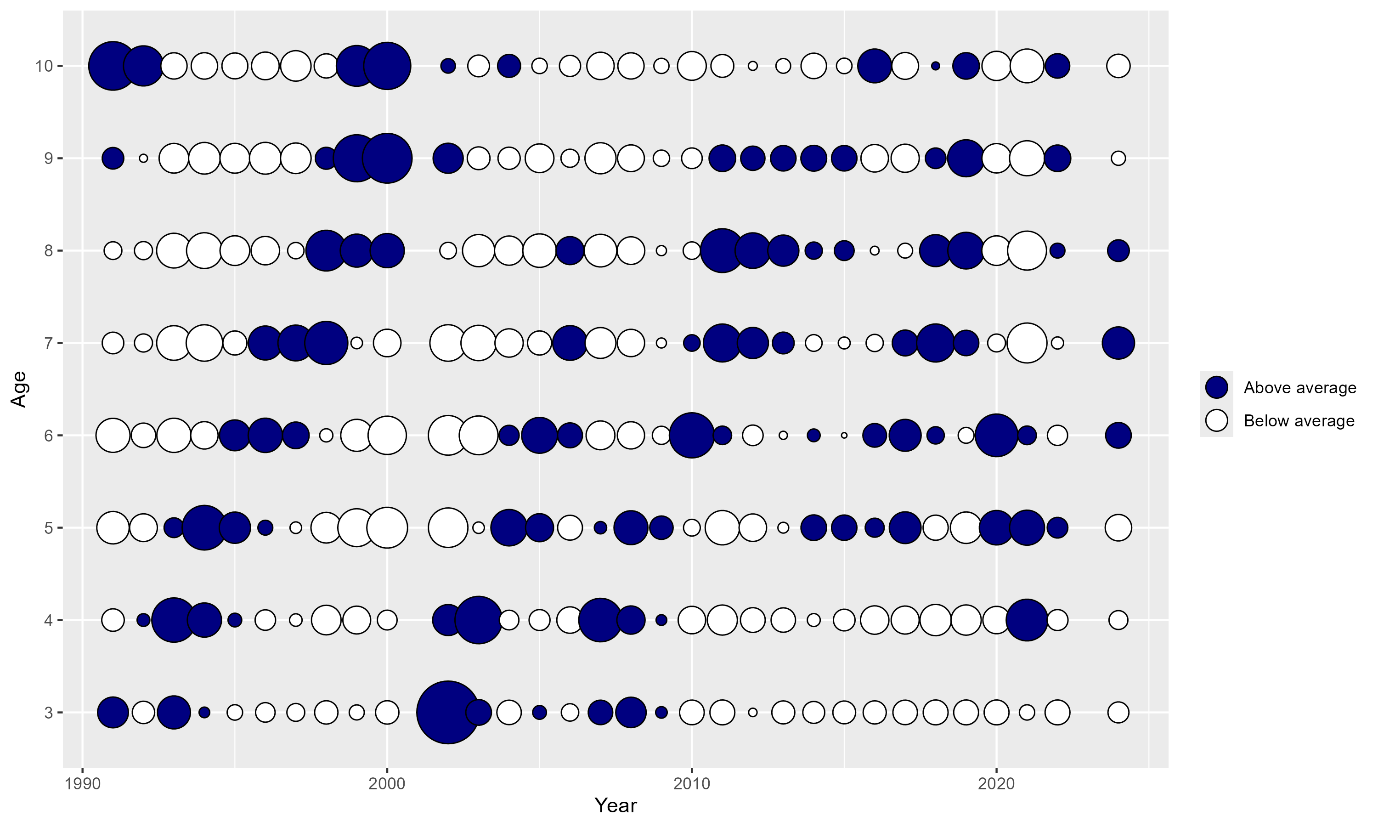
Catch-at-age data by proportion (normalised by mean and standard deviation across age class) are shown in Figure 3.6 with dark bubbles illustrating above average values. The data provide some indications of relative year class strength, with the 1989 and 1999 year classes (recruiting at age three in 1992 and 2002 respectively) appearing well above average and those of the mid 1990s being particularly low. These strong and weak year classes are well tracked at subsequent ages. In recent years, the data appear to be noisier, and it is difficult to identify clear year class signals.
Details of the surveys which have been carried out in the East Coast assessment area are given in Table A.8. A partial North Sea scallop survey was conducted in 1993, with full coverage of the East Coast assessment area beginning in 1994. However, the survey was not conducted consistently by the same vessel (RV Clupea) until 1997 onwards with a change to RV Alba na Mara in 2008. No comparative tows were conducted to compare catch rates between vessels. Previous scallop stock assessments have suggested that despite standardisation of catch rates (to account for differences in the number of dredges towed and dredge width), survey vessel may have a significant impact on catchability. Therefore, the survey data are treated as two separate time series. The Clupea dredge survey runs from 1998 to 2007 and the Alba survey from 2008 onwards, but with a missing year in 2020 due to disruption associated with the Covid-19 pandemic. (Table A.8 and A.9).
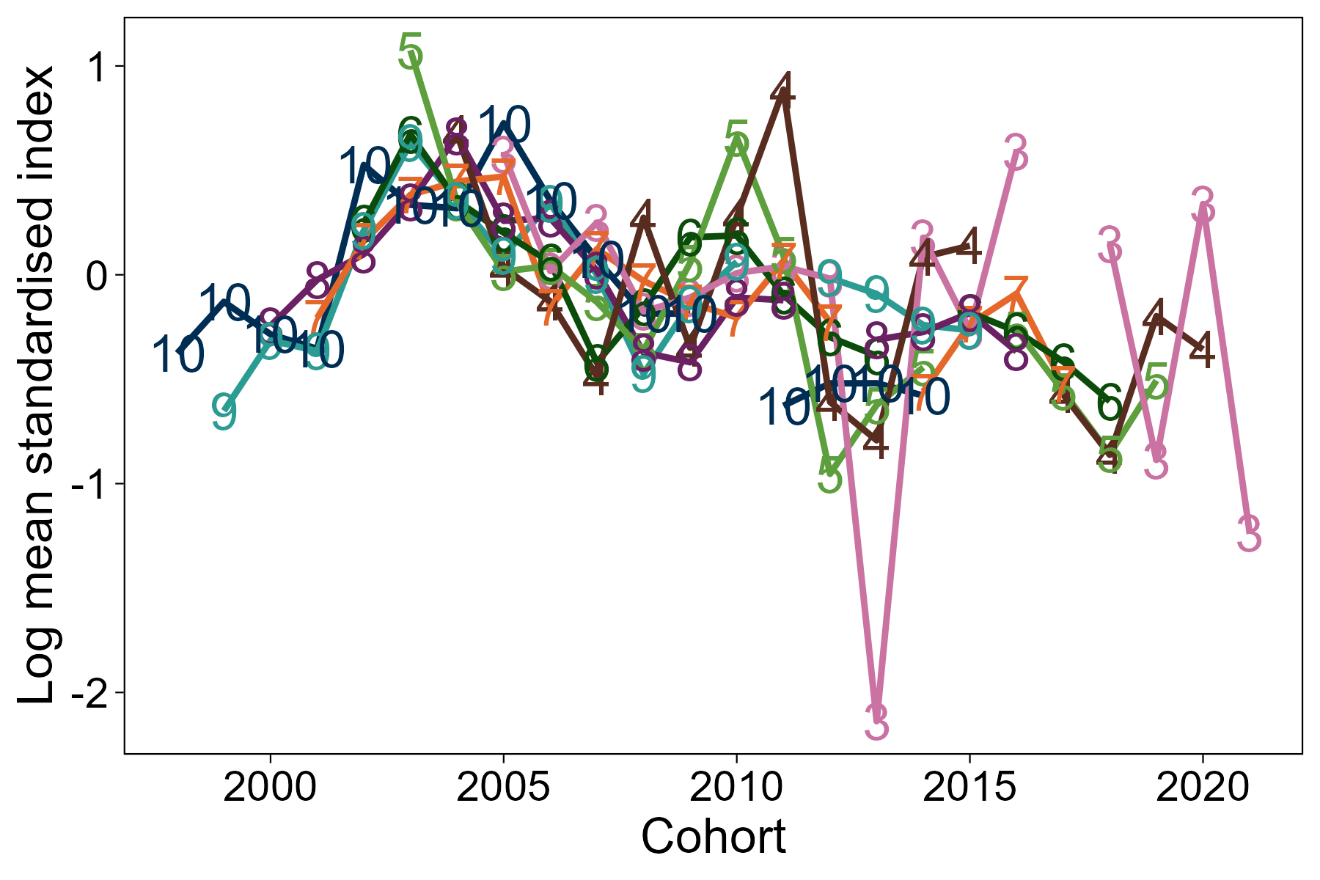
Mean standardised survey catch rates-at-age by cohort are shown in Figure 3.7 for the two surveys separately (Clupea and Alba). Following a number of weak year classes during the mid-1990s, the Clupea survey suggests good recruitment in years 2001 and 2002 (1998 and 1999 cohorts) and tracks these cohorts with above average catch rates across a range of age classes. Furthermore, this survey identifies a strong 2003 cohort. The early part of the Alba survey also identifies the 2003 cohort as well as 2004-2005 to be strong cohorts, seen as above average indices at age 3-5 in 2008 (Figure A.2). Although the data from the Alba survey appear to be noisier with less internal consistency, there is an indication that recruitment has been relatively lower in recent years (many of the log mean standardised values are below zero).

The catch rates of scallops (age three and 4+ separately) at stations across the East Coast assessment area for 2023 and 2024 are shown in Figure 3.8.
Total catch rates in the East coast area look similar across the area and between 2023 and 2024, although appear lower than the other assessment areas. Recruitment (centre circles) appears to be less widespread in 2024 compared to 2023.

Final assessment
Input data are largely consistent with previous assessments and are summarised below:
| Data Type | Year Range | Age Range | Notes |
|---|---|---|---|
| Catch numbers-at-age | 1991 - 2024 | 3 - 10+ | - |
| Catch weights-at-age | 1991 - 2024 | 3 - 10+ | - |
| Total landings (biomass) | 2001, 2023 | - | Utilised in absence of catch numbers-at-age |
| Clupea Survey numbers-at-age | 1998 - 2007 | 3 - 9 | - |
| Alba Survey numbers-at-age | 2008 - 2024 | 3 - 9 | Missing year in 2020 due to Covid-19 pandemic |
| Stock weights-at-age | 1991 - 2024 | 3 - 10+ | Assumed equal to catch weights-at-age |
| Maturity-at-age | 1991 - 2024 | 3+ | All ages assumed mature |
| Natural mortality-at-age | 1991 - 2024 | 3+ | 0.15 all ages (based on likely longevity) |
The final model configuration from the previous East Coast scallop assessment (carried out in 2023) was used to specify the model settings, as this has already been modified to improve residual patterns and fit and there was no reason to modify these settings with the inclusion of additional years’ data. The exception is the inclusion of a configuration option (‘keyBiomass Treat’) which allows the model to utilise observations of total landings (by weight) in the absence of catch numbers at age. In this case those observations are included for 2001 and 2023 when there was no sampling of landings. The main features of the assessment model configuration are summarised as follows:
- Fishing mortalities at ages 8 and above are assumed equal (coupled).
- Survey catchabilities are uncoupled across all ages for the Clupea survey and are coupled at ages 7 and above for the Alba survey.
- Catch observation variance parameters are coupled across ages 5 to 9 and uncoupled at other ages. To account for the variation in sampling levels over time, the number of catch samples per year is used to weight the data such that the catch data from those years with a greater number of samples is given a greater weight in the assessment.
- Survey observation error is coupled for ages 5 and above (both surveys).
- The Alba survey observations are modelled with an AR(1) covariance structure (rather than independent). Correlation parameters for ages 3-5 were uncoupled from other ages.
- Recruitment at age 3 is modelled as a random walk.
- Fishing mortality-at-age is modelled with AR(1) and process variance parameters are coupled across all ages.
- Process variance in stock numbers-at-age were assumed coupled with the exception of age 3 (the age at recruitment).
The final SAM configuration file is given in Table A.10.
The model predictions of catch and survey numbers-at-age track the observations relatively well across most ages (Figures A.5 – A.7). The exceptions to this are the younger ages in both catch and surveys, and the 10+ age group in the catch which are estimated to have greater observation uncertainty (logSdLogObs parameters 0, 1, 3, 4 and 7 in Table A.12).
There are no major patterns or trends in the one-step-ahead residuals or process residuals (Figure A.8 and Figure A.9). For process residuals all errors lie within ±3 standard deviations. For one-step-ahead residuals, there are three outliers (two positive, one negative) which lie just outside ±3 standard deviations.
The full set of input data, model configuration and assessment results can be found on the stockassessment.org website.
Retrospective analysis

The retrospective plots shown in Figure 3.9 indicate that in general the assessment tends to overestimate the recruitment, and consequently the SSB (spawning stock biomass), in the final year (i.e. that estimates are revised downwards with each additional year’s data). Mohn’s ρ (rho, average under-/overestimation) is often used as a measure of assessment performance. For SSB, this is calculated as 0.23 (averaged over the last five assessments) i.e. 23% overestimation of SSB. Fbar(4-8) (the mean fishing mortality, across ages 4 to 8) is relatively well estimated and Mohn’s ρ is calculated as -16 %. Typically, assessments with Mohn’s ρ for SSB estimated within -15% and 20% are considered sufficiently robust for the provision of catch advice by ICES (ICES, 2020).
Stock summary
The stock summary from the SAM assessment is shown in Figure 3.10 and Table A.11. More detailed outputs, including estimates of model parameters, stock numbers-at-age and fishing mortality-at-age can be found in Tables A.12 – A.14.
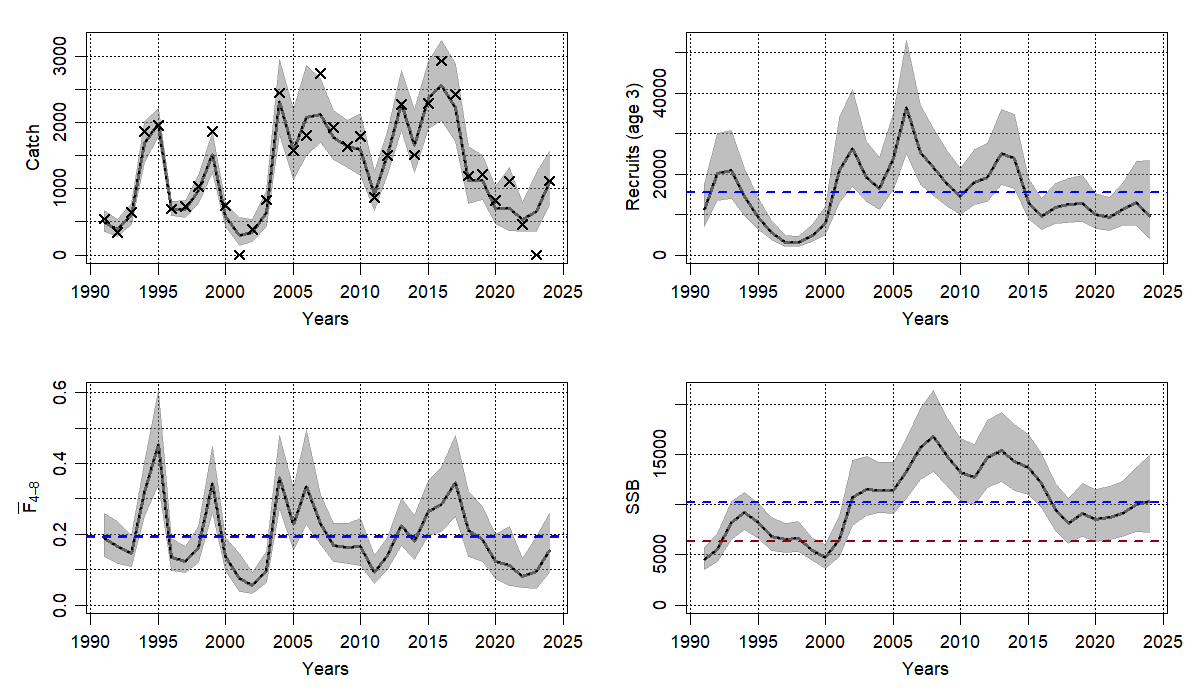
Following a number of very strong year classes between 2000 and 2015, recent recruitment continues to be below the long-term (full time series) average. SSB subsequently declined to just below the long-term average in 2018 but has increased gradually to around the long-term average since then. Fbar(4-8) is also estimated to have decreased substantially over the last decade and in 2022 was estimated to be one of the lowest values of the time series. However, it is now estimated to be increasing though still below the long-term average. There appears to be no clear relationship between stock size (SSB) and recruitment to the fishery at age three (Figure A.10).
Provisional reference points, as derived in the 2023 assessment (Dobby et al., 2025), are defined below.
| Reference point | Value | Notes |
|---|---|---|
| F0.1 | 0.19 | Derived from 2023 assessment results. Used as a conservative proxy for FMSY (See Figure A.11). |
| Bpa | 6 359 tonnes | Bloss × exp(1.645 × σ); Bloss = 4 576 tonnes (lowest SSB (1991) from 2023 assessment), σ = 0.2 (max(0.2, CV on estimate of SSB 2022)). |
The final estimates of current Fbar(4-8) and SSB for 2024 are 0.155 and 10,351 t respectively. Comparing these values to the provisional reference points indicates that the stock is being fished below the FMSY proxy and SSB is well above the precautionary biomass reference point (Bpa). Given that current estimates of F and SSB are well below/above the relevant reference points, conclusions in terms of stock status are likely to be robust to the moderate retrospective uncertainty estimated for this stock.
Comparison with previous assessment
A comparison between this latest assessment and that given in the 2023 report is presented in Figure 3.11. The historical trends show good agreement, especially in recruitment. The latest assessment estimates a slightly higher Fbar(4-8) since 2002 than the previous assessment and also a small divergence in biomass estimates since then (lower in the most recent assessment).
3.4. North East
Description of the fishery
The North East scallop fishery developed in the 1980s and landings peaked in the mid-1990s at over 3,000 t. In 2019, landings were 507 t and have shown a generally increasing trend since then (over 2000 t in 2024) although with substantial inter-annual variability. (Figure 3.1). The current fishery is principally a dredge fishery prosecuted by a large fleet of both local and visiting vessels. Almost 50% of landings go into Fraserburgh, followed by Buckie (~17%) and Peterhead (~14%).
Catch-at-age data
Sampling of the landings has been carried out since the beginning of the fishery (Table A.5). In recent years, sampling levels have been particularly poor, likely to be due to a lack of sampling opportunities relating to recent lower level of landings, though 2024 saw an increase in trips sampled. The Covid-19 pandemic is also likely to have resulted in reduced sampling opportunities during 2020 to 2022.
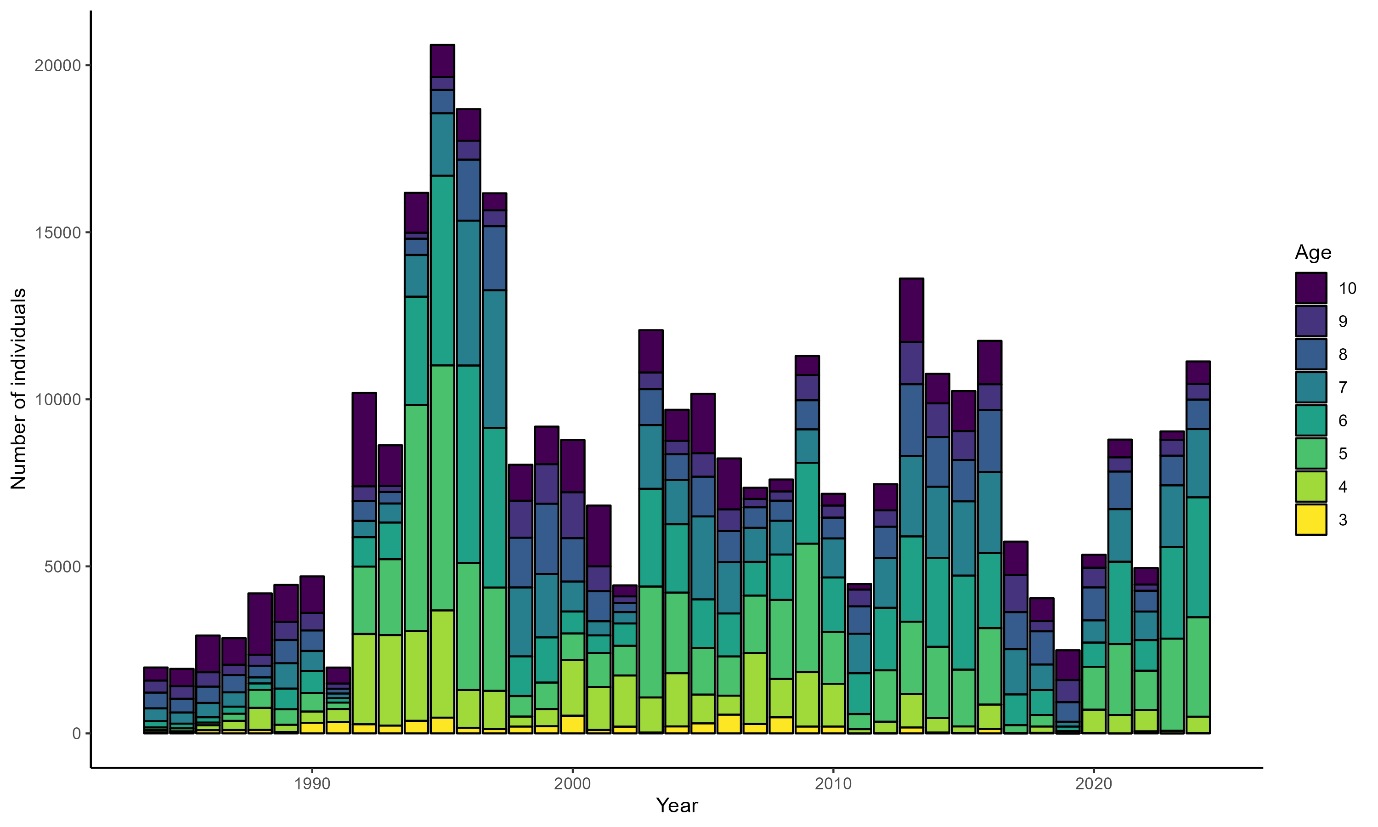
Catch-at-age data for the North East are available from 1984 onwards. The data are shown in Figure 3.12 and Table A.15. In the early part of the time series, catches were more dominated by individuals in the 10+ age category, whereas more recently, the catches consist largely of age five to seven year olds (with the exception of 2019 where there are a high proportion of 8-10+ year olds in the landings). The catch-at-age data continue to show consistently lower numbers of individuals at younger ages likely indicating only partial recruitment to the fishery up to age five.
Biological data
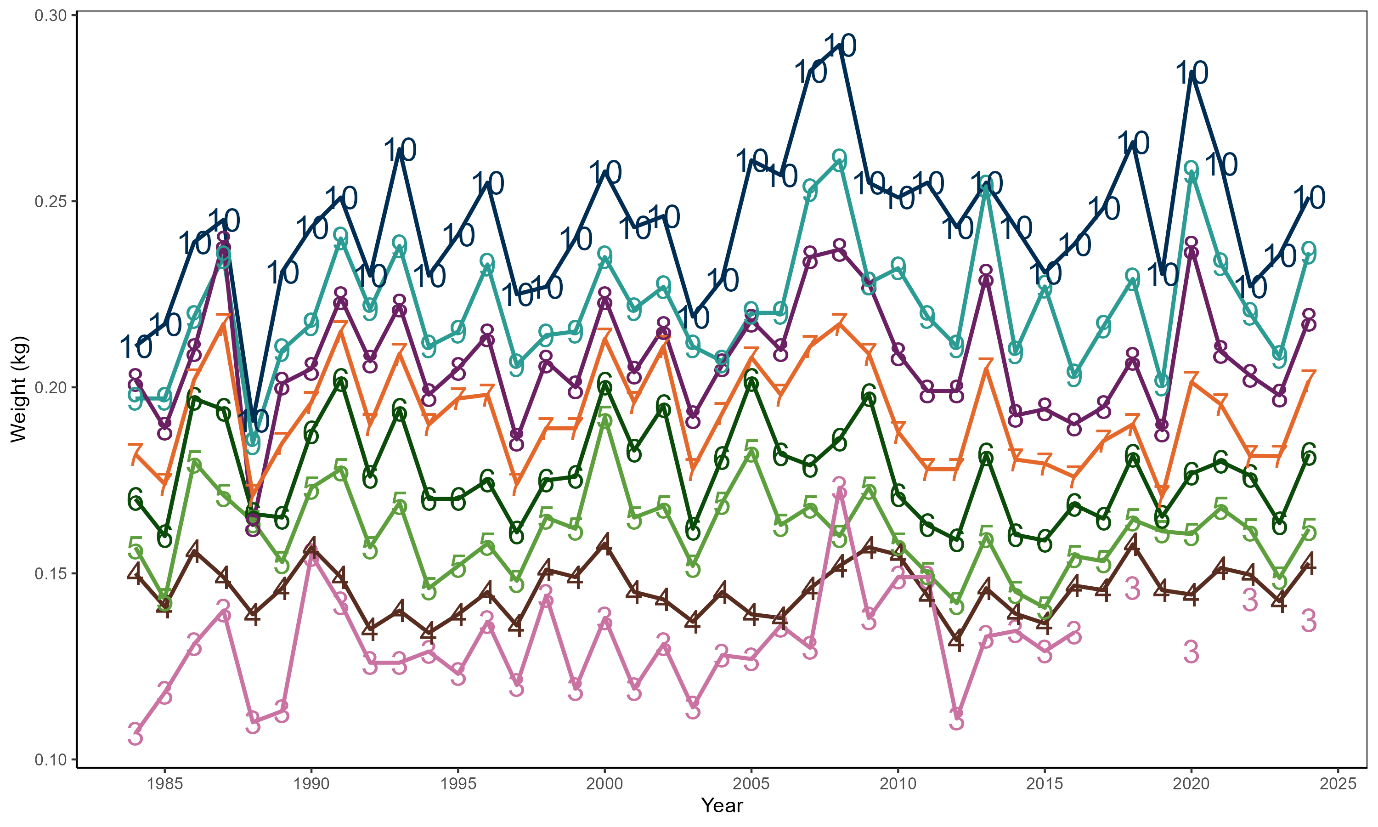
The historical mean weights-at-age show variability, but no systematic trend until the mid-2000s when mean weights of older individuals increased until 2008 and then declined to more ‘normal’ values (Figure 3.13 and Table A.16). This coincides with the period when sampling levels became more variable and when ages nine and ten plus, in particular, were less apparent in the sampled landings. The increase in mean size at older ages in this period may therefore be an artefact associated with sampling variability. Similarly, in recent years sampling levels have reduced which may explain the large interannual variability in mean weights at older ages (particularly the change from 2019 to 2020), and the lack of age 3 in catch samples altogether.
Exploratory analysis
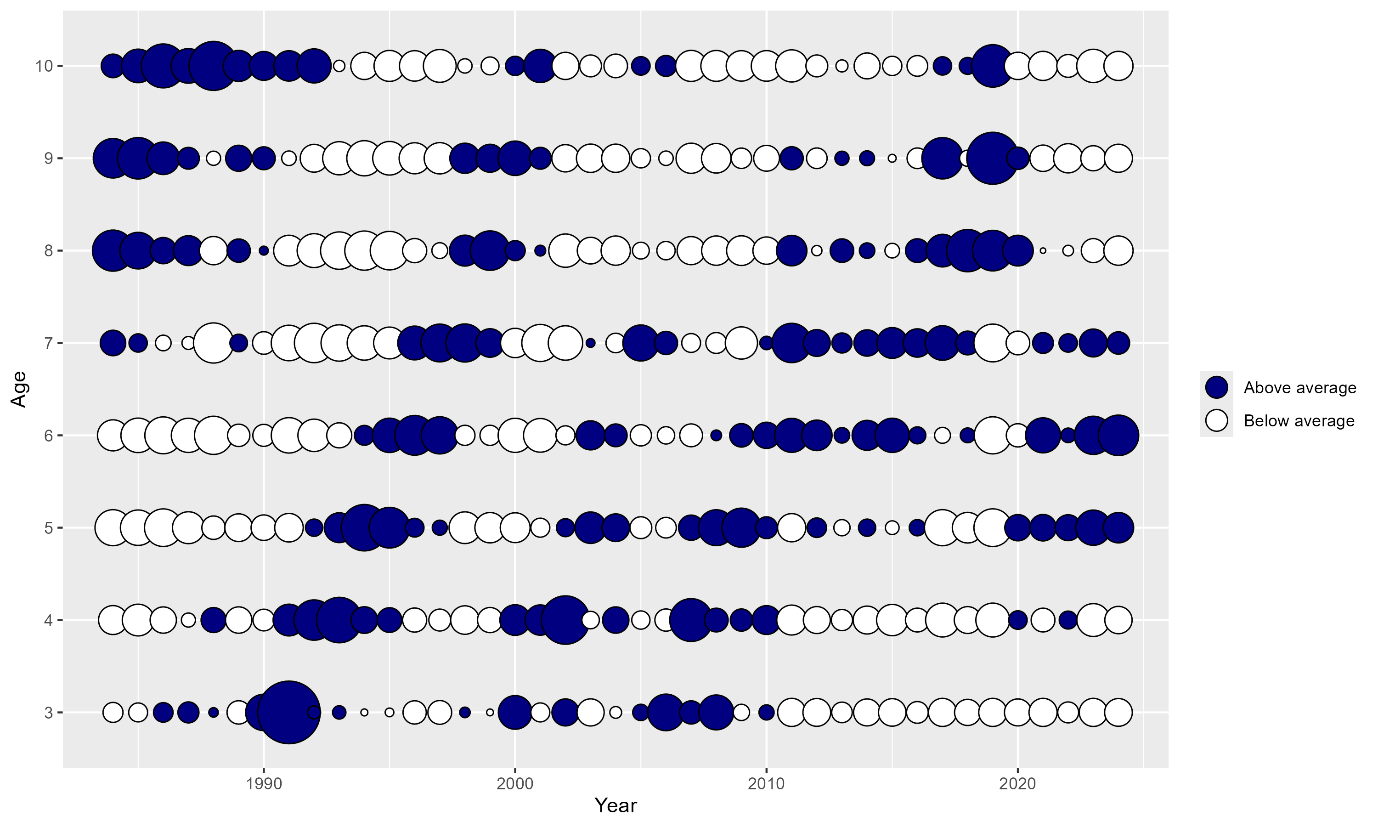
Catch-at-age data by proportion (normalised by mean and standard deviation across age class) are shown in Figure 3.14 with dark bubbles indicating values higher than the age-class mean. Following a period of apparently poor recruitment in the late 1980s, the commercial catch-at-age data consistently suggest above average catches for the 1988 to 1991 cohorts across most age classes. Data from the more recent period suggest below average recruitment since 2010, but in the 2018-2020 period, there is an indication of above average catch numbers at the older ages of these cohorts, then after 2020 ages 5, 6, and 7 are consistently above average, again despite the relevant cohorts showing below average recruitment. This potentially suggests periods of altered survival/fishing mortality or a change in fishery selectivity.
Details of the surveys which have been carried out in the North East assessment area are given in Table A.8 and discussed in Section 3.3. Previous scallop stock assessments have suggested that despite standardisation of catch rates (to account for differences in the number of dredges worked and dredge width), survey vessel may have a significant impact on catchability. Therefore, in this assessment, the survey data are treated as two separate series. The Clupea dredge survey runs from 1997 to 2007 and the Alba survey from 2008 onwards, but with a missing year in 2020 due to disruption associated with the Covid-19 pandemic. (Tables A.8 and A.17).
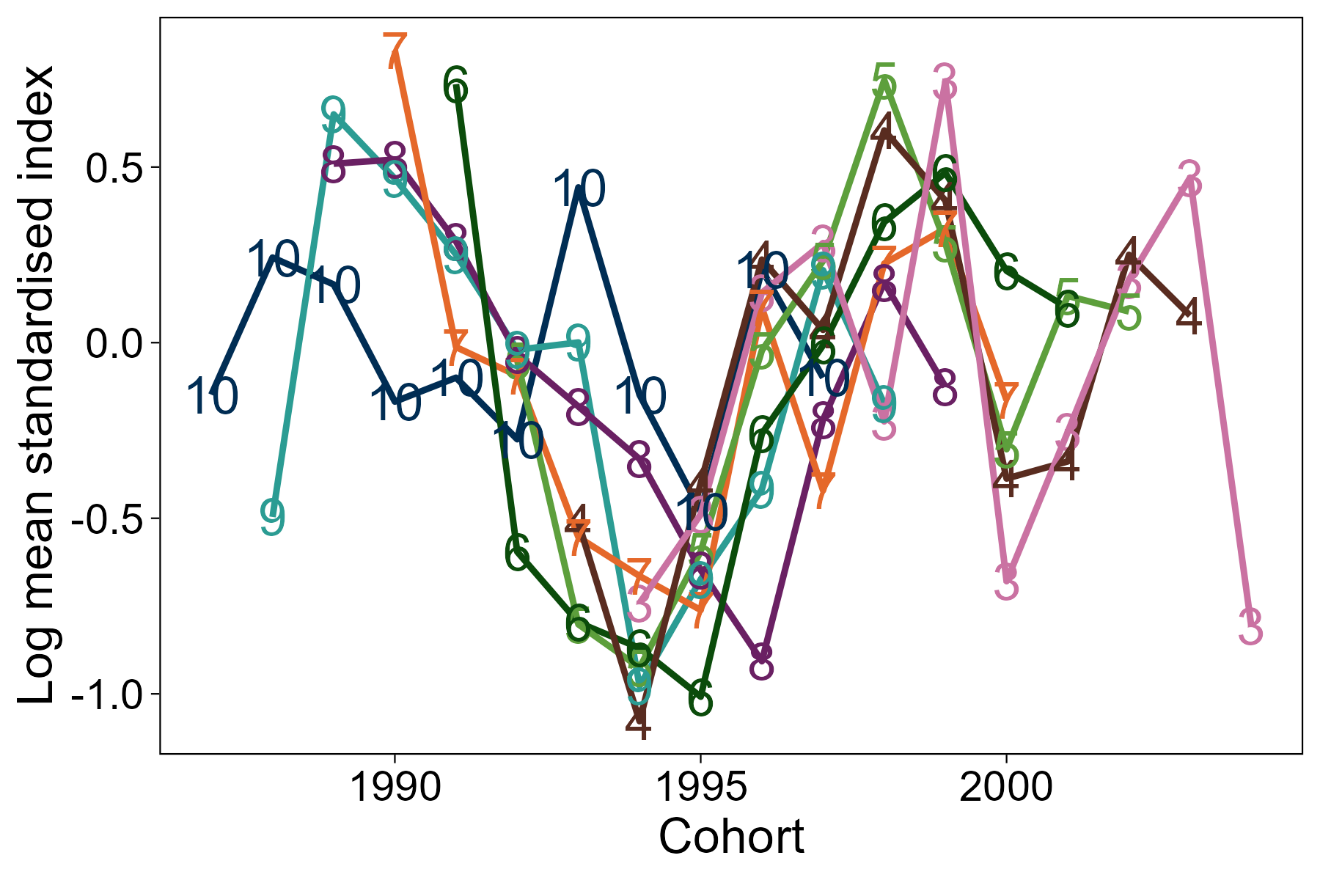
Mean standardised survey catch rates-at-age by cohort are shown in Figure 3.15 for the two surveys separately (Clupea and Alba). Following a number of weak year classes during the mid-1990s (recruiting in the late 1990s at age 3), the Clupea survey suggests good recruitment in the years 2001 and 2002 and tracks these cohorts (1998 and 1999) with above average catch rates across a range of age classes. The early part of the Alba survey also identifies the 2003 and 2004 year classes (recruitment in 2006 and 2007) as strong across a range of older age classes. Thereafter there appear to be some periodic fluctuations in year class strength, although the index at age 3 does not appear to be a good indicator of abundance at older ages.

The catch rates of scallops (age three and 4+ separately) at stations across the North East assessment area are shown in Figure 3.8 Coverage of the grounds (in terms of number of stations) was similar between 2023 and 2024, and total catch rates also appear to be generally similar, though as in the East Coast there are fewer survey stations with catches of age 3 individuals (recruitment) in 2024 compared with 2023.
Further plots exploring the quality and consistency of both the catch and survey data (catch curves and scatterplots) are included in the Appendix (Figures A.12 to A.15).
Final Assessment
Input data are consistent with previous assessments and are summarised below:
| Data Type | Year Range | Age Range | Notes |
|---|---|---|---|
| Catch numbers-at-age | 1984 - 2024 | 3 - 10+ | - |
| Catch weights-at-age | 1984 - 2024 | 3 - 10+ | - |
| Clupea Survey numbers-at-age | 1997 - 2007 | 3 - 9 | - |
| Alba Survey numbers-at-age | 2008 - 2024 | 3 - 9 | Missing year in 2020 due to Covid-19 pandemic |
| Stock weights-at-age | 1991 - 2024 | 3 - 10+ | Assumed equal to catch weights-at-age |
| Maturity-at-age | 1991 - 2024 | 3+ | All ages assumed mature |
| Natural mortality-at-age | 1991 - 2024 | 3+ | 0.15 all ages (based on likely longevity) |
The main features of the final model can be summarised as follows and are broadly similar to those for the East Coast assessment, though no catch biomass data are used:
- Fishing mortality at ages 9 and above are assumed equal (coupled).
- Survey catchabilities are uncoupled across all ages for the Clupea survey and are coupled at ages 7 and above for the Alba survey.
- Catch observation variance parameters are coupled across ages 5 to 9 and uncoupled at other ages. To account for the variation in sampling levels over time, the number of catch samples per year is used to weight the data such that the catch data from those years with a greater number of samples is given a greater weight in the assessment.
- Survey observation error is coupled for ages 4 and above (both surveys).
- Recruitment at age 3 is modelled as a random walk.
- Fishing mortality-at-age is modelled with AR(1) and process variance parameters are coupled across all ages.
- Process variances in stock numbers-at-age were assumed coupled with the exception of age 3 (the age at recruitment). In the previous assessment, model convergence issues were encountered when estimating the process error for ages 4 and above, therefore this parameter was fixed at an arbitrary small value. (-5 on log scale and small in comparison to the estimated recruitment process error).
The final SAM configuration file is given in Table A.18.
Estimates of model parameters, stock numbers-at-age and fishing mortality-at-age can be found in Tables A.20 to A.22.
The model predictions of catch and survey numbers-at-age track the observations relatively well across most ages (Figure A.16 to Figure A.18). The exceptions to this are the younger ages in both catch and surveys, and the 10+ age group in the catch which are estimated to have greater observation uncertainty (Table A.20).
There are no major patterns or trends in the one-step-ahead residuals or process residuals (Figure A.19 and A.20) and nearly all errors lie within ±3 standard deviations, though there is one outlier approximately -4 and one approximately +6 in the one step ahead residuals (both early in the catch data), and one outlier process residual of approximately +4.
The full set of input data, model configuration and assessment results can be found on the stockassessment.org website.
Retrospective analysis
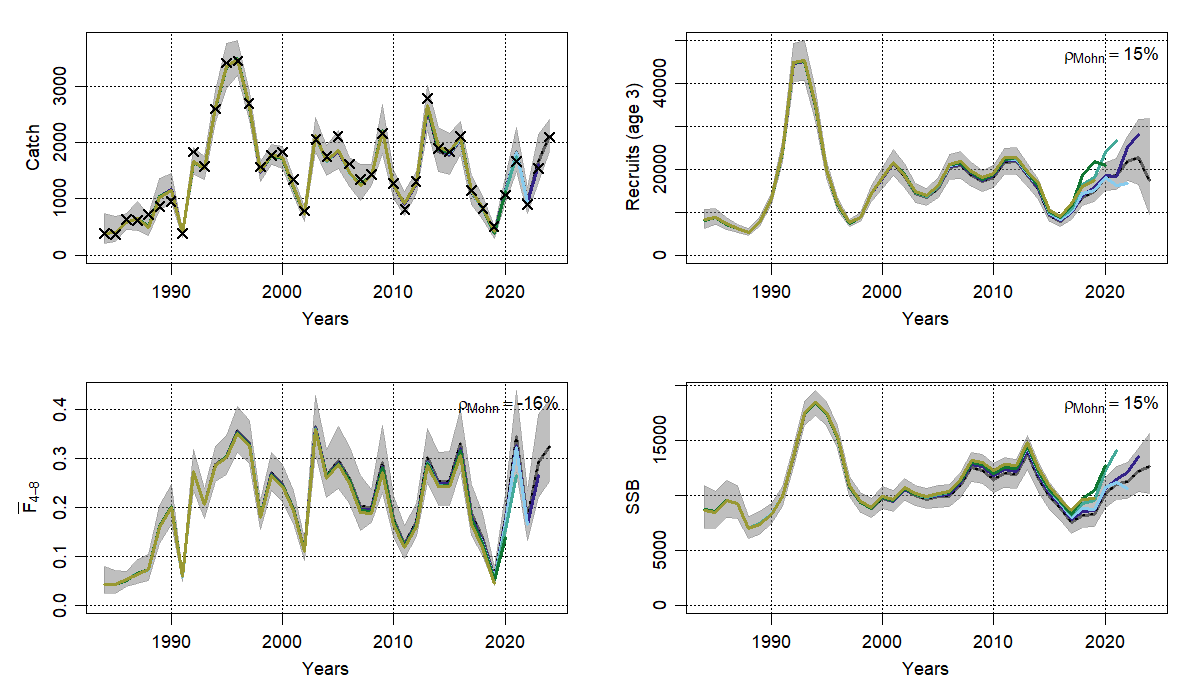
The retrospective plots shown in Figure 3.16 indicate that in general the assessment tends to overestimate the recruitment, and consequently the SSB, in the final year (i.e. that estimates are revised downwards with each additional year’s data). For SSB this is most apparent in the peels ending in 2020 and 2021 which show substantial over-estimation while the later peels are more consistent with the final assessment. Mohn’s ρ (average under-/overestimation) for SSB is calculated as 15% and for Fbar(4-8) is -16%. Typically, assessments with Mohn’s ρ for SSB estimated within -15% and 20% are considered sufficiently robust for the provision of catch advice by ICES (ICES, 2020).
Stock summary
The stock summary from the SAM assessment is shown in Figure 3.17 and Table A.19.
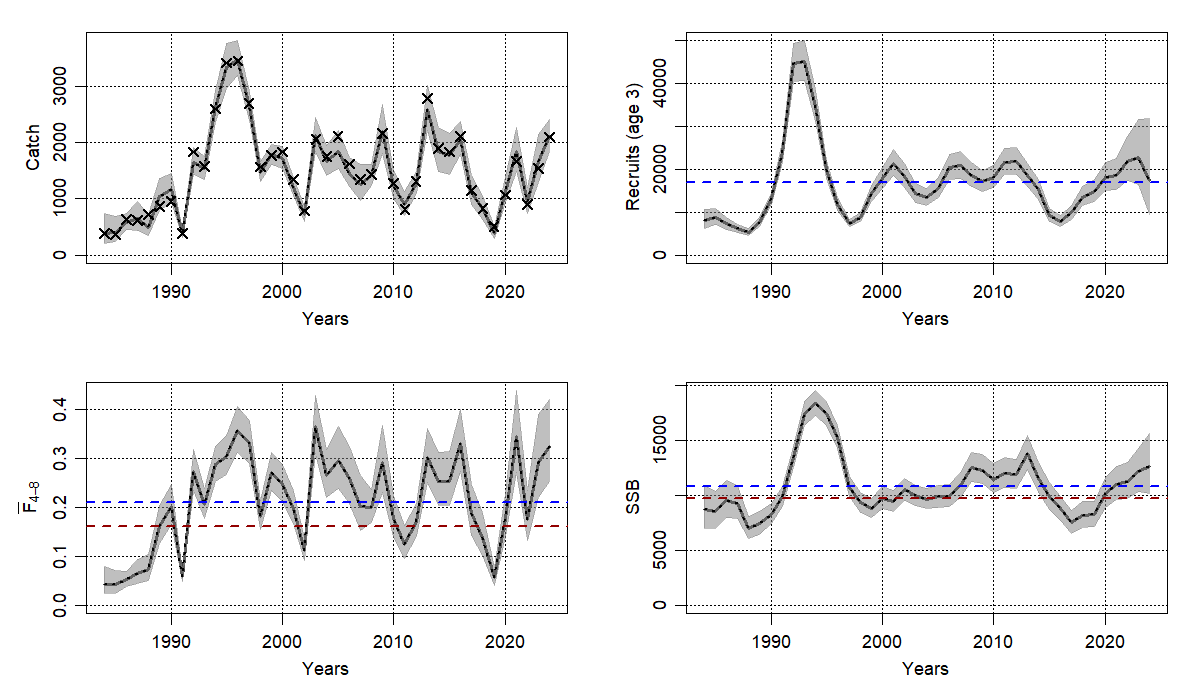
A number of very strong year classes in the early 1990s resulted in a rapid increase in stock size and catches in that period. After low recruitment in the years 2015-2016 followed by low SSB (2016-2019), both have increased since then, and SSB in 2024 is above the long-term average.
The fluctuations in catch (and fishing mortality) closely track those of SSB (and recruitment) suggesting that the fishery targets the strong year classes. The increase in catches in 2023 and 2024 has resulted in an increase in F which is estimated to be well above the long-term average in 2024.
Provisional reference points estimated for this stock in 2023 are used here and are given below.
| Reference point | Value | Notes |
|---|---|---|
| F0.1 | 0.16 | Derived from 2023 assessment results. Used as a conservative proxy for FMSY. |
| Bpa | 9 706 tonnes | Bloss × exp(1.645 × σ); Bloss = 6 985 tonnes (lowest SSB (1988) from 2023 assessment), σ = 0.2 (max(0.2, CV on estimate of SSB 2022)) |
The final estimates of current Fbar(4-8) and SSB for 2024 are 0.325 and 12,662 t respectively (Table A.22). Comparing these values to the provisional reference points indicates that the stock is being fished above the FMSY proxy and the SSB is above the precautionary biomass reference point. There is a small degree of retrospective bias associated with the SSB, however, given the level of current SSB relative to the reference point, the conclusions in terms of SSB stock status are likely to be robust to this uncertainty. The conclusions about F stock status are not affected by the retrospective bias due to the direction of the bias (F is underestimated) and that the stock is already considered to be fished above the reference point.
Comparison with previous assessment
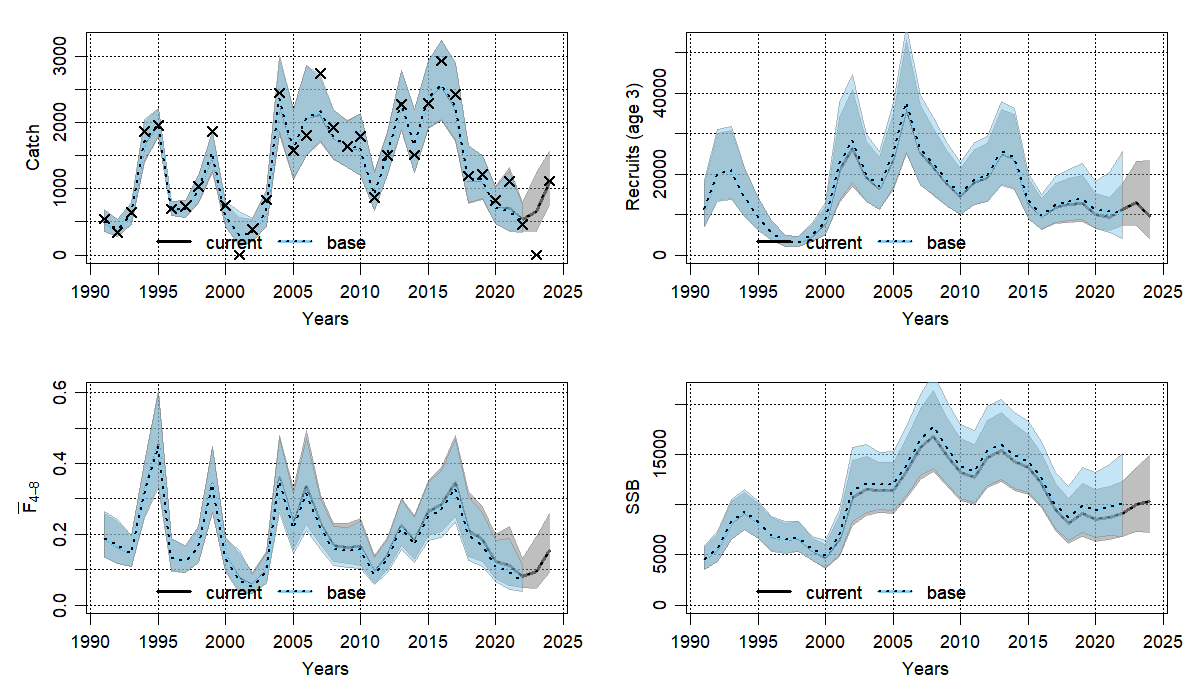
The last Scottish scallop assessment report, using data up to 2022, was published in 2025 (Dobby et al., 2025). A comparison between the latest assessment and that given in the 2025 report is presented in Figure 3.18. The two assessments are very consistent, with the current assessment estimating only a marginally lower SSB (and higher F) than the previous assessment from around 2007 to 2022 and also estimating a higher recruitment (with slightly narrower confidence intervals) since 2020.

3.5. North West
Description of the fishery
The North West assessment area covers much of the west coast of Scotland and the waters around the Hebrides. There is a long history of scallop fishing in this area and the main fishing grounds are to the north of Skye and further south around the Inner Hebrides. Landings have declined over the past decade (Figure 3.1), and total landings were 1,287 t in 2024, ~52% of the 2016 landings (and approximately one quarter of peak landings in the early 2000s). There is also a small but significant dive fishery in this area which largely operates in sheltered inshore waters. In 2024, the dive fishery accounted for just over 12% of Scottish scallop landings from the North West area.
Catch-at-age data
The North West area has generally been well sampled since the late 1980s. As in other assessment areas, sampling levels have declined in recent years. Reasons for this include fewer sampling trips (since 2020, Table A.5) due to the Covid-19 pandemic and a smaller fishery (Figure 3.1).
Catch-at-age data for the North West are available from 1982 onwards. The data are shown in Figure 3.19 and Table A.23. In the early part of the time series, a substantial proportion of the catch was from the 10+ age category, whereas more recently, the catches consist largely of age four to seven year olds. The catch-at-age data show consistently lower numbers of individuals at younger ages likely indicating only partial recruitment to the fishery up to age five.

Biological data
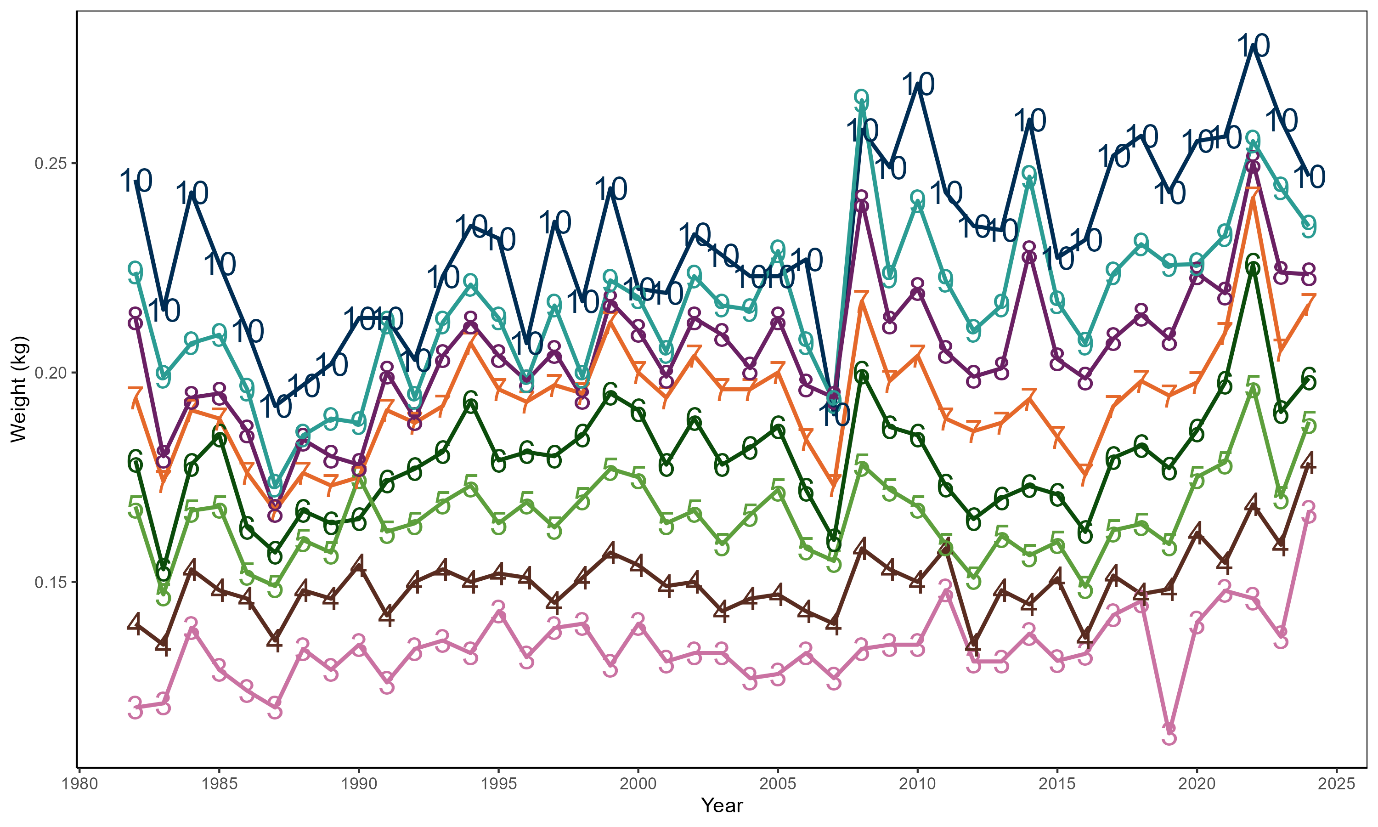
The mean weights-at-age are shown in Figure 3.20 and Table A.24. The mean weights of individuals aged five to ten shows a gradual increase from the late 1980s to mid-1990s, and also in more recent years (2016 onwards). Since 2022, mean weights across most ages have been at (or close to) the maximum of the time series. In general, there are similar inter-annual variations across age classes, although age 3 in 2019 does not follow this pattern and appears to be a significant outlier. There are a number of periods (2007-2008 and 2021-2023) which show substantial inter-annual variability in mean weights, particularly at ages 5 and above. Some of this could be associated with sampling uncertainty due to low numbers of samples, which is particularly the case in 2007 and 2022 (Table A.5)
Exploratory analysis
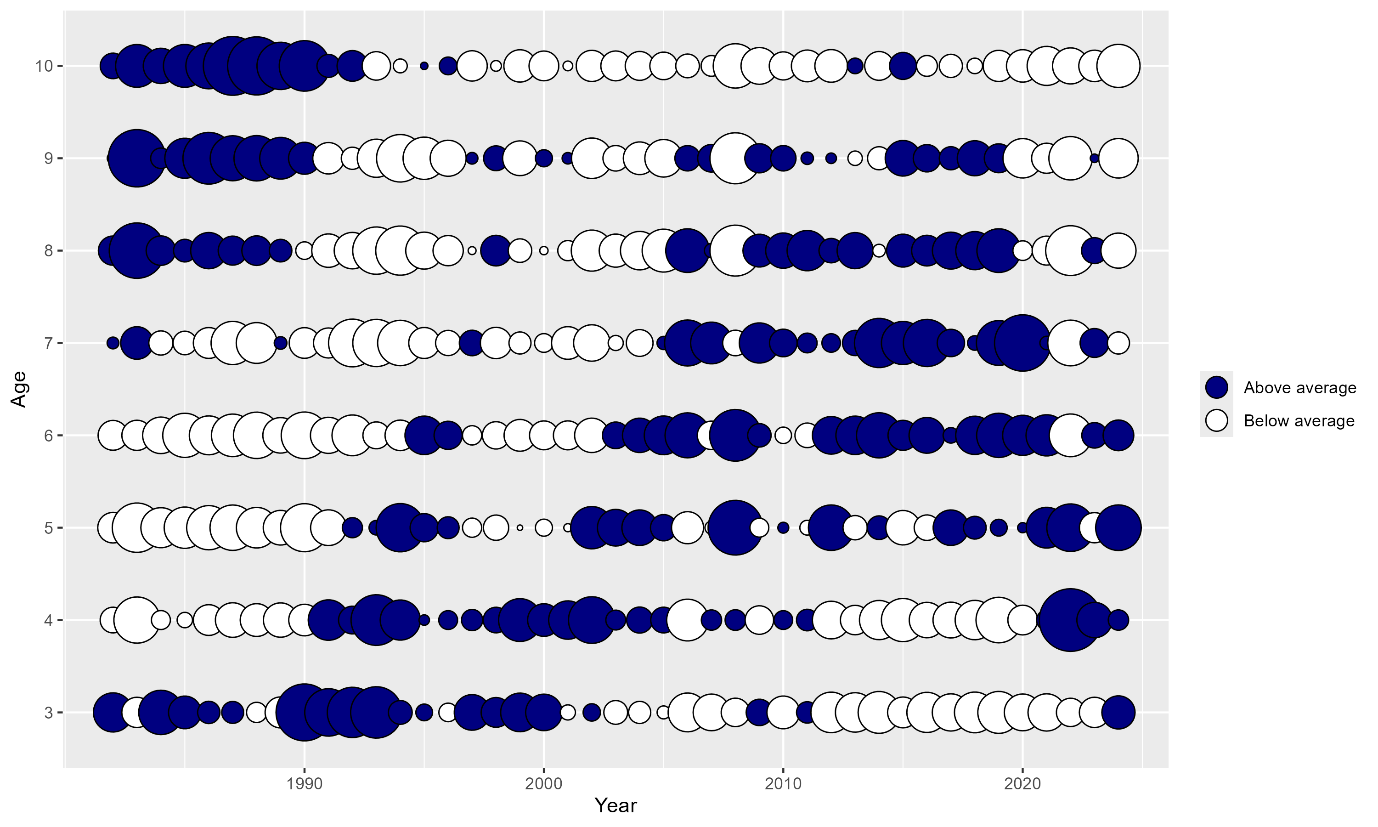
Catch-at-age data by proportion (normalised by mean and standard deviation across age class) are shown in Figure 3.21 with dark bubbles illustrating above average values. There is some limited evidence that the data track relative year class strength during the 1990s and early 2000s. However, the more recent data appear very noisy, and it is not possible to identify any cohorts which make a consistently above (or below) average contribution to the catch across all ages. 2024 indicates the first higher than average proportion of age 3 in over a decade.
Details of the surveys which have been carried out in the North West assessment area are given in Table A.25. A number of partial dredge surveys of the west of Scotland were carried out in the late 1980s: however, the surveys were not conducted consistently by the same vessel. From 1993 the survey was conducted consistently by RV Aora I with a change to RV Aora II in 2003 and a further vessel change to RV Alba na Mara in 2008. No comparative tows were conducted to compare catch rates between vessels. As in the 2023 assessment (following previous analysis suggesting survey vessel may have a significant impact on catchability) the survey data are treated as separate time series for each vessel (Table A. 26). No survey was conducted in 2020 due to disruption associated with the Covid-19 pandemic. In 2021, there was further disruption to the survey resulting in only 28 stations being carried out across a small proportion of the assessment area. For that reason, the survey data for 2021 are considered unlikely to be representative of the stock and are excluded from the assessment.
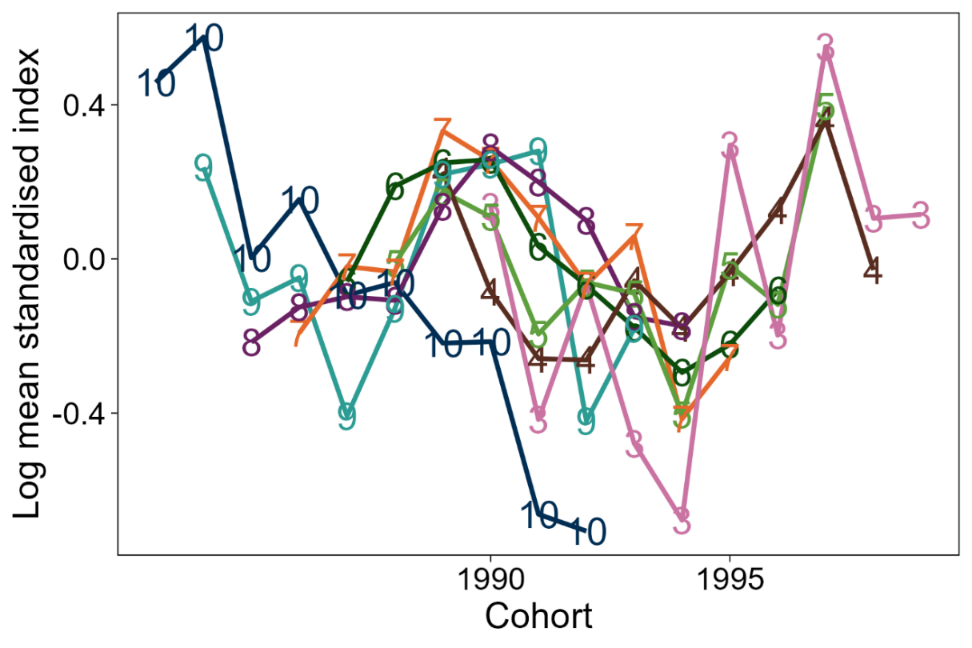

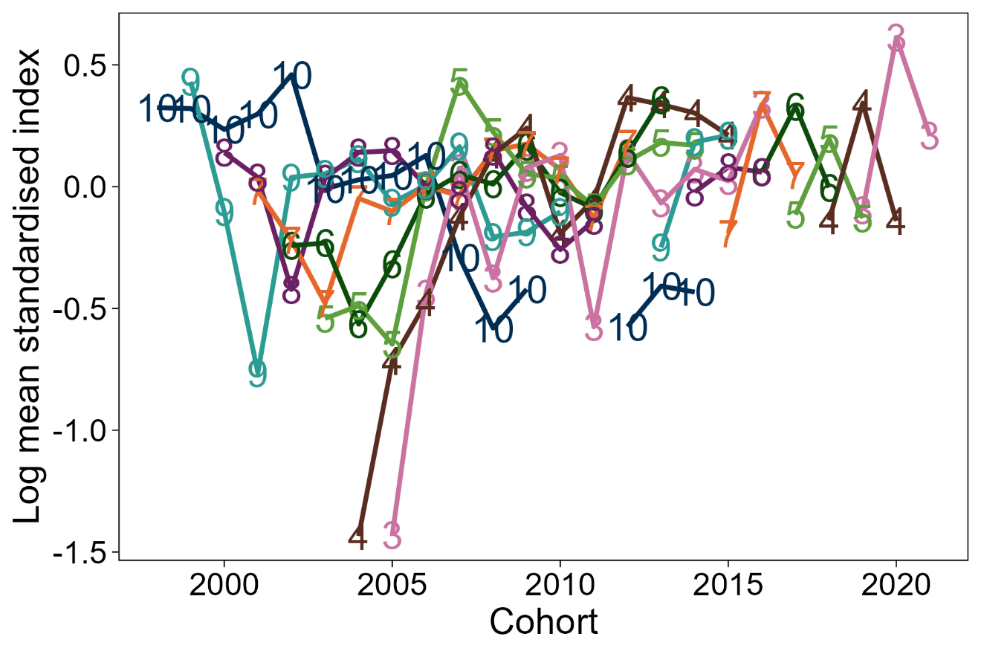
Log mean standardised survey catch rates-at-age by cohort are shown in Figure 3.22 for the three surveys separately (Aora I, Aora II and Alba). There is reasonable tracking of cohort strength in both Aora surveys. The Aora I survey identifies high recruitment in the early 1990s and then increasing recruitment in the late 1990s, which is estimated relatively consistently over a wide range of age classes in the Aora II survey as well. The Alba survey is much noisier with no apparent consistency in cohort trends. The missing years of survey data (2020 and 2021) make it difficult to draw conclusions about year class strength from these data for the more recent time period. However, there does appear to be a year effect, with a peak across all ages in 2023 apparent in both the cohort (Figure 3.22) and year (Figure A. 24) plots of log mean standardised index. Potentially this could be due to a change in timing of the survey for 2023 from April/May to February/March, with the population being sampled earlier in the fishing season.
Final Assessment
As in the 2023 assessment, ages two and 10+ were excluded from the final assessment following previous exploratory analysis indicating high variability in catch rates of these age groups.
A summary of the assessment input data is provided below:
| Data Type | Year Range | Age Range | Notes |
|---|---|---|---|
| Catch numbers-at-age | 1982 – 2024 | 3 - 10+ | - |
| Catch weights-at-age | 1982 – 2024 | 3 - 10+ | - |
| Aora I survey numbers-at-age | 1993 – 2004 | 3 - 9 | - |
| Aora II survey numbers-at-age | 2003 – 2007 | 3 - 9 | - |
| Alba survey numbers-at-age | 2008 – 2024 | 3 - 9 | No survey data for 2020 & 2021 due to disruption associated with Covid-19 |
| Stock weights-at-age | 1982 – 2024 | 3 - 10+ | Assumed equal to catch weights-at-age |
| Maturity-at-age | 1982 - 2024 | 3+ | All ages assumed mature |
| Natural mortality-at-age | 1982 - 2024 | 3+ | 0.15 all ages (based on likely longevity) |
The final model configuration from the 2023 North West scallop assessment was used to specify the model settings (Table A.27), as this had already been modified to improve residual patterns and fit and there was no reason to modify these settings with the inclusion of additional years’ data. The main features of the final model can be summarised as follows and are broadly similar to those for other assessment areas:
- Fishing mortalities at ages 8 and above are assumed equal (coupled).
- Survey catchabilities are coupled at ages 8 and 9 for all surveys.
- Catch observation variance parameters are coupled across ages 5 to 10+ and uncoupled at other ages. To account for the variation in sampling levels over time, the number of catch samples per year is used to weight the data such that the catch data from those years with a greater number of samples is given a greater weight in the assessment.
- Survey observation error is coupled for ages 5 and above (all surveys). The Alba survey is allowed to have AR(1) covariance structure (rather than independent) with the age 3 to 4 correlation parameter uncoupled from other ages.
- Recruitment at age 3 is modelled as a random walk.
- Fishing mortality-at-age is modelled with AR(1) and process variance parameters are coupled across all ages.
- Process variances in stock numbers-at-age were assumed coupled with the exception of age 3 (the age at recruitment). In the previous assessment, model convergence issues were encountered when estimating the process error for ages 4 and above, therefore this parameter was fixed at an arbitrary small value. (-5 on log scale and small in comparison to the estimated recruitment process error).
The model predictions of catch and survey numbers-at-age track the observations relatively well across most ages (Figures A.27-A.30). The exceptions to this are the younger ages in both catch and survey. In particular, the observation uncertainty estimated for age three in the catch is more than three times that at age four and more than four times that for ages five and above (Sd LogObs_0 compared to Sd_LogObs_1 and Sd_LogObs_2 in Table A.29).
There are no major patterns or trends in the one-step-ahead residuals or process residuals (Figures A.31 and A.32) and most errors lie within ±3 standard deviations. The largest outlier (approximately +6 standard deviations) occurs in the first year of catch data (1982) at age 5.
The full set of input data, model configuration and assessment results can be found on the stockassessment.org website.
Retrospective analysis
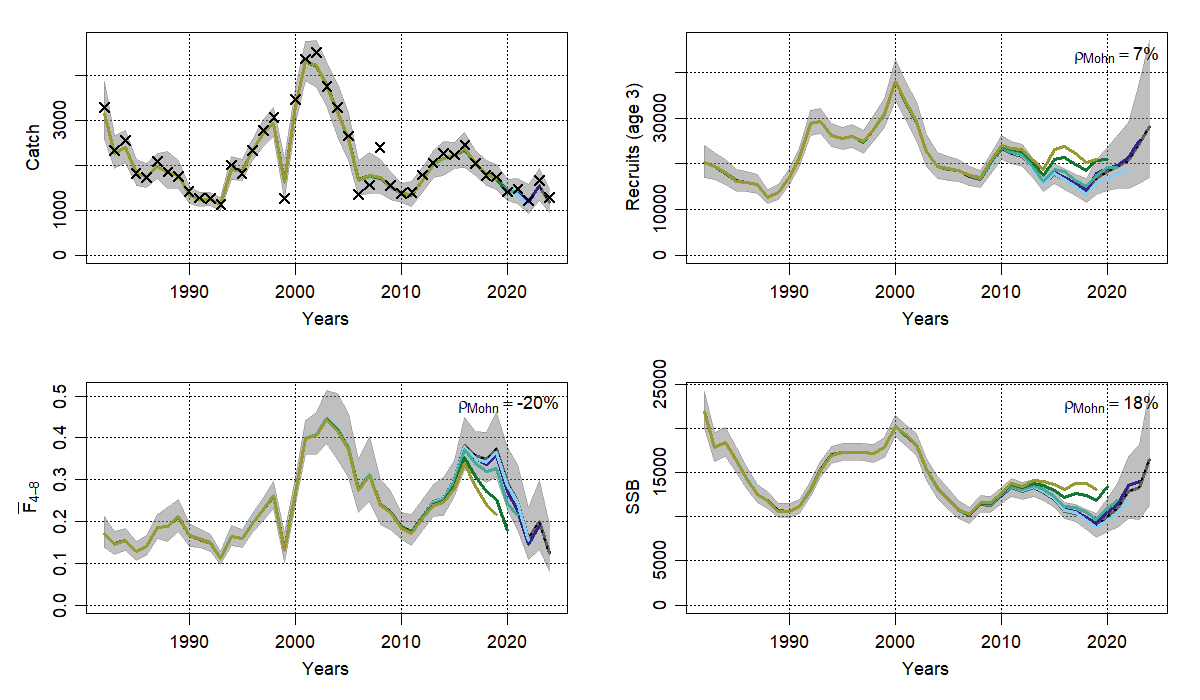
The retrospective plots shown in Figure 3.23 indicate that in general the assessment tends to underestimate fishing mortality, and overestimate the recruitment and consequently the SSB, in the final year (i.e. that SSB estimates are revised downwards with each additional year’s data). Mohn’s ρ (average over-/underestimation) for SSB is calculated as 18% and for Fbar(4-8) is -20%. In these circumstances (values out-with -15% to +20%), ICES may consider the assessment not to be sufficiently robust to be used for the provision of catch advice without additional precautionary considerations or rescaling of assessment results to account for the retrospective revisions.
Stock summary
The stock summary from the SAM assessment is shown in Figure 3.24 and Table A.28. More detailed outputs, including estimates of model parameters, stock numbers-at-age and fishing mortality-at-age can be found in Tables A.29-A.31.

A period of high recruitment from the early 1990s to 2000s resulted in an increase in stock size and catches in that period. Since then, recruitment and stock size have been at a relatively low level but estimates of both SSB and recruitment have risen above the long-term average since 2020.
Fishing mortality was high in the early 2000s and late 2010s but has since declined rapidly and in 2024 is well below the long-term average (due to continued low catches).
There appears to be no clear relationship between stock size (SSB) and recruitment to the fishery at age three, with both low and high recruitment occurring across the range of SSB (Figure A.33).
Provisional reference points have been estimated for this stock and are defined below:
| Reference point | Value | Notes |
|---|---|---|
| F0.1 | 0.17 | Derived from 2023 assessment results. Used as a conservative proxy for FMSY |
| Bpa | 12 991 tonnes | Bloss × exp(1.645 × σ); Bloss = 8 768 tonnes (lowest SSB (2019) from 2023 assessment) σ = 0.239 (max(0.2, CV on estimate of SSB 2022)); |
The final estimates of current Fbar(4-8) and SSB for 2024 are 0.124 and 16,519 t respectively. Comparing these values to the provisional reference points indicates that the stock is being fished below the FMSY proxy and the SSB is above the precautionary biomass reference point. The retrospective analysis indicates that F tends to be underestimated by the assessment and SSB slightly overestimated. However, given the estimates of current F and SSB in relation to the reference points, the bias is unlikely to affect the conclusions on stock status.
Comparison with previous assessment
The last Scottish scallop assessment report was published in 2025 (Dobby et al., 2025). There is close consistency between the results from the last and current assessments (Figure 3.25) with only a minor divergence in recruitment and SSB estimates since 2019 (estimated to be higher in the more recent assessment).

3.6. Orkney
Description of the fishery
The Orkney scallop fishery began in the 1970s but has historically been relatively small in comparison to fisheries in other assessment areas and is typically dominated by the dive fishery. In 2024, landings totalled 489 t with ~50% of landings dive caught). In recent years, the fishery has consisted of around 7 local vessels with the majority of landings going into Kirkwall. Most of the dredge landings are taken by visiting vessels that operate around the coast and are landed into ports on the mainland.
Data
Catch sampling levels for Orkney have remained at a reasonable level in recent years (Table A.5) and raised catch numbers-at-age data are available. There are no fishery independent survey data available for this area which has precluded the development of an analytical assessment.
3.7. Shetland
Description of the fishery
The Shetland scallop fishery developed in the late 1960s. Landings have shown an almost continuously increasing trend since the Shetland Shellfish Management Organisation (SSMO) took on responsibility for management of the fishery in this area and were over 1,600 t in 2024. The fishery is almost entirely a dredge fishery and is prosecuted by over 25 local vessels, most of which are less than 10 m in length. These vessels fish out of many different harbours around the coast of Shetland, although the majority of landings go into Symbister (Whalsay), Lerwick, Sullom, and Collafirth. Note that landings reported here for Shetland include all landings from the Shetland assessment area and therefore may differ to those reported to the SSMO (which is responsible for management out to six nautical miles only).
Catch-at-age data
The landings from the Shetland area have been consistently well sampled since the late 1980s (Table A.5). Samples from the Shetland area are collected and provided by staff from University of Highland and Islands (UHI) under a Memorandum of Understanding (MoU) with the MD.
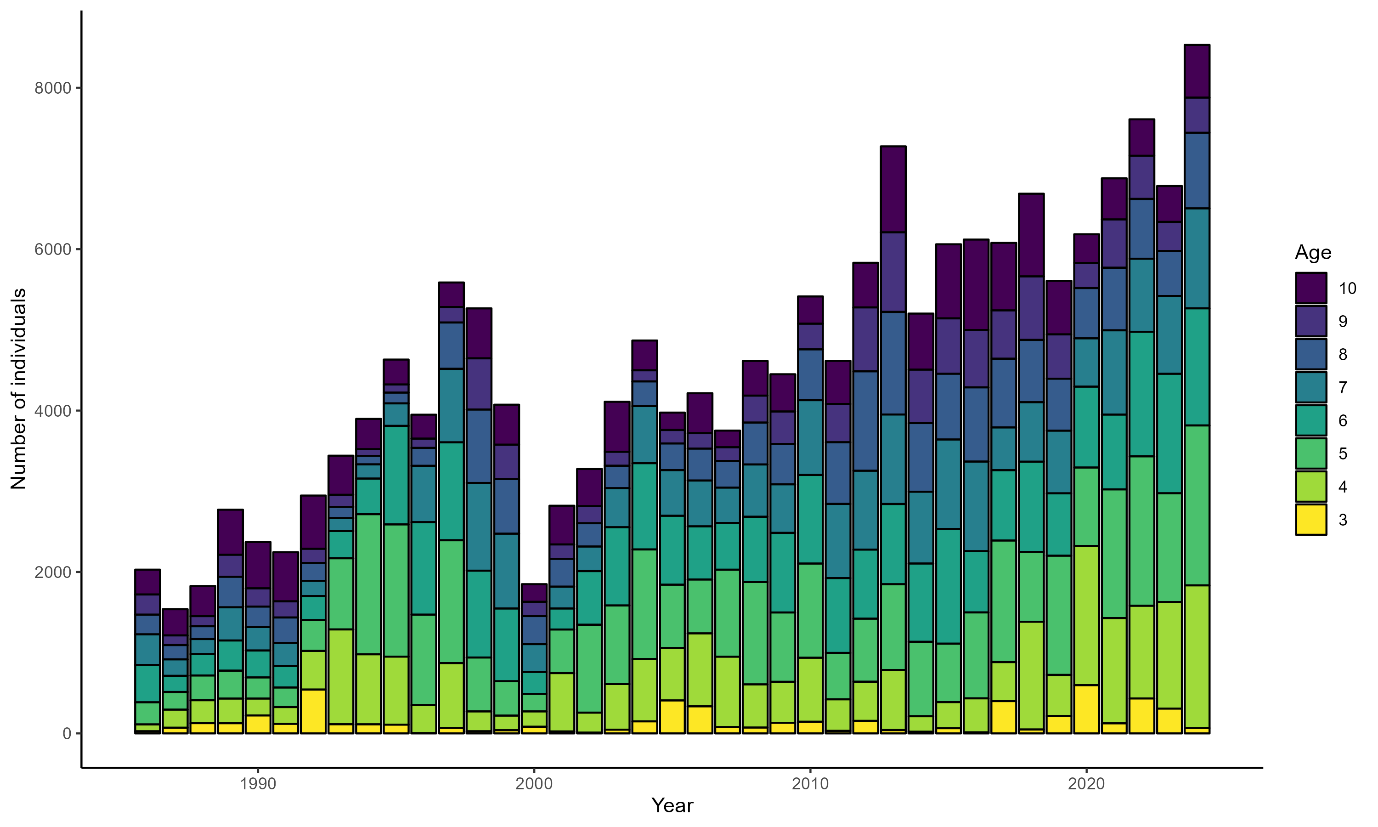
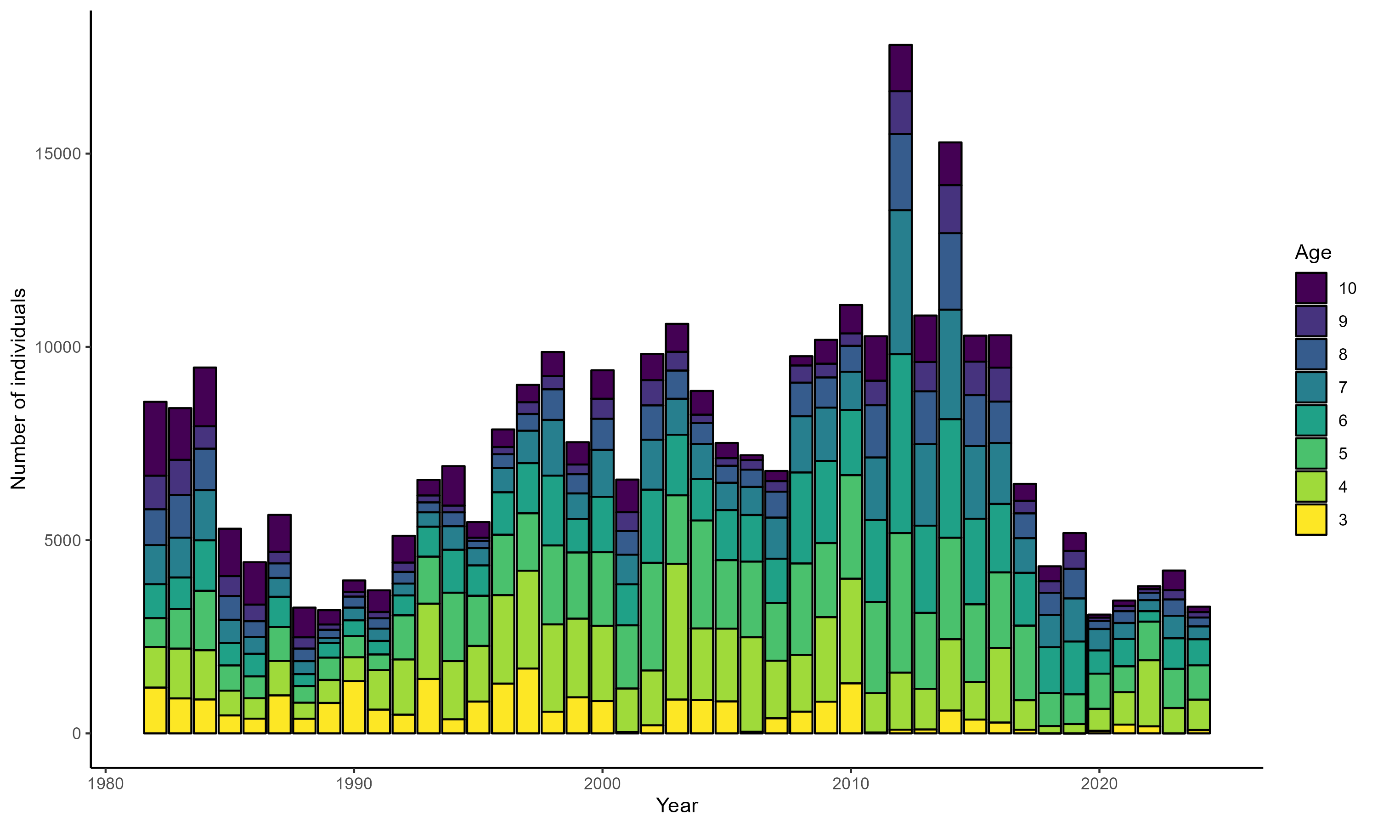
Catch-at-age data for the Shetland area are available from 1986 onwards (Table A.32 and Figure 3.26). The catch-at-age data show consistently lower numbers of individuals at younger ages likely indicating only partial recruitment to the fishery up to age five. In the early part of the time series, a substantial proportion of the catch was from the 10+ age category and additionally, more recently the catch consists of a significant proportion of older age individuals (> 50% are age seven and above in 2011-2019, and ~30% since then).
Biological data
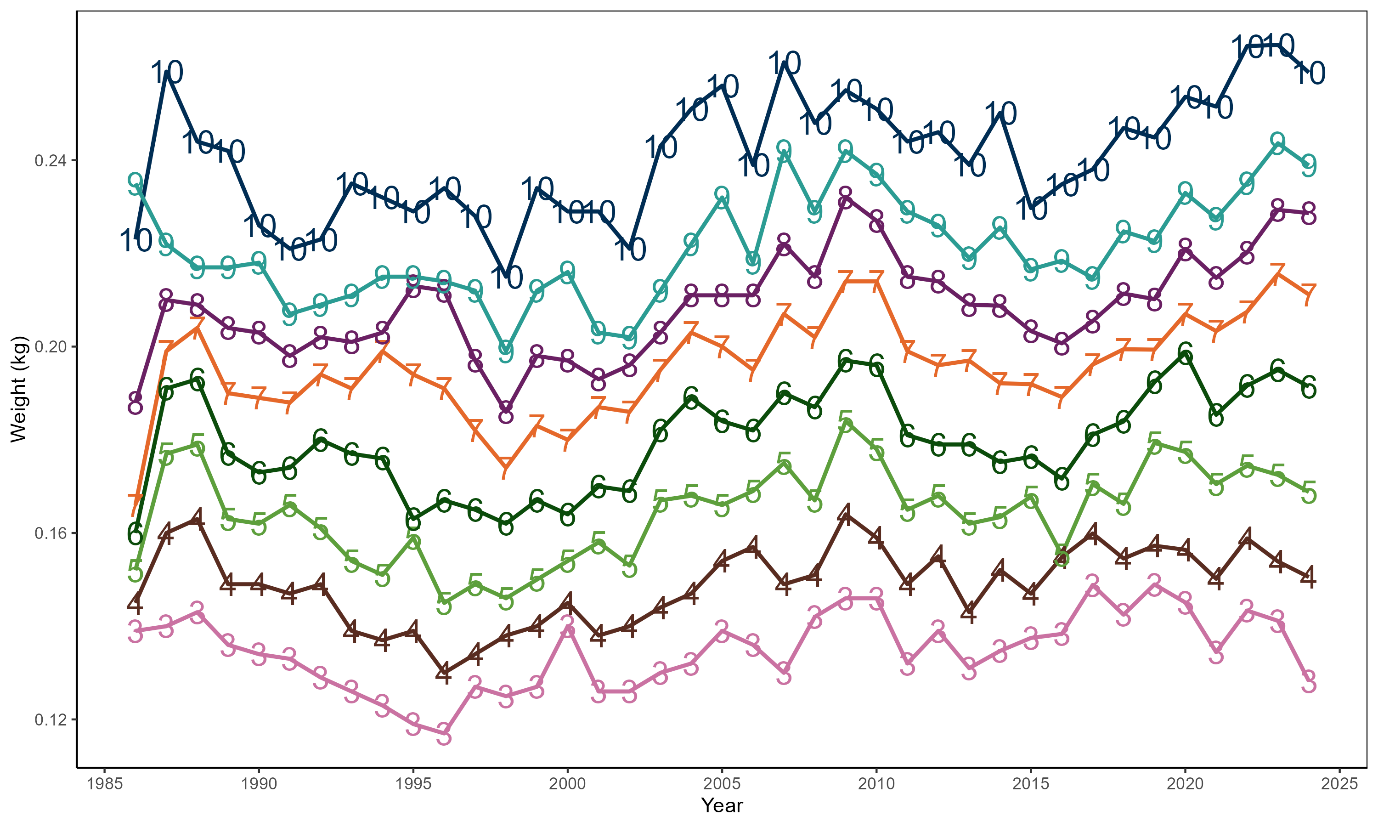
The mean weights-at-age are shown in Figure 3.27 and Table A.33. The mean weights of individuals show periodic fluctuations with higher values across all ages between 2005 to 2010, and then an increasing trend from around 2015 onwards, particularly at older ages, with a slight downturn in the last few years. There appears to be less interannual variability in mean weights-at-age at Shetland compared to other assessment areas, which is likely due to the higher sampling levels in this area.
Exploratory analysis
Catch-at-age data by proportion (normalised by mean and standard deviation across age class)are shown in Figure 3.28 with dark bubbles illustrating above average values. There is evidence that the data track relative year class strength during the 1990s and mid-2000s. The more recent data appear noisier with no obvious signals of year class strength, though there could be stronger cohorts emerging since 2020, with more above average proportions in the younger ages.

Details of the surveys which have been carried out in the Shetland assessment area are given in Table A.34. The survey has been carried out in the first quarter of the year, with the exception of 2002 when the survey was carried out three months earlier than usual at the end of 2001. From 1998 to 2008, the survey was conducted by the RV Clupea and since then by the RV Alba na Mara. No comparative tows were conducted to compare catch rates between these two vessels and previous scallop stock assessments have suggested that despite standardisation of catch rates (to account for differences in the number of dredges worked and dredge width), survey vessel may have a significant impact on catchability. Therefore, in this assessment, the survey data are treated as two separate time series.
The number of valid survey stations varies considerably, with bad weather often disrupting the survey. Typically, the stations which are missed due to bad weather are those to the southwest of Shetland and in other exposed locations. It is not possible to determine whether lack of data from these areas has significantly biased the survey catch-at-age indices in these years. Note that the exceptionally poor weather in 2014 and 2015 meant that not even a partial survey of the area could be conducted in either of those years.
Log mean standardised survey catch rates-at-age by cohort are shown in Figure 3.29 for the two surveys separately (Clupea and Alba). The Clupea survey data show similar general trends across ages, indicating weaker cohorts in the mid-1990s followed by a period of stronger cohorts. The Alba survey is much noisier, potentially due to the generally poorer survey coverage over the last 10 years (missing surveys and lower number of stations), though possibly increasing in consistency more recently.


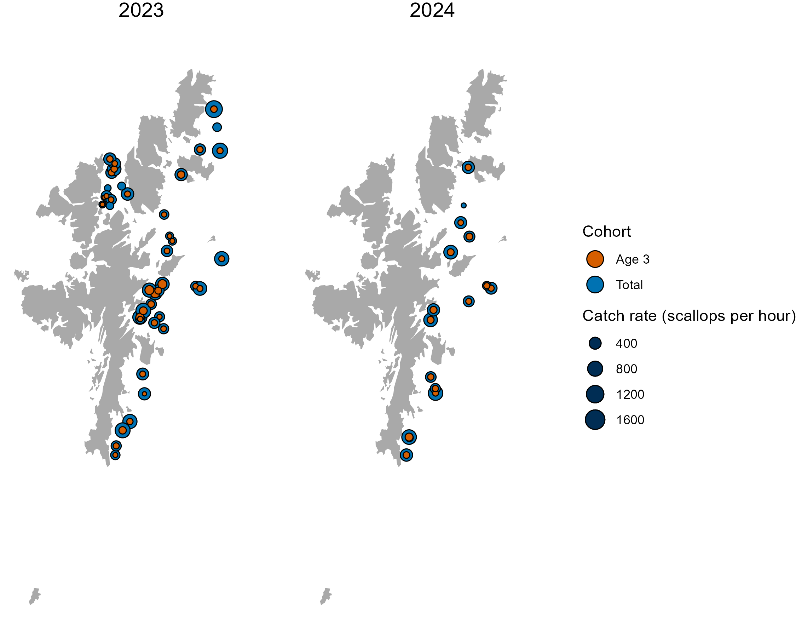
On the whole, total catch rates look fairly similar in 2023 and 2024, though it is hard to make proper comparisons between the two years given the 2024 survey was able to cover far fewer stations (Figure 3.30). Catches of age three individuals (recruitment) remained widespread and were present at almost all stations in both years.
Further plots exploring the quality and consistency of both the catch and survey data (catch curves and scatterplots) are included in the Appendix (Figures A.35 to A.38).
Final Assessment
A summary of the assessment input data is provided below:
| Data Type | Year Range | Age Range | Notes |
|---|---|---|---|
| Catch numbers-at-age | 1986 - 2024 | 3 - 10+ | - |
| Catch weights-at-age | 1986 - 2024 | 3 - 10+ | - |
| Clupea Survey numbers-at-age | 1998 - 2008 | 3 - 9 | - |
| Alba Survey numbers-at-age | 2009 – 2024 | 3 - 9 | Missing years in 2014 & 2015 due to poor weather; Missing year in 2020 due to Covid-19 pandemic |
| Stock weights-at-age | 1986 – 2024 | 3 - 10+ | Assumed equal to catch weights-at-age |
| Maturity-at-age | 1986 – 2024 | 3+ | All ages assumed mature |
| Natural mortality-at-age | 1986 – 2024 | 3+ | 0.15 all ages (based on likely longevity) |
The final model configuration from the previous Shetland scallop assessment (2023) was used to specify the model settings, as this had already been modified to improve residual patterns and fit and there was no reason to modify these settings with the inclusion of additional years’ data. The main features of the final model can be summarised as follows and are broadly similar to those for other assessment areas:
- Fishing mortalities at ages 9 and above are assumed equal (coupled).
- Survey catchabilities are coupled at ages 8 and above (Clupea survey), and ages 7 and above (Alba survey).
- Catch observation variance parameters are coupled across ages 5 to 10+ and uncoupled at other ages. To account for the variation in sampling levels over time, the number of catch samples per year is used to weight the data such that the catch data from those years with a greater number of samples is given a greater weight in the assessment.
- Survey observation error is coupled for ages 5 and above for the Clupea survey and coupled both for younger (ages 3-6) and older ages (ages 7-9) on the Alba survey. The Alba survey is allowed to have AR(1) covariance structure (rather than independent) with the age 3 to 4 correlation parameter uncoupled from other ages.
- Recruitment at age 3 is modelled as a random walk.
- Fishing mortality-at-age is modelled with AR(1) and process variance parameters are coupled across all ages, except age 3 (recruitment).
- Process variance in stock numbers-at-age were assumed coupled with the exception of age 3 (the age at recruitment). In the previous assessment, model convergence issues were encountered when estimating the process error for ages 4 and above, therefore this parameter was fixed at an arbitrary small value (-5 on log scale and small in comparison to the estimated recruitment process error).
- The final SAM configuration file is given in Table A.36.
The model predictions of catch numbers-at-age track the observations relatively well across most ages, although the model estimates substantially greater uncertainty at age 3, and also age 4 to a lesser extent (Figures A.39 and Table A.38). The model estimates appear to follow the survey numbers-at-age reasonably well at ages five and above in the Clupea survey (Figure A.40 and Table A.38). The fit to the Alba survey data appears much poorer across all ages although the general increasing trend towards the end of the time series is picked up (Figure A.41). There are no major patterns or trends in the one-step-ahead residuals or process residuals (Figures A.42 and A.43) and most errors lie within ±3 standard deviations.
The full set of input data, model configuration and assessment results can be found on the stockassessment.org website.
Retrospective analysis
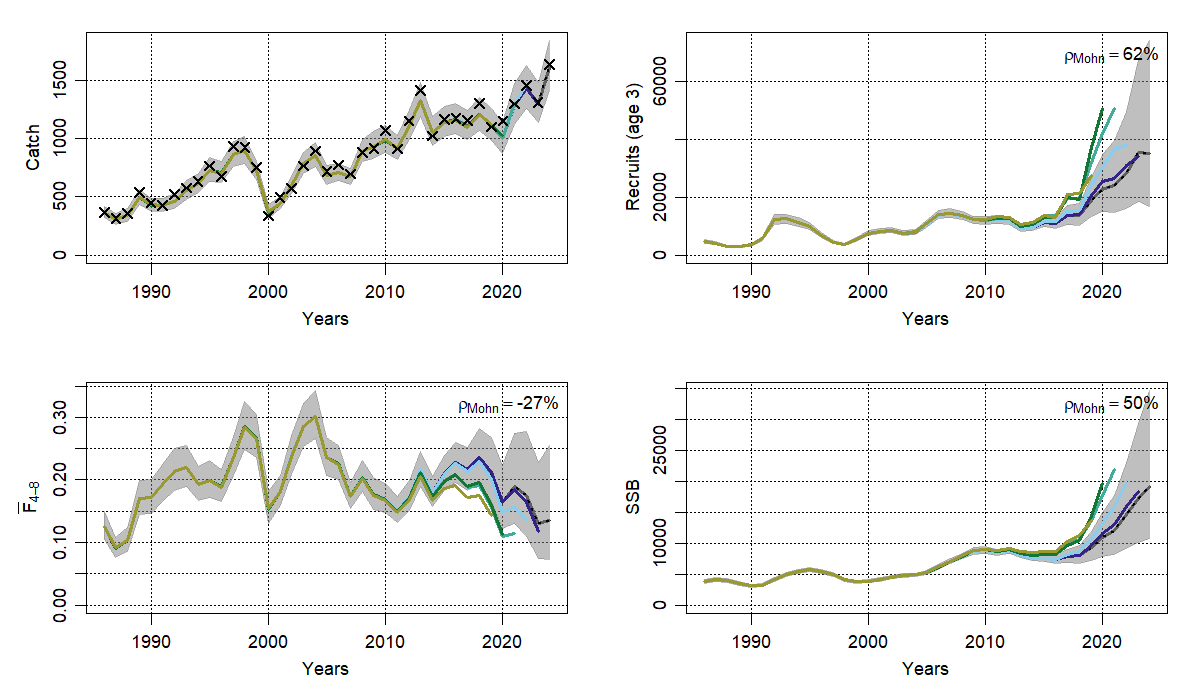
The retrospective plots shown in Figure 3.31 indicate that the assessment underestimates fishing mortality and overestimates the recruitment - and consequently the SSB - in the final year (i.e. estimates are revised downwards with each additional year’s data). Mohn’s ρ (average under-/overestimation) for SSB is calculated as 50% and for Fbar(4-8) is -27%. In these circumstances (values outwith -15% to +20%), ICES would not consider the assessment to be sufficiently robust to be used for the provision of catch advice without additional precautionary considerations or rescaling of assessment results to account for the retrospective revisions.
Stock summary
The stock summary from the SAM assessment is shown in Figure 3.32 and Table A.37 and again indicates substantial uncertainty in estimates of the latest stock size and fishing mortality. More detailed outputs, including estimates of model parameters, stock numbers-at-age and fishing mortality-at-age can be found in Tables A.38-A.40.
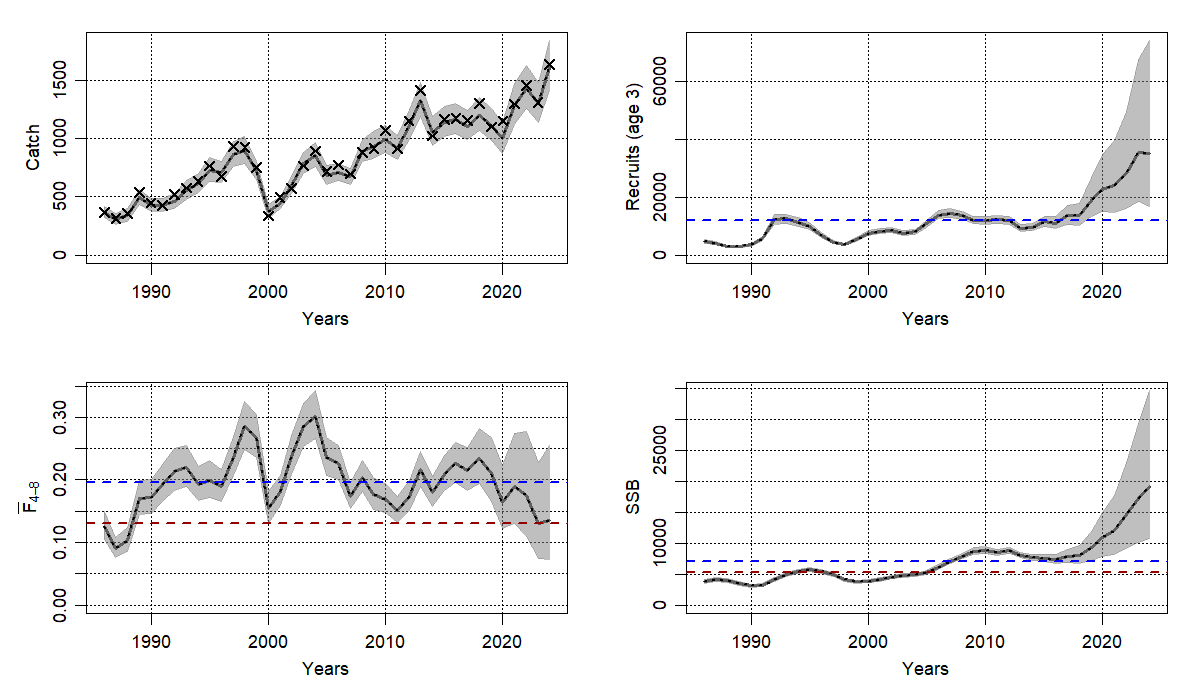
Substantially increasing recruitment has resulted in increases in SSB (highest of the time series), though recruitment is estimated to have plateaued from 2023 to 2024. Both recruitment and SSB are estimated with very wide confidence intervals and a substantial retrospective pattern. Although landings have remained high (2024 landings are the highest in the time series), the scale of the increase in SSB results in a decline in F in recent years to well below the long-term average and the lowest since pre-1990.
There appears to be no clear relationship between stock size (SSB) and recruitment to the fishery at age three although the recent very high recruitments have all occurred at high SSB (Figure A.44).
Provisional reference points have been estimated for this stock and are noted below.
| Reference point | Value | Notes |
|---|---|---|
| F0.1 | 0.13 | Derived from 2023 assessment results (Figure A.45). Used as a conservative proxy for FMSY |
| Bpa | 5 197 tonnes | Bloss × exp(1.645 × σ); Bloss = 3 116 tonnes (lowest SSB (1990) from 2023 assessment), σ = 0.311 (max(0.2, CV on estimate of SSB 2022)). |
The final estimates of current Fbar(4-8) and SSB for 2024 are 0.136 and 19,244 t. Comparing these values to the provisional reference points indicates that the stock is being fished just above the FMSY proxy and the SSB is well above the precautionary biomass reference point. There is substantial retrospective bias associated with this stock assessment indicating that SSB is overestimated and F underestimated. Current SSB is therefore likely to be much closer to the reference point and F is likely to be fished above the FMSY proxy to a greater extent than estimated by the assessment.
Comparison with previous assessment
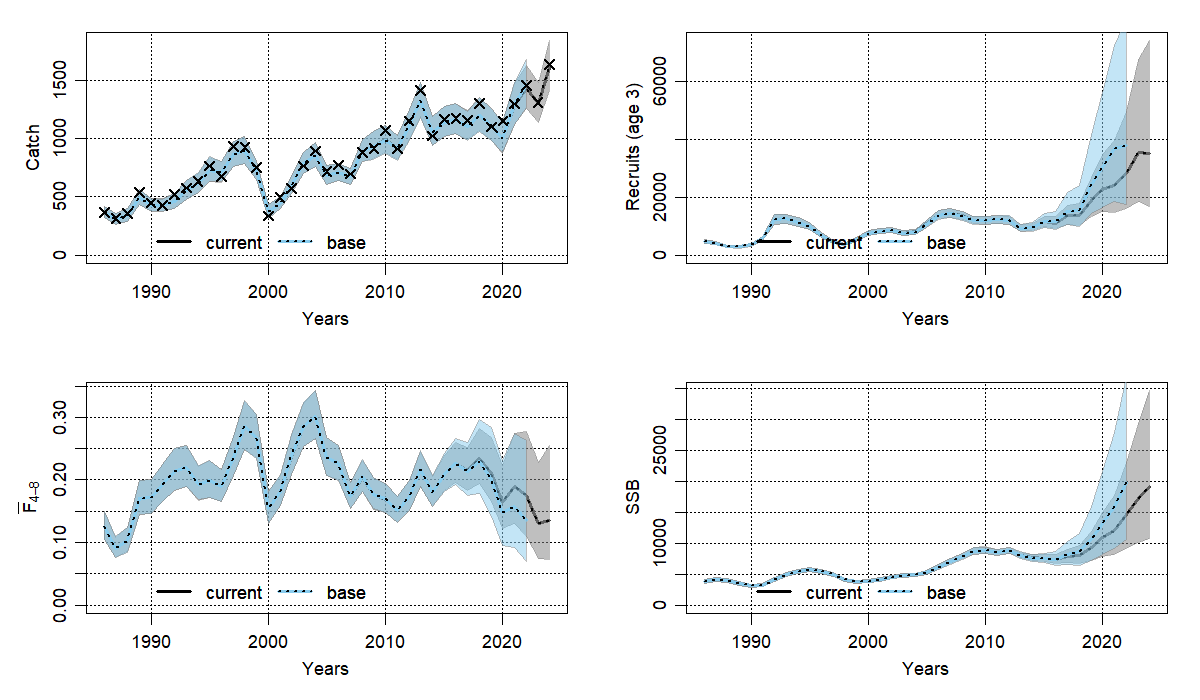
A comparison between the latest assessment and that presented in the 2023 report (Dobby et al., 2023) is shown in Figure 3.33. The two assessments show good consistency in estimates until the mid to late 2010s, after which the estimated trends are similar, but recruitment and SSB estimates are lower in the latest assessment compared with previous assessment, and fishing mortality estimates are higher.
UHI-Shetland also conduct stock assessments of the scallops around Shetland and provide advice to the SSMO. Their advice on stock status is based on a landings per unit effort (LPUE) series which shows a general upward trend between 2000 and 2024 (Harlow, 2025). The Marine Directorate and UHI-Shetland have also been working collaboratively to produce an assessment (utilising SAM) which combines the data used in the assessment presented here with the Shetland LPUE data and UHI-Shetland survey data. Preliminary results of this combined assessment also show an increasing trend in recruitment and SSB, although to less of a degree than in the assessment using MD data alone while fishing mortality is estimated to be oscillating with no trend (unlike the downward trend estimated in the MD assessment). Estimates show tighter confidence intervals compared to assessments using UHI or MD data alone, and retrospective patterns are within acceptable limits.
3.8. West of Kintyre
Description of the fishery
The West of Kintyre assessment area has a long history of exploitation with periods of high and low landings (Figure 3.1). A substantial reduction in landings has occurred over the last 10 years with total landings in 2024 of 736 t, down from almost 3,000 t in 2014 (Table A.4). Around 16% of total landings come from the dive fishery. The majority of landings are taken by a fleet of nearly 40 vessels, some of which are local and some from further afield, including all four nations of the UK. The main fishing grounds are around the islands of Islay and Jura, and the southern end of the Kintyre peninsula, and the majority of landings (> 80%) go into Oban, Port Ellen, Campbelltown, Stranraer, Portrush (Northern Ireland), and West Loch Tarbert.
Note that the partitioning of landings from statistical rectangle 40E4 into east (Clyde) and west (West of Kintyre) components relies on an estimation procedure (see Section 3.2). Therefore, uncertainty associated with the total landings (and subsequently the catch-at-age data) is likely to be greater for the West of Kintyre than for the other main scallop areas.
Catch-at-age data
The West of Kintyre area has generally been well sampled since the mid-1980s, though levels have been lower in recent years (Table A.5). Raised catch-at-age data are available from 1982 onwards (Figure 3.34 and Table A.41). In the early part of the time series, scallops of age eight years and older, and particularly 10+, were well represented in the catches, but have been less evident since the 1990s. In contrast, the proportion of scallops at ages four to six in the catch has increased considerably since this time. There also appears to be a decline in the contribution of age three individuals to the total catch, particularly since around 2010, which could be indicative of weaker recruitment.
Biological data
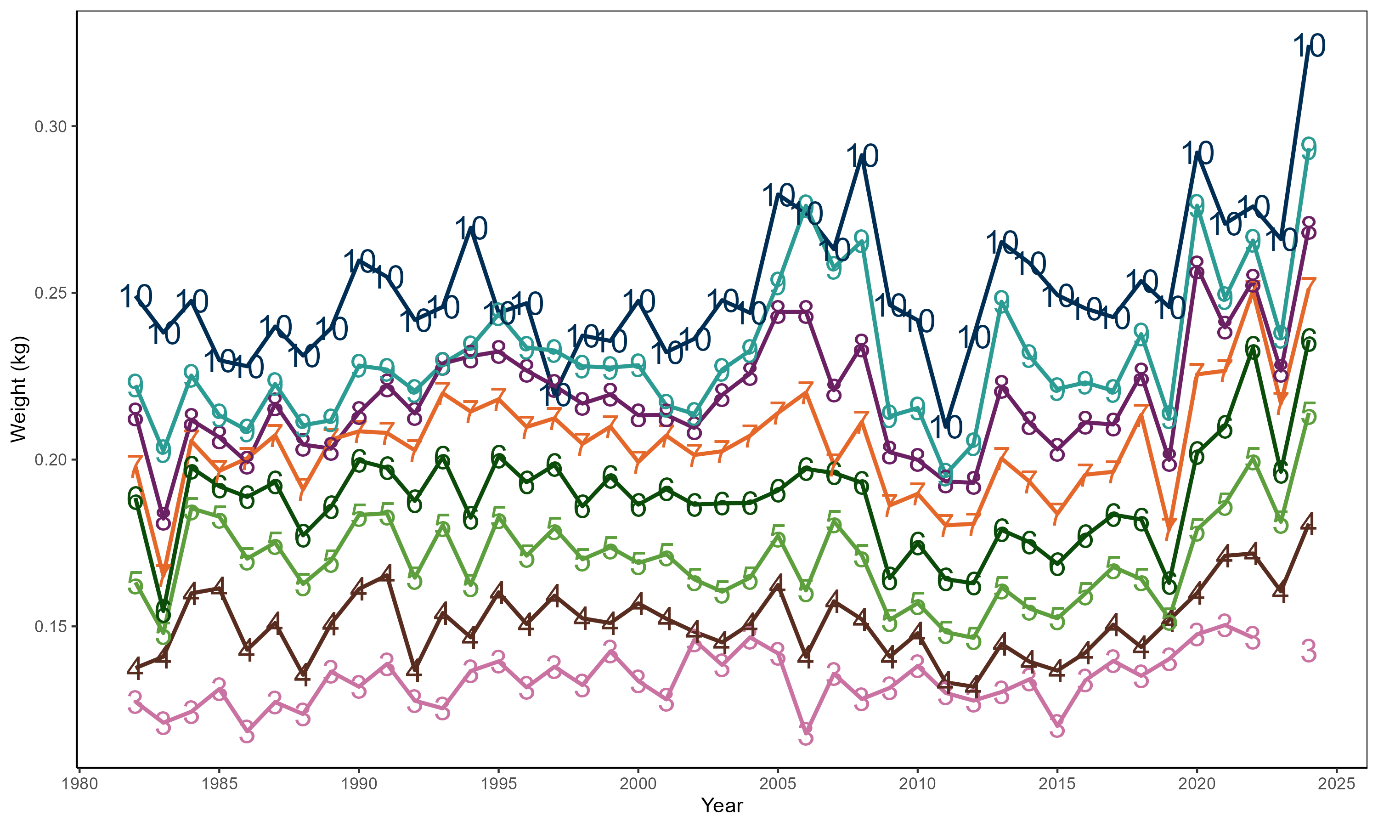
The historical mean weights-at-age show some variability, but no major trends until the mid-2000s when mean weights declined and subsequently gradually increased to above average values across all ages, with a sharp increase in the last year of the time series (Figure 3.35 and Table A.42). This could be related to an increased proportion of dive caught scallops, which tend to be bigger.
Exploratory analysis
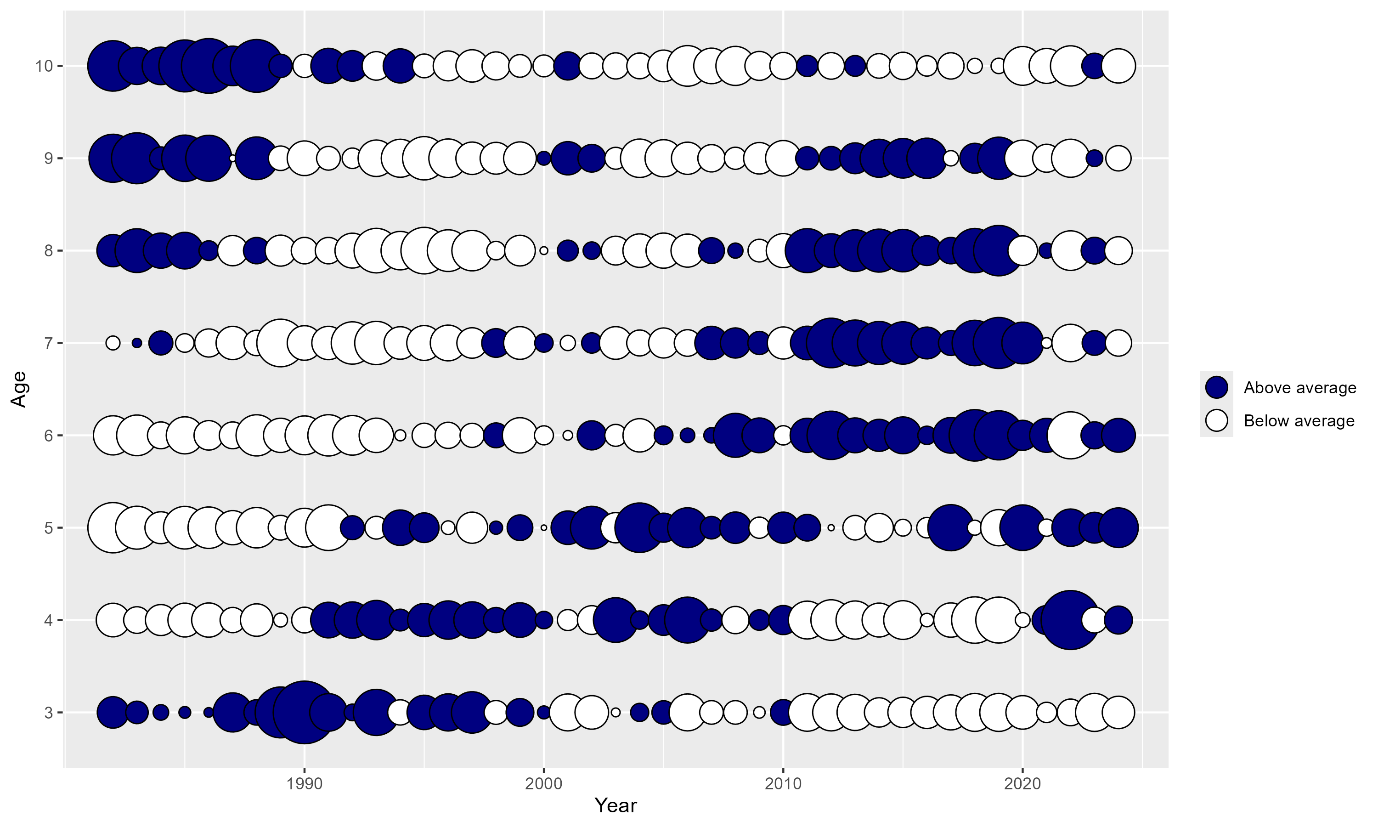
Catch-at-age data by proportion (normalised by mean and standard deviation across age class) are shown in Figure 3.36 with dark bubbles illustrating above average values. Despite generally good sampling levels for most of the time series, the commercial catch-at-age data appear very noisy for the West of Kintyre. The data identifies a period of weak year classes during the late 1980s which are picked up in the data as below average catches at older ages in the early 1990s. Following that there is some evidence of stronger recruitment in the early 1990s and again in the late 2000s. However, relative year class strength is generally not consistently tracked through cohorts in these data.
Details of west coast scallop surveys which cover the West of Kintyre assessment area are given in Table A.25 and discussed in Section 3.5. No comparative tows have been conducted to compare catch rates between vessels, and previous scallop stock assessments have suggested that despite standardisation of catch rates (to account for differences in the number of dredges worked by each vessel), survey vessel may have a significant impact on catchability. Therefore, in this assessment, the survey data are treated as three separate indices. The Aora I dredge survey ran from 1993 to 2002, the Aora II survey from 2003 to 2007 and the Alba survey from 2008 onwards, but with both 2020 and 2021 missing due to disruption associated with the Covid-19 pandemic (Tables A.25 and A.43). Within each of the three survey indices the seasonal timing of the survey has been relatively consistent over time.
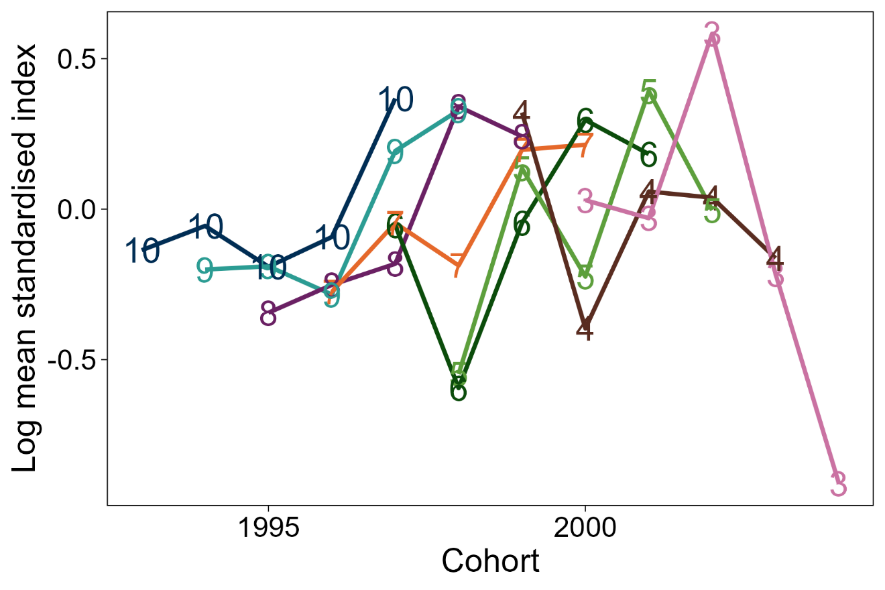
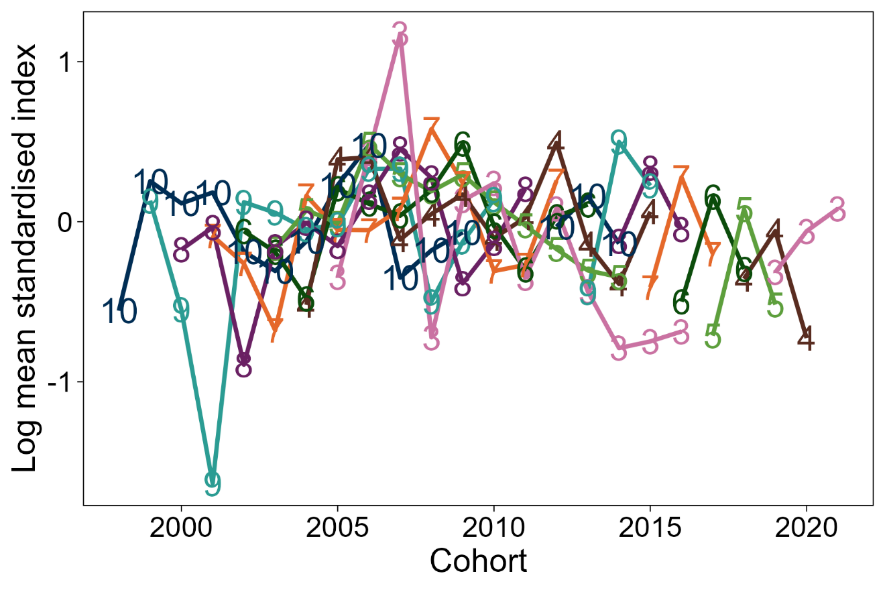
Log mean standardised survey catch rates-at-age by cohort are shown in Figure 3.37 for the three surveys separately (Aora I, Aora II and Alba). On the whole, the survey data appear quite noisy. The Aora I survey identifies several year classes recruiting in the mid-1990s as above average, with the pre-1990 cohorts mostly below average. The weak 1998 year class (recruitment at age three in 2001) is consistently estimated below average across the Aora and Aora II survey series up to age seven. The Aora I and II surveys suggest good recruitment in 2002 and track this 1999 cohort with above average catch rates across a range of age classes.
The Alba survey data provide some evidence of strong recruitment in the late 2000s, but relative year class strength is not estimated consistently at older ages. Thereafter there appear to be some periodic fluctuations in year class strength although the index at age 3 fluctuates and does not appear to be a good indicator of abundance at older ages. Overall, correlations between ages appear to be low (Figure A.49). As in the North West, which is sampled in the same survey as West of Kintyre, we see a peak across cohorts in 2023 (Figure 3.37 and Figure A.47).
Further plots exploring the quality and consistency of both the catch and survey data (catch curves and scatterplots) are included in the Appendix (Figures A.46 to A.49).

Final Assessment
A summary of the assessment input data is provided below:
| Data Type | Year Range | Age Range | Notes |
|---|---|---|---|
| Catch numbers-at-age | 1982 - 2022 | 3 – 10+ | - |
| Catch weights-at-age | 1982 - 2022 | 3 - 10+ | - |
| Aora I survey numbers-at-age | 1993 - 2002 | 3 - 9 | - |
| Aora II survey numbers-at-age | 2003 - 2007 | 3 - 9 | - |
| Alba survey numbers-at-age | 2008 - 2022 | 3 - 9 | No survey data for 2020 & 2021 due to disruption associated with Covid-19 |
| Stock weights-at-age | 1982 - 2022 | 3 - 10+ | Assumed equal to catch weights-at-age |
| Maturity-at-age | 1982 - 2022 | 3+ | All ages assumed mature |
| Natural mortality-at-age | 1982 - 2022 | 3+ | 0.15 all ages (based on likely longevity) |
The final model configuration from the previous West of Kintyre scallop assessment (2023) was used to specify the model settings, as this had already been modified to improve residual patterns and fit and there was no reason to modify these settings with the inclusion of additional years’ data. The main features of the final model can be summarised as follows and are broadly similar to those for other assessment areas:
- Fishing mortalities at ages 9 and above are assumed equal (coupled).
- Survey catchabilities are coupled at ages 8 and 9 for all surveys.
- Catch observation variance parameters are coupled across ages 4 to 9 and uncoupled for other ages. To account for the variation in sampling levels over time, the number of catch samples per year is used to weight the data such that the catch data from those years with a greater number of samples is given a greater weight in the assessment.
- Survey observation error is coupled for ages 4 to 8 and uncoupled at other ages (all surveys).
- Recruitment at age 3 is modelled as a random walk.
- Fishing mortality-at-age is modelled with AR(1) and process variance parameters are coupled across all ages.
- Process variance in stock numbers-at-age were assumed coupled with the exception of age 3 (the age at recruitment). In the previous assessment, model convergence issues were encountered when estimating the process error for ages 4 and above, therefore this parameter was fixed at an arbitrary small value. (-5 on log scale and small in comparison to the estimated recruitment process error).
The final SAM configuration file is given in Table A.44.
The model predictions of catch numbers-at-age track the observations relatively well with the exception of ages three and 10+ where the model estimates greater uncertainty in the data (Figure A.50 and Table A.46). The picture is similar for the fit to the survey data; for the Aora I and Aora II surveys age three indices are most uncertain, and for the Alba survey it is the age 9 indices. Most one-step ahead and process errors lie within ±3 standard deviations, though there is one outlier of approximately -4 in the process residuals. (Figures A.54 and A.55).
The full set of input data, model configuration and assessment results can be found on the stockassessment.org website.
Retrospective analysis
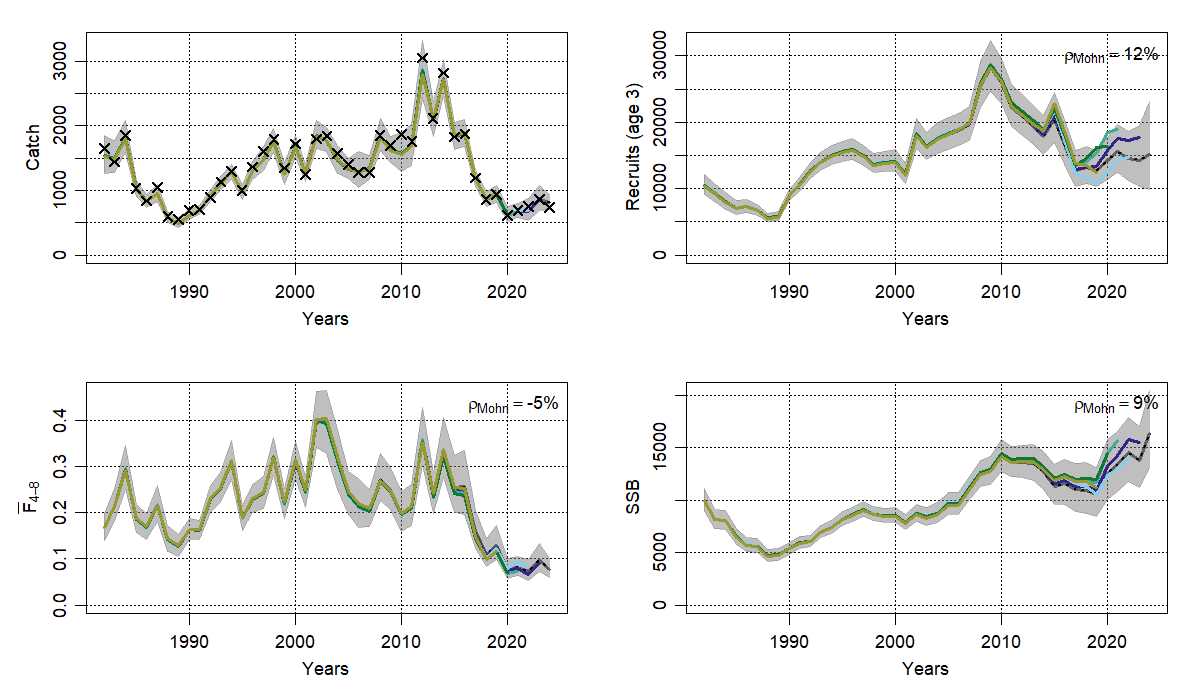
The retrospective plots are shown in Figure 3.38. There is some tendency to overestimate recruitment in the final year, and therefore SSB slightly as well, as estimates are revised downwards with each additional year’s data. Mohn’s ρ (average under-/over-estimation) for SSB is calculated as 12 % and -5 % for Fbar(4-8). All peels fall within the confidence intervals of the full time-series assessment. Typically, assessments with Mohn’s ρ for SSB estimated within -15% and 20% are considered sufficiently robust for the provision of catch advice by ICES (ICES, 2020).
Stock summary
The stock summary from the SAM assessment is shown in Figure 3.39 and Table A.45. More detailed outputs, including estimates of model parameters, stock numbers-at-age and fishing mortality-at-age can be found in Tables A.46 to A.48.
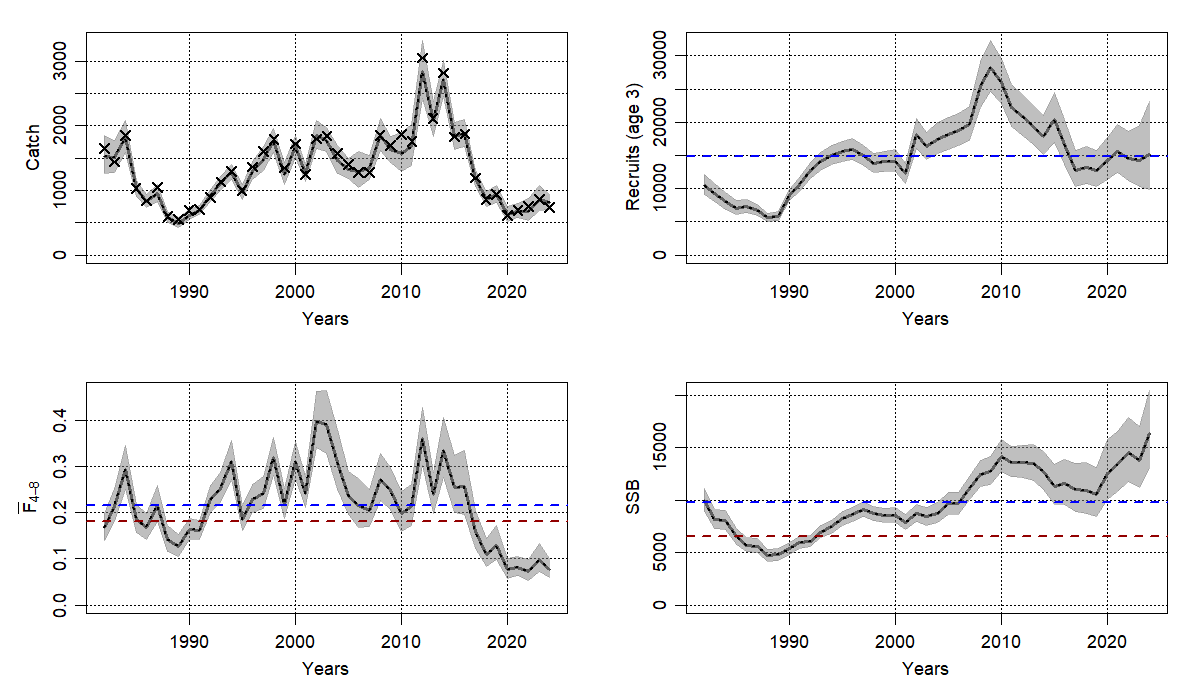
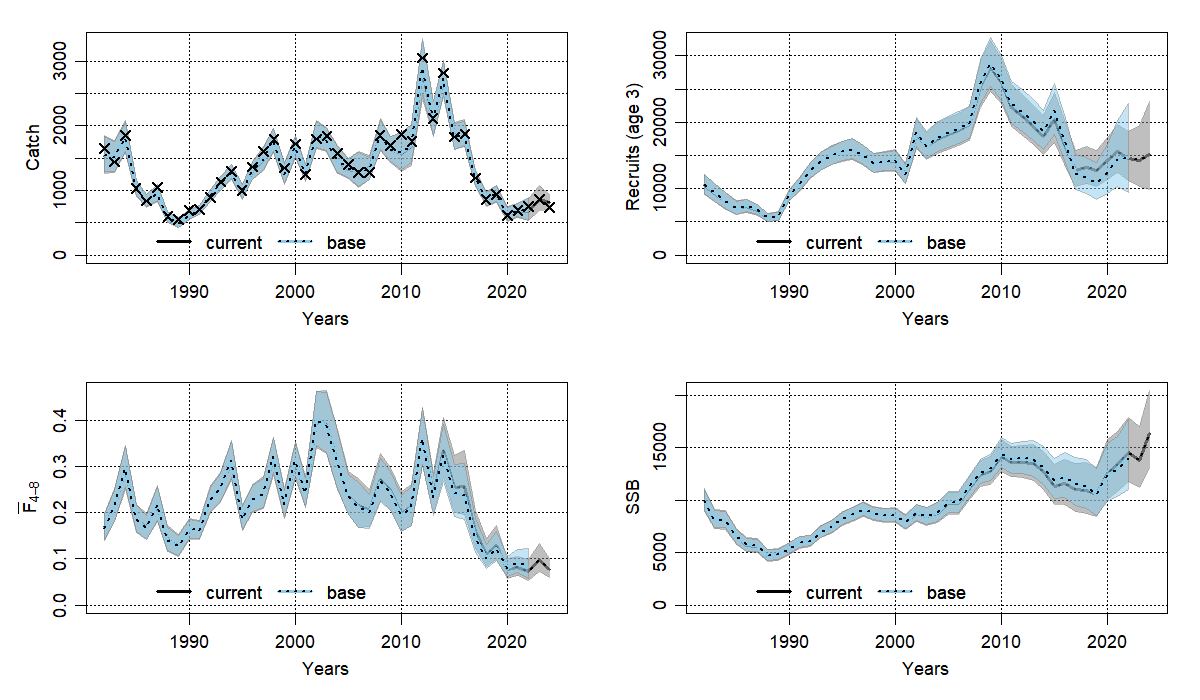
A period of increasing recruitment during the 1990s and 2000s resulted in an increase in stock size and catches. Recruitment has declined substantially since 2009 and is estimated to be stable over the past few years - around the long term average in 2024 – but the estimated SSB continues to increase with the highest value of the times series in 2024. This is due to the low levels of catch and resulting estimates of F which remain around the lowest levels since the beginning of the time series and well below the long term average. There appears to be no clear relationship between stock size (SSB) and recruitment although on average, recruitment appears to be higher at high SSB (Figure A.56).
Provisional reference points have been estimated for this stock and are noted below:
| Reference point | Value | Notes |
|---|---|---|
| F0.1 | 0.18 | Derived from 2023 assessment results (Figure A.57). Used as a conservative proxy for FMSY |
| Bpa | 6,559 tonnes | Bloss × exp(1.645 × σ); Bloss = 4,720 tonnes (lowest SSB (1988) from 2023 assessment), σ = 0.2 (max(0.2, CV on estimate of SSB 2022)). |
The final estimates of current Fbar(4-8) and SSB for 2024 are 0.078 and 16,302 t. Comparing these values to the provisional reference points indicates that the stock is being fished below the FMSY proxy and the SSB is well above the precautionary biomass reference point.
Comparison with previous assessment
A comparison between the latest assessment and that given in the 2023 report (Dobby et al., 2023) is presented in Figure 3.40. The estimates are generally very similar, though between 2009 and 2017 recruitment and SSB are estimated to be very slightly lower and Fbar(4-8) very slightly higher in the more recent assessment, and then since 2017 recruitment has diverged and is estimated to be higher in the more recent assessment.