
Scottish Scallop Stocks: Results of 2025 Stock Assessments
This report presents the results of Scottish regional king scallop stock assessments carried out by the Marine Directorate including data up to 2024. It also provides background information on Scottish fisheries for scallops, and the current management and regulatory framework.
2. Data collection and methods
2.1. Assessment areas
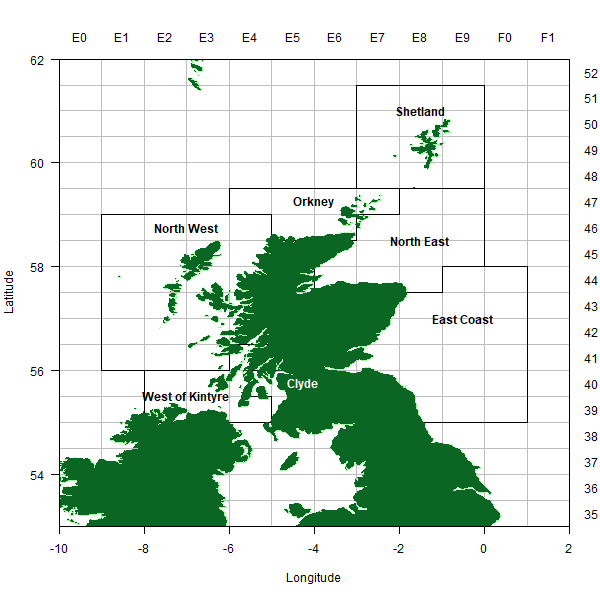
For the purpose of these stock assessments, the scallop grounds around Scotland are divided into assessment areas (historically known as ‘management areas’) which are defined on the basis of ICES statistical rectangles (Figure 2.1 and Table A. 1). As in previous assessments, rectangle 40E4 is divided into two data components, one on the east side of the Mull of Kintyre and one on the west side. This allows for a clearer distinction between the West of Kintyre and Clyde scallop stocks. In previous assessment reports, data were also presented for an Irish Sea assessment area. However, given the international nature of the fishery in this area, the ICES Scallop Assessment Working Group (WGScallop: ICES, 2023a) is now considered to be best placed to collate data and develop stock assessments for this area.
2.2. Fishery data
The stock assessments use various fishery and survey data which are described below.
Landings data
The assessments make use of official landings data for both dredge and dive caught scallops. Scottish landings data (landings by UK vessels into Scotland plus Scottish vessels’ landings abroad) are collated by Scotland’s Marine Directorate (MD) from sales notes, EU logbooks and FISH1 forms, and stored in the UK IFISH database. Landings from other UK nations have also been obtained from the IFISH database, while non-UK landings from the assessment areas considered in this report were provided by the ICES Scallop Assessment Working Group (Scallop). The latter represent an extremely small proportion of the total landings. Landings are recorded and made available at the level of ICES statistical rectangle, and these are then aggregated according to assessment area for use in the stock assessments (Tables A.2-A.3).
As in the previous assessment, the landing port recorded in the IFISH database has been used to allocate trip level landings from 40E4 to west (West of Kintyre) and east (Clyde) components, as opposed to the ‘zone variable’ used in earlier assessments.
Catch-at-age data
Scallop landings are sampled by MD staff as part of a market sampling programme[1]. Sampling began in the early 1970s; however, it is only since 1982 that sufficient samples have been available to construct reliable catch-at-age data.
Most scallops in Scotland are sold privately, rather than by auction, and are sampled at the processing factories. For each trip sampled, one bag of scallops is selected at random, and the lengths of all scallops are recorded to the 0.5 cm below. A sub-sample of the scallops are aged (using the rings on their shells) with individuals age 10 and above recorded in a ‘10+’ age category. Processors handle both dive and dredge caught scallops, although dive caught samples are often obtained directly by MD staff from the dive vessel at the time of landing.
On a quarterly basis, sampled numbers-at-age data for dredge and dive caught scallops are raised to total dredge and dive landings, respectively. These data are summed across quarters and fishing method to provide annual Scottish landings-at-age data. These data are then raised to total annual landings (all nations) to provide input for the stock assessment (Tables A.4-A.5). Raising factors for the sampled data are determined using a length-total weight relationship with parameters fixed across stocks and quarters (see Section 2.3). Discard mortality is assumed negligible, and landings-at-age are used as catch-at-age in the stock assessments.
The catch-at-age data for 2014 and 2015 were reprocessed ahead of the 2023 assessments to account for updates to both landings and sampling data since the last assessments were conducted. In addition, the data for the West of Kintyre and Clyde were reprocessed for 2002 onwards to account for the updated estimates of total landings for these two areas.
2.3. Biological data
A length-total weight relationship (where weight is the combined shell, gonad and muscle weight) is used to calculate mean weights-at-age in the sampled landings data which are then used to raise sampled data to total landings. The parameters of the total annual length-weight relationship (Weight (g) = a x Lengthb), with Length given in millimetres, are fixed across stocks and over time as follows:
a: 0.001142
b: 2.513
Source: Cook et al. (1990)
The catch mean weight-at-age estimates are used in the stock assessments to convert the outputs (which are in terms of numbers) into total weights. Missing weights-at-age (for example due to unsampled age classes in particular years) were filled in using either an average of the weight-at-age in adjacent years or with the value from the previous year.
It is not possible to estimate natural mortality directly, but in common with other fish and shellfish species of similar longevity (up to 20 years), it is assumed to be 0.15 yr-1 for all ages and stocks (Cook et al., 1990).
Scallops typically first spawn in the autumn of their second year and 100% maturity is therefore assumed for age two onwards for all stocks.
2.4. Research vessel surveys
Dredge surveys of the major scallop grounds around Scotland have been carried out by MD (and its predecessors) since the mid-1990s (partial surveys of the west coast began in the late 1980s). There are four surveys a year which, collectively, cover the grounds of the west of Scotland, the North Sea (Scottish coast), Shetland and the Clyde. The surveys have fixed stations. The station locations were determined with reference to sediment type, using British Geological Survey charts to locate sediments suitable for scallops, and knowledge of the scallop fishing grounds contributed by skippers fishing at the time when the surveys first took place. The gear setup consists of one array of standard commercial spring-loaded Newhaven type dredges (2.5’ wide, 9 tooth bar, with 80 mm internal diameter belly rings, Type A), and another array of smaller configuration sampling dredges with 11 teeth and smaller diameter belly rings, similar to commercial gear for queen scallops Aequipecten opercularis (2.5’ wide, 11 tooth bar, with 60 mm internal diameter belly rings, Type B).
At each station the dredges are towed at a speed of about 2.5 knots for approximately 30 minutes and all scallops caught are aged and measured (length to the 0.5 cm below). Over the years, different survey dredge widths have been used. Catch rates are, therefore, standardised for both fishing time and dredge width and are presented as numbers caught per hour per metre dredge width (N hr-1 m-1). Indices for each assessment area are calculated by aggregating total catch-at-age numbers from both dredge types over all hauls and dividing by total duration (and dredge width).
2.5. Assessment
Analytic stock assessments were conducted using SAM, a state-space stock assessment model (Nielsen and Berg, 2014; Berg and Nielsen, 2016) that is similar to the previously used Time Series Analysis (TSA; Fryer, 2002). The state of the stock in a particular year is described by a vector of stock numbers-at-age and fishing mortality-at-age (the ‘state vector’). The ‘state equations’ define how this vector changes over time; i.e. how the numbers-at-age in a particular year relate to the numbers-at-age and fishing mortality-at-age in the previous year. This vector is related to the data or observations (catch-at-age data and survey data) through ‘observation equations’. The main features of SAM are that it:
- allows for both process errors (i.e. variability in the state equations) and observation errors (i.e. noise in the measurements of catch numbers-at-age and survey data);
- provides precision estimates of estimated parameters (numbers-at-age and fishing mortality-at-age);
- has the ability to deal with the omission of catch or survey data if data are of poor quality or missing;
- has substantial flexibility in terms of model configuration and input data; and
- allows for the inclusion of a stock-recruitment relationship.
Parameter estimation in SAM is carried out using maximum likelihood implemented in Template Model Builder (TMB; Kristensen et al., 2016), an R package that enables fast optimisation for problems which include random effects and many parameters. In addition to being much faster than TSA, SAM has the further advantage of being a widely used stock assessment method with an online platform on which assessments can be run and made publicly available. The model can also be run in R using the stockassessment package.
Unless otherwise specified, model configurations for each stock were kept the same as in the previous assessment.
2.6. Stock status
The derivation of Maximum Sustainable Yield (MSY) reference points typically requires an evaluation of stock and recruitment data and fitting a stock-recruitment relationship which often proves to be difficult. Provisional precautionary reference points were derived in the 2023 assessment (Dobby et al., 2025), based on the following:
- F0.1, defined as the fishing mortality (F) on a yield-per-recruit curve where the slope of the curve is 10% of that at the origin, is used as the reference point for F. This value is often considered to be a conservative or precautionary estimate for FMSY and is an automatic output from the SAM assessment. (ICES, 2007; ICES, 2010).
- A precautionary biomass reference point (Bpa) is derived from the lowest estimated biomass for that stock and the application of a multiplier to account for the uncertainty in the estimates of biomass from the stock assessment. This follows an approach often used by ICES for the derivation of biomass reference points (ICES, 1998; Silvar-Viladomiu et al., 2022).
No updates have been made to the reference points in this year’s assessments.