Scottish National Standardised Assessments: national report
Summary of outcomes at a national level on the Scottish National Standardised Assessments (SNSA) in the 2018 to 2019 academic year.
3. Reading/Literacy
3.1 The scope of the reading/literacy assessment
3.1.1 Reading and literacy for P1, P4, P7 and S3
For P4, P7 and S3, the assessments of reading and writing were delivered separately. For P1, children were presented with a single assessment combining elements of reading and writing – this is referred to as the P1 literacy assessment. There were two reasons for combining reading and writing at P1. First, literacy skills tend to be quite integrated at this early stage of development (and may be referred to as 'precursor' or 'component' literacy skills). Secondly, a combined literacy assessment reduced the burden of the assessment, which was an important consideration for the very young children in this stage. The P1 literacy assessment was scaled with the reading assessments for higher stages, using the same set of curriculum organisers, and is therefore discussed in this section in conjunction with the outcomes of the P4, P7 and S3 reading assessments.
The P1 literacy assessment comprised both stand-alone questions and 'units', which are groups of questions focusing on a single stimulus text. At P4, P7 and S3, all the reading questions were grouped into units of four or five questions, to economise on the reading load. Using this unit structure, questions of differing difficulty and covering different organisers could be asked with reference to the same text.
3.1.2 Alignment with Curriculum for Excellence
In the SNSA academic year 2018 to 2019, the assessments of reading and P1 literacy were based on elements of Curriculum for Excellence (CfE), as articulated in the literacy elements of the Benchmarks: Literacy and English, published in June 2017.
3.1.3 A note on texts used in SNSA reading assessments
For SNSA reading, a broad definition of texts was used, in line with the statement in Benchmarks: Literacy and English (June 2017): 'Challenge in literacy … involves engaging with a wide range of increasingly complex texts which are suitable to the reading age of each learner.' In SNSA, this range includes narrative fiction and non-fiction, description, explanation, argument and instructions. A further dimension to the definition of texts in SNSA reading relates to format, as described in Curriculum for Excellence: Literacy and English, Principles and Practice: 'Texts can be in continuous form, including traditional formal prose, or non-continuous, for example charts and graphs.'
3.2 Coverage of the Curriculum for Excellence: Benchmarks and organisers
SNSA are just one part of the range of assessments that teachers use in making their evaluations of children's and young people's learning. As a standardised assessment with a defined number of questions and using questions capable of being scored automatically, only some parts of the specified reading Benchmarks could be addressed. In consultation with Scottish literacy experts, it was agreed that the reading and P1 literacy assessments should be based on the organisers Tools for reading (TFR), Finding and using information (FUI), and Understanding, analysing and evaluating (UAE). Each of the questions selected for inclusion in SNSA reading and literacy assessments for the academic year 2018 to 2019 was aligned with a Benchmark statement from one of these organisers.
Although all three organisers are represented in the P1, P4, P7 and S3 reading assessments, there were different proportions across the stages. In the reports provided to schools, teachers received information about organiser-level outcomes if the learner was presented with at least five questions from the organiser. Similarly, in this report, outcomes for organisers that were addressed by at least five questions in each learner's assessment are analysed. The organisers included in the reports are shown by stage, in Table 1.
Table 1: Reporting organisers for reading by stage, academic year 2018 to 2019
| Stage | Organisers |
|---|---|
| Primary 1 | Tools for reading Understanding, analysing and evaluating |
| Primary 4 | Finding and using information Understanding, analysing and evaluating |
| Primary 7 | Finding and using information Understanding, analysing and evaluating |
| Secondary 3 | Finding and using information Understanding, analysing and evaluating |
The following sections provide more information on each of the reading organisers in SNSA 2018 to 2019, along with some example items. These items are not used in SNSA 2019 to 2020, and they will not be used in future Scottish National Standardised Assessments.
3.2.1 Tools for reading
In the P1 assessment, this organiser comprised questions related to phonological awareness, word decoding and word recognition; in the assessments for the higher stages, assessment content mainly referred to learners' use of strategies to work out the meaning of words. The P4, P7 and S3 assessments contained relatively small numbers of questions from this organiser in the academic year 2018 to 2019.
Figure shows a typical question from the P1 literacy assessment, which reflects the organiser Tools for reading. It is designed to assess children's knowledge of sounds (phonological awareness). Note that the 'mouth' icon indicates to the learner that there is a voiced component to the question, enabling the child to listen to the instruction and response options.[4] In this case, clicking on the icon prompts a reading of the question text to the child, including the answer options.
Figure 10: Example of a P1 Tools for reading question, 'Rhyming word – feather'

This question asks the child to identify aurally presented rhyming words, a skill which, in English, is a key precursor to mastery of reading. While children might have used decoding skills to read the words 'weather', 'fairy' and 'baker', they are not expected to do so; this is a question designed to assess whether children can hear and recognise rhyming sounds. Hence, the word 'feather' is only presented aurally, with pictorial support. This means that the focus of the question is unambiguously on phonological awareness rather than decoding. This question was classified as being in the middle of the P1 literacy question difficulty range. It was presented to children who were progressing relatively successfully through the assessment, and of these learners, the majority was able to answer it correctly.
Figure shows another example of a P1 Tools for reading question.
Figure 11: Example of a P1 Tools for reading question, 'Select the word'

This question draws on a child's word recognition skills, which is part of very early literacy development. It required learners to identify a word from a set of options including numbers and symbols. An audio prompt provided support to the onscreen instruction. In this case, learners were not required to decode the word, or demonstrate understanding of its meaning. This question was answered correctly by almost all the learners presented with it in the assessment.
3.2.2 Finding and using information
This organiser focuses on the critical literacy skills of locating information in a text and employing the information to meet a purpose. These skills are often applied in the context of non-fiction texts but can also be applied to fiction. In SNSA, questions for P1 and P4 learners that corresponded to this organiser generally focused on finding information that was literally stated, or required a low level of inference (for example, recognising synonyms linking the question with the text). More advanced questions addressing similar skills – for P7 and S3 – were likely to be applied to longer and more complex texts. At P7, the organiser Finding and using information also included questions requiring learners to sort information in a text into relevant categories. The S3 reading assessment presented Finding and using information questions that asked young people to find key information in one or more texts, or to make connections between the information they located, sometimes across more than one text.
Figure shows a typical question from the P4 reading assessment, from the organiser Finding and using information. The stimulus for this question is a narrative fiction text of typical length within the context of the P4 reading assessment, and mainly uses relatively simple vocabulary and language structures. The question presented here required children to find information in the fiction text.
Figure 12: Example of a P4 reading text with a Finding and using information question, 'Cawky Question 1'

This question asks the child to locate a paraphrased detail in the text. The information is located near the beginning of the text, and uses familiar synonymous language as support to help the child link the information in the text to the correct answer. The word 'screeching' relates to the answer option 'sound'. The onomatopoeic word 'Caw' is shown to be a sound both through the introductory 'screeching' and the use of quotation marks. Finally, 'Caw' has a clear link to the name Cawky in the question stem. This question was classified as being at the low end of the difficulty range for P4 learners and was answered correctly by most learners who were presented with it.
A more difficult question from the Cawky unit is presented below, in the section on Understanding, analysing and evaluating.
Figure shows a Finding and using information question from a P7 reading assessment. The stimulus for this question is a descriptive, non-fiction text. While the text is still relatively short, in comparison with the P4 example text in Figure , it uses more complex vocabulary, including some technical terminology, and the sentences are longer and use more complex structures, providing children in P7 with greater challenge.
Figure 13: Example of a P7 reading stimulus text with a Finding and using information question, 'Aphids Question 4'

The question presented here required children to select relevant information from a non-fiction text. Despite the very clear link between the key term 'migration' in the question prompt and 'migrate' in the text, which draws the learner to the location of the relevant information, in other ways this question is considerably more difficult than the P4 example provided in Figure 12. It is not only the text that is more complex, but the question itself, which relies on more sophisticated skills and understanding than the simple matching of related words in 'Cawky Question 1'. Although this text quite clearly states that aphids only migrate if they find themselves in unfavourable conditions, learners must infer from this that they otherwise stay where they are. Alongside the need to interpret, a second challenge in this item comes from the need to negotiate strongly competing details both within the same sentence and later in the text. The fourth option in particular proved a strong distractor for learners, possibly because the information about enemy attacks was very close to the correct answer in the text, and because of the repeated reference to 'enemies' at the end of the text.
This unit was only seen by children if they did relatively well in the first phase of the assessment and the question was classified as being at the high end of the P7 question difficulty range. Of the learners presented with this question, a large minority answered it correctly.
A less difficult question from this unit is presented in the discussion of the organiser Understanding, analysing and evaluating, which follows.
3.2.3 Understanding, analysing and evaluating
The essence of this organiser is comprehension, beginning with word and sentence level texts (for learners at P1) and with progressively longer and more complex passages of text providing greater challenge across all the reading assessments. While questions for the P4 assessment tended to focus on main or prominent ideas, learners at P7 and S3 were asked to answer a range of literal, inferential and evaluative questions that, for example, might require learners to distinguish between fact and opinion, recognise persuasive language, use evidence from a text to support answers, or evaluate the reliability and credibility of texts.
Figure is an example of a P1 question from the organiser Understanding, analysing and evaluating. It assesses reading comprehension at sentence level. In this kind of question, the child chooses an answer by clicking on a word in the sentence. This skill was modelled in the practice assessment.
Figure 14: Example of a P1 Understanding, analysing and evaluating question, 'Sentence comprehension'

This item was rated as being at the high end of the P1 question difficulty range. While the instruction ('Read the sentence below … ') can be read to the learner using the audio button, the sentence itself has no audio support. In contrast to the Tools for reading question 'Rhyming word – feather' presented in Figure , the child is required to read independently. As well as being able to decode the words, the child needs to track the pronoun reference 'she' and interpret the meaning of 'but'. This question therefore relies on understanding information, rather than just finding and using it. The majority of P1 children presented with this question was able to complete it successfully.
It can be seen that the example question shown in Figure 14 requires the child both to decode the words (that is, to read independently) and to understand the meaning of the sentence. Another approach to assessing the development of reading comprehension at the earliest stages is to present written texts orally. This is because young children may have higher skills in comprehension than their decoding skills allow them to demonstrate. Accordingly, at P1, a combination of written texts with audio support and without audio support was used to assess the skills, knowledge and understanding associated with the organiser Understanding, analysing and evaluating.
Figure shows a P4 Understanding, analysing and evaluating question. This was the last of the five questions related to the text Cawky, which is included in Figure 12 above.
Figure 15: Example of a P4 Understanding, analysing and evaluating question, 'Cawky Question 5'

This question asks children to identify the main idea in a narrative, one of the key skills included in Understanding, analysing and evaluating in the P4 reading assessment. This question, rated as being at the high end of the P4 question difficulty range, was the most challenging question asked about the Cawky text. The most commonly chosen incorrect answer was the second option, and this is likely to be because of the explicit references to friendship both at the beginning and end of the passage. A significant minority of the learners who saw this question answered it correctly but the majority of those who demonstrated higher overall capacities on the P4 reading assessment responded successfully.
Figure shows a P7 reading question that addresses the organiser Understanding, analysing and evaluating. It was the third question presented to children about the information text Aphids, presented in Figure 13 above.
Figure 16: Example of a P7 Understanding, analysing and evaluating question, 'Aphids Question 3'

This question asks children to identify the nature of an unusual relationship in a scientific text. To answer this question successfully, children must understand and synthesise information contained across all sentences in the final paragraph of the text, before evaluating the relationship that is suggested. This question was in the middle of the question difficulty range for P7. It was presented to learners who had done relatively well in the first phase of the assessment and was answered correctly by the majority of these learners.
Reflecting the importance of the skills in this organiser within CfE, the majority of questions in the S3 reading assessment for 2018 to 2019 focused on Understanding, analysing and evaluating. Like the reading assessments for P4 and P7, the texts used for the S3 assessment covered a range of text types, contexts and topics, from narrative through to information or persuasive texts, and fiction through to scientific texts or blogs. As would be expected, the texts for S3 were generally longer and more complex than for the lower stages. The text in Figure is an example of a typical text for S3.
Figure 17: Example of an S3 Understanding, analysing and evaluating text, 'Shill Reviewing'

Shill Reviewing is an example of a non-continuous information text that includes prose, graphical information and a list, and which also includes persuasive language. Although the vocabulary is non-technical and the sentence structures are relatively simple, the different text formats and the overall argument must be integrated by the reader, providing a higher degree of challenge than the texts presented previously in this report.
Figure shows a Shill Reviewing question reflecting the organiser Understanding, analysing and evaluating.
Figure 18: Example of an S3 Understanding, analysing and evaluating question, 'Shill Reviewing Question 4'

Questions in this organiser at S3 asked young people to demonstrate skills such as interpreting main ideas or details of a text, comparing or contrasting elements within it, or reflecting on its audience or purpose. In Shill Reviewing Question 4, an inference must be drawn by comparing and contrasting the range of views expressed in the text. This question is from the high end of the S3 question difficulty range, and a minority of those learners to whom it was presented answered it correctly.
In contrast, almost all learners presented with the question shown in Figure below answered it correctly, including a majority of learners who demonstrated lower capacities in the S3 reading assessment overall. This item was also from the Understanding, analysing and evaluating organiser.
Figure 19: Example of an S3 Understanding, analysing and evaluating question, 'Shill Reviewing Question 2'

3.3 National outcomes for reading
3.3.1 Overall outcome
Charts 9a to 9d show the overall outcomes for reading across all stages (P1, P4, P7 and S3) and outcomes in relation to the three reading/literacy organisers: Tools for reading (TFR), Understanding, analysing and evaluating (UAE) and Finding and using information (FUI). The bars indicate the proportions of learners achieving outcomes corresponding to each of the six bands reported at each stage, in line with SNSA reports for the academic year 2018 to 2019.
Chart 9a: Reading outcomes by SNSA year P1

At P1, overall, about half of the children showed reading outcomes corresponding to the two middle bands, with the next largest proportion of learners having outcomes in the two upper bands. Very few children had outcomes corresponding to the two lower bands. When considering Tools for reading, almost half of children in P1 achieved outcomes in the two upper bands. When considering the organiser Understanding, analysing and evaluating, there were somewhat lower percentages with outcomes in the two highest categories, while relatively more children had outcomes corresponding to the two middle bands. For this organiser, there were also slightly more learners with outcomes in the two lower bands.
Chart 9b: Reading outcomes by SNSA year P4

At P4, similar proportions of learners achieved outcomes in the two upper bands and the two middle bands, while lower proportions, of only about a quarter of learners, had outcomes corresponding to the two lower bands. However, for Finding and using information, there were somewhat higher percentages of learners in the two upper bands than in the two middle bands. Understanding, analysing and evaluating showed similar proportions of learners in each of the four upper bands.
Chart 9c: Reading outcomes by SNSA year P7

The largest proportion of learners at P7 achieved outcomes in the two middle bands on their reading assessment, while only relatively small proportions, of less than a fifth, achieved outcomes in the two lower bands. Only slightly more than a third of learners had outcomes in the two upper bands. There was a slightly larger proportion of learners with outcomes in the top two bands for Finding and using information.
Chart 9d: Reading outcomes by SNSA year S3

At S3, overall, most learners achieved outcomes corresponding to the two middle bands. There was a slightly lower proportion in the top two bands for Finding and using information, as compared with Understanding, analysing and evaluating.
3.3.2 Sex
Charts 10a to 10d show the proportions of boys and girls in each of the literacy and reading bands for all stages, both overall for reading and by organiser.
For P1, P7 and S3, outcomes were similar, as the largest proportions of boys and girls achieved outcomes in the middle two bands. This was the case for the overall outcomes, and generally was also the case when considering only assessment material related to each of the organisers. Among P4 learners, the proportions for boys and girls in the two middle groups were relatively smaller, when compared to the other stages.
However, there were notable differences between boys and girls across stages. Among girls, there were consistently larger proportions achieving outcomes in the two upper bands, as compared with boys. There were similar differences between the two groups when reviewing outcomes separately by organiser content.
Chart 10a: Reading outcomes distributed by sex for P1

Compared to the outcomes at higher stages, there were relatively smaller differences between boys and girls among learners at P1 overall, as well as when only considering content related to each of the two organisers separately.
Chart 10b: Reading outcomes distributed by sex for P4

Among P4 learners, there was a notably larger proportion of boys than girls who achieved overall outcomes in the lower two bands, while there were relatively larger percentages of girls with outcomes in the two upper capacity bands. There were similar differences for Finding and using information and Understanding, analysing and evaluating.
Chart 10c: Reading outcomes distributed by sex for P7

At P7, there were larger proportions of girls than of boys achieving outcomes in the two upper bands, although these differences in proportions were somewhat smaller than among learners at P4. Again, there were similar differences when considering only assessment material related to Finding and using information and Understanding, analysing and evaluating.
Chart 10d: Reading outcomes distributed by sex for S3

Among learners at S3, there were also notably larger proportions of boys than girls who had outcomes in the two lower bands. Among girls, there were higher percentages with outcomes in the two upper bands than was the case among boys. This difference between the two groups was more marked for Understanding, analysing and evaluating. The proportions of girls and boys achieving outcomes in the two upper bands were similar when reviewing outcomes with respect to the organiser Finding and using information.
3.3.3 Scottish Index of Multiple Deprivation
This section reviews the distribution of learners for all Stages across categories that reflect the Scottish Index of Multiple Deprivation (SIMD). To simplify the display of outcomes and aid their interpretation, we have divided the original 20 categories (vigintiles) into three combined categories of socio-economic background. These combined categories are: SIMD 1–4, indicating the bottom socio-economic quintile (that is, the most deprived children and young people, those in vigintiles 1 to 4); SIMD 5–16, indicating the three middle quintiles (vigintiles 5 to 16); and SIMD 17–20, indicating the top socio-economic quintile (that is, the least deprived children and young people, those in vigintiles 17 to 20).
At each stage, the proportions of learners with outcomes corresponding to the two upper capacity bands was much larger in the least deprived group (SIMD 17–20). Likewise, there were also relatively higher proportions of learners who achieved outcomes in the two lower bands among learners classified in the most deprived group (SIMD 1–4). This pattern was present across all stages, both for reading/literacy overall and by organiser.
Charts 11a to 11d illustrate that the difference in reading/literacy outcomes between children from the most and least deprived groups (SIMD 1–4 and SIMD 17–20) was relatively small at P1, while it was more substantial at other stages. These observations apply both to overall outcome and when considering only assessment content related to each of the reading organisers.
Chart 11a: Reading outcomes distributed by SIMD* for P1
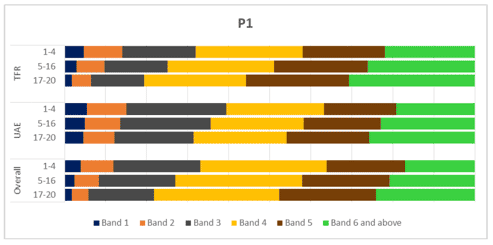
*The Scottish Index of Multiple Deprivation grades the socio-economic condition of the population over 20 categories (vigintiles). SIMD 1 to 4 correspond to the most deprived 20% of the population. SIMD 5 to 16 correspond to the middle 60% of the population. SIMD 17 to 20 correspond to the least deprived 20% of the population.
At P1, more children in the most deprived group (SIMD 1–4) compared to the least deprived group (SIMD 17–20) achieved outcomes in the two lower bands, while larger numbers of children in the least deprived group (SIMD 17–20) achieved outcomes in the two upper bands. These differences were somewhat larger when considering only assessment items pertaining to the organiser Tools for reading.
Chart 11b: Reading outcomes distributed by SIMD for P4

Chart 11c: Reading outcomes distributed by SIMD for P7

Chart 11d: Reading outcomes distributed by SIMD for S3

At P4, P7 and S3, a similar picture emerged but there were more marked differences in the proportions of learners with higher or lower outcomes when comparing the most deprived and least deprived groups. Among learners from the most deprived group, there were much higher percentages in the lower two capacity bands, whereas much larger numbers of learners in the least deprived group achieved outcomes in the top two bands. In all three stages, less than a third of learners from the most deprived group achieved outcomes corresponding to the two upper bands, while those from the least deprived group had much higher proportions with outcomes in the two upper bands. In P4 and P7, around twice as many learners in the least deprived group had outcomes in the upper two bands when compared with the most deprived group. There were similar outcomes when considering Finding and using information and Understanding, analysing and evaluating.
3.3.4 Ethnic background
This section looks at differences in reading/literacy outcomes between learners classified as having 'White Scottish' and other ethnic backgrounds. Charts 12a to 12d show the proportions of learners with outcomes in each of the reading bands within each of these two groups.
The outcomes show that generally there were only minor differences in percentages for bands across the two comparison groups. This was true when reviewing the overall reading outcomes and when considering the organisers separately. At P1, the proportions of children with outcomes in the top two bands were very slightly larger for children from 'White Scottish' backgrounds. In P4, P7 and S3, there were slightly higher proportions of learners with other ethnic backgrounds in the top two bands, as compared with learners with a 'White Scottish' background.
Chart 12a: Reading outcomes distributed by ethnic background for P1

Chart 12b: Reading outcomes distributed by ethnic background for P4

Chart 12c: Reading outcomes distributed by ethnic background for P7

Chart 12d: Reading outcomes distributed by ethnic background for S3

3.3.5 Free School Meal Entitlement
Charts 13a to 13d show the proportions of learners achieving outcomes across reading/literacy capacity bands, when comparing two groups defined by entitlement to free school meals. For these analyses, we distinguished those with registered entitlement from all other learners.[5]
Across all stages, there were noticeably larger proportions reflecting outcomes in the two upper bands among learners without FME than among those with FME. There were also correspondingly higher proportions of learners with FME achieving outcomes in the two lower bands. This pattern was similar across all stages and was present for reading/literacy overall and by organiser.
Chart 13a: Reading outcomes distributed by FME for P1

At P1, a review of the overall reading outcomes shows that just under half of the children without FME achieved outcomes in the two upper bands, while less than a third of those with FME achieved outcomes in these two bands. Differences were also similar when considering only assessment content related to each of the organisers: Tools for reading and Understanding, analysing and evaluating.
Chart 13b: Reading outcomes distributed by FME for P4

Chart 13c: Reading outcomes distributed by FME for P7

At P4 and P7, there were larger differences between the FME and not FME groups, for overall reading outcomes and for when considering assessment content for each of the two relevant organisers, separately.
Chart 13d: Reading outcomes distributed by FME for S3

Among learners at S3, the differences in proportions of learners with outcomes in the two upper capacity bands, across the two comparison groups, were slightly smaller than in P4 and P7.
3.3.6 Additional Support Needs
Charts 14a to 14d show the proportions of learners achieving outcomes across six reading/literacy capacity bands in each of the stages, comparing the outcomes between those who were identified as having Additional Support Needs (ASN) and all others.
Across all stages, there were notably higher proportions of learners with no ASN classification who achieved outcomes in the two upper bands. There were also notably larger proportions of learners classified with ASN who obtained outcomes in the lower two bands. This pattern was seen across all stages.
At P1, these differences between the two groups were somewhat smaller than at other stages.
Chart 14a: Reading outcomes distributed by ASN for P1

Chart 14b: Reading outcomes distributed by ASN for P4

Chart 14c: Reading outcomes distributed by ASN for P7

Chart 14d: Reading outcomes distributed by ASN for S3

3.3.7 Looked After Children at Home and Looked After Children Away from Home
Charts 15a to 15d show the proportions of learners achieving outcomes across the corresponding six capacity bands in reading/literacy by categories comparing learners classified as Looked After Children at Home (LAH) and/or Looked After Children Away from Home (LAA) with all other learners.
There were notably lower proportions achieving outcomes in the top two bands among learners who are registered as LAH and/or LAA than among other learners. Similarly, among LAH and/or LAA learners, there were also much larger proportions with outcomes in the lower two bands than among other learners. This pattern was very similar across all stages, when considering outcomes by organiser.
At P1, we found somewhat smaller differences among the comparison groups than at higher stages (P4, P7 and S3); similar observations were made with regard to comparisons related to SIMD and FME.
Chart 15a: Reading outcomes distributed by LAH/LAA for P1

Chart 15b: Reading outcomes distributed by LAH/LAA for P4

Chart 15c: Reading outcomes distributed by LAH/LAA for P7

Chart 15d: Reading outcomes distributed by LAH/LAA for S3
3.3.8 English as an Additional Language
Charts 16a to 16d compare learners by language background: English as an Additional Language (EAL) compared with all other learners. The category 'EAL' refers to those learners whose record in SEEMiS showed that they had English as an additional language. The 'Not EAL' category comprises both learners who were recorded as not having EAL and those for whom there was no entry in this field.
There were relatively small but notably higher proportions of learners without EAL in the top two bands, both in terms of overall outcome, and when considering separately assessment content related to each individual organiser. The pattern was very similar across all stages.
Chart 16a: Reading outcomes distributed by EAL for P1

Chart 16b: Reading outcomes distributed by EAL for P4

Chart 16c: Reading outcomes distributed by EAL for P7

Chart 16d: Reading outcomes distributed by EAL for S3
