Scottish Housing Market Review: Q3 2021
Summary of the latest Scottish housing market data.
Rental Prices
Private Housing Rental Prices
Private housing rental prices increased by 1.6% annually in Scotland to August 2021. This continues a period of relative stability in nominal private rental price growth. Since June 2017, rental price growth has ranged between 0% and 2%, with an average of 0.7%. In real terms (adjusting for inflation, using CPI), the annual change in August 2021 was -1.6%. Chart 3.1 shows that the annual change in real private housing rental prices rose towards positive territory as CPI inflation fell due to the impact of Covid-19, but it has returned to negative territory with the recent increase in CPI inflation, which reached 3.2% in August 2021. The heightened level of CPI inflation can be partly explained by a base effect, with discounted restaurant and café prices due to the Eat Out to Help Out Scheme in August 2020 and reductions in VAT for the same sector.
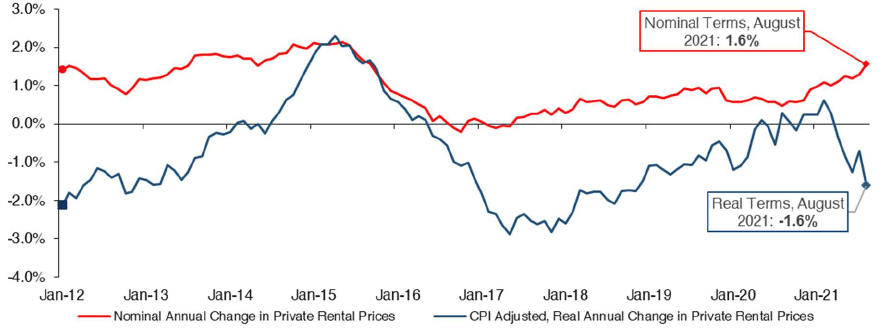
Source: ONS Rental Price Index, Consumer Price Inflation (CPI)
The moderate growth in average rents across Scotland masks significant regional variation. Scottish Government statistics show that from 2010 to 2020 (years to end September), the annualised average rate of change in mean rent for a 2 bedroom property was over double that of inflation (CPI) (1.4%) in both Greater Glasgow (3.5%) and Lothian (3.8%) Broad Rental Market Areas ("BRMA"). Meanwhile, the annualised average rate of change was equal to or below that of inflation (CPI) in 10/18 BRMAs.
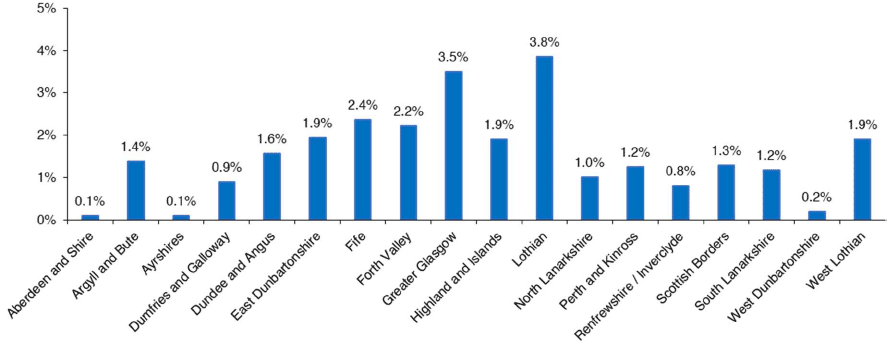
Source: SG/ONS CPI
* Note: Scottish Government statistics are based almost entirely on advertised rents at point of new let, and thus will tend to be higher than the ONS data which makes an allowance for rent changes in existing lets. In addition, chart 3.2 looks solely at 2 bedroom properties, whilst 3.1 looks at the entire market
Contact
Email: William.Ellison@gov.scot