Scottish Housing Market Review: Q3 2021
Summary of the latest Scottish housing market data.
Sales
Key points
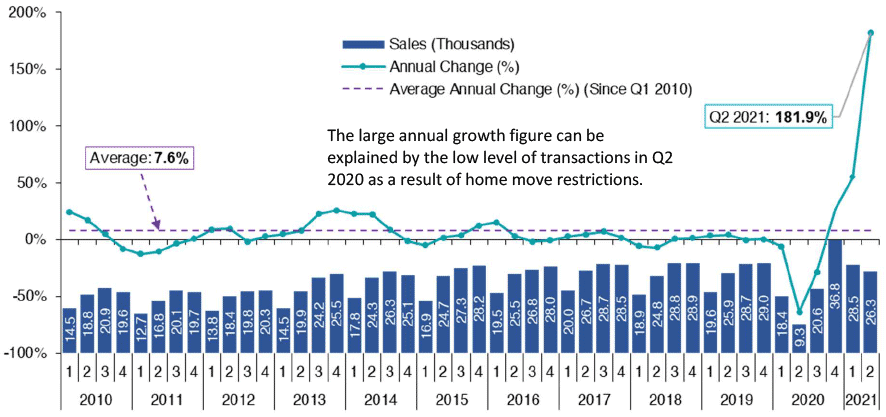
Housing market activity appears to be stabilising at more normal levels, with Registers of Scotland statistics showing that there were 26,324 residential property sales registered across Scotland in Q2 2021. Whilst this was an annual increase of 181.9%, this can be explained by the low level of transactions in Q2 2020 as a result of the home move restrictions. Relative to the 4 year average for Q2 (2016 – 2019), transactions were up by 2.2%.
More recent data using residential LBTT returns indicates that housing market activity could be gradually returning to pre-pandemic levels, with LBTT returns in August 2021 8.3% higher than the 2016-2019 average.
National
Source: Registers of Scotland
Scottish Sales Performance: National
Following the surge in transactions after home move restrictions were lifted in late June 2020, which was fuelled by pent-up demand as well as the temporary reduction in LBTT (which ended on 31 March 2021), data for Q2 2021 suggests that housing market activity has stabilised at more normal levels, with Registers of Scotland statistics showing that there were 26,324 residential property sales registered across Scotland. Whilst this was an annual increase of 181.9%, this can be explained by the low level of transactions in Q2 2020 as a result of the home move restrictions. Relative to Q2 2019, transactions in Q2 2021 were up by 1.7%, while comparing to the 4 year average for Q2 (2016 – 2019), transactions were up by 2.2%.
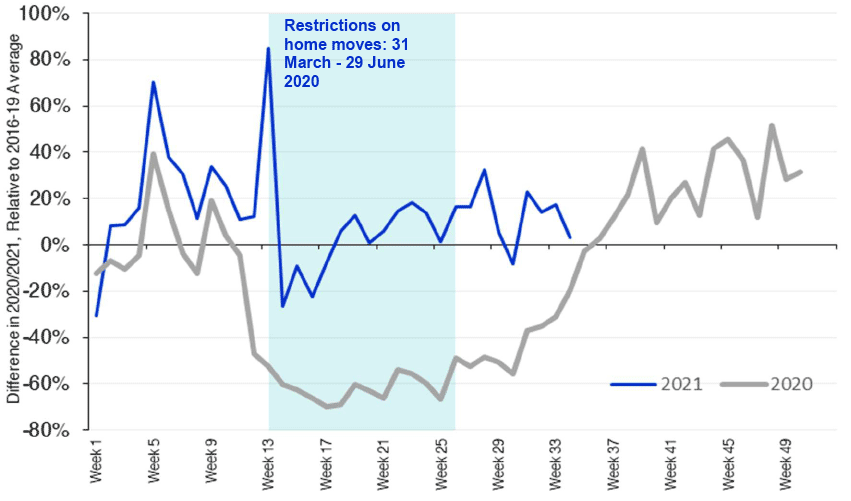
More timely statistics from Revenue Scotland on the number of residential LBTT returns submitted confirm that the housing market is returning to more normal levels. Chart 1.2 plots the percentage difference between weekly residential LBTT returns in 2021 and 2020, and the average from 2016 to 2019 for the corresponding week. In March 2021, residential LBTT returns were 55.1% above the 2016-2019 average. This has since fallen to 18.2% in June 2021, 12.1% in July 2021 and 8.3% in August 2021.
Source: Revenue Scotland
Scottish Sales Performance: Regional
Registers of Scotland data shows that the strong growth in housing market activity in Q2 2021 was experienced across the different regions of Scotland. The largest increase in residential property sales occurred in Edinburgh, Lothians and the Borders, where sales rose by an annual 206.3%. Sales in the Forth Valley increased by the lowest amount in Scotland but this remains a sizeable increase in transactions, up by 129.9% on the same period last year.
Analysing the annual change using a rolling four quarters method, it can be seen that the increase in transactions for the one year period to Q2 2021 relative to the year prior has also been experienced in a broadly uniform manner across Scotland. The largest increase in sales on a rolling four quarter basis was in Aberdeen/shire & Moray by 36.5% and the lowest increase in sales was in the Forth Valley by 25.9%.
A summary of residential property sales activity by Scottish region is included below. This contains the number of residential property sales registered in Q2 2021, the annual change, as well as the annual change in sales using a rolling four quarter period to Q2 2021. The latter is included to smooth out volatility in quarterly data.
Table 1. Regional residential transactions
- Aberdeen/shire & Moray
- Sales – Q2 2021 2,741
- 12 Month Change 188.8%
- Annual change (rolling 4 quarters) 36.5%
- A&B, Highland & Islands
- Sales – Q2 2021 1,804
- 12 Month Change 144.4%
- Annual change (rolling 4 quarters) 26.1%
- Ayrshires & D&G
- Sales – Q2 2021 2,478
- 12 Month Change 175.3%
- Annual change (rolling 4 quarters) 31.8%
- Clyde Valley
- Sales – Q2 2021 8,900
- 12 Month Change 186.4%
- Annual change (rolling 4 quarters) 29.1%
- Edinburgh, Lothians & Borders
- Sales – Q2 2021 5,091
- 12 Month Change 206.3%
- Annual change (rolling 4 quarters) 32.9%
- Forth Valley
- Sales – Q2 2021 1,313
- 12 Month Change 129.9%
- Annual change (rolling 4 quarters) 25.9%
- Tayside & Fife
- Sales – Q2 2021 3,997
- 12 Month Change 183.3%
- Annual change (rolling 4 quarters) 35.0%
- Scotland
- Sales – Q2 2021 26,324
- 12 Month Change 181.9%
- Annual change (rolling 4 quarters) 31.2%
Source: Registers of Scotland
Contact
Email: William.Ellison@gov.scot