Scottish Housing Market Review: Q2 2022
Scottish housing market bulletins collating a range of statistics on house prices, housing market activity, cost and availability of finance and repossessions.
Part of
1. Sales
National
Source: Registers of Scotland
Scottish Sales Performance: National
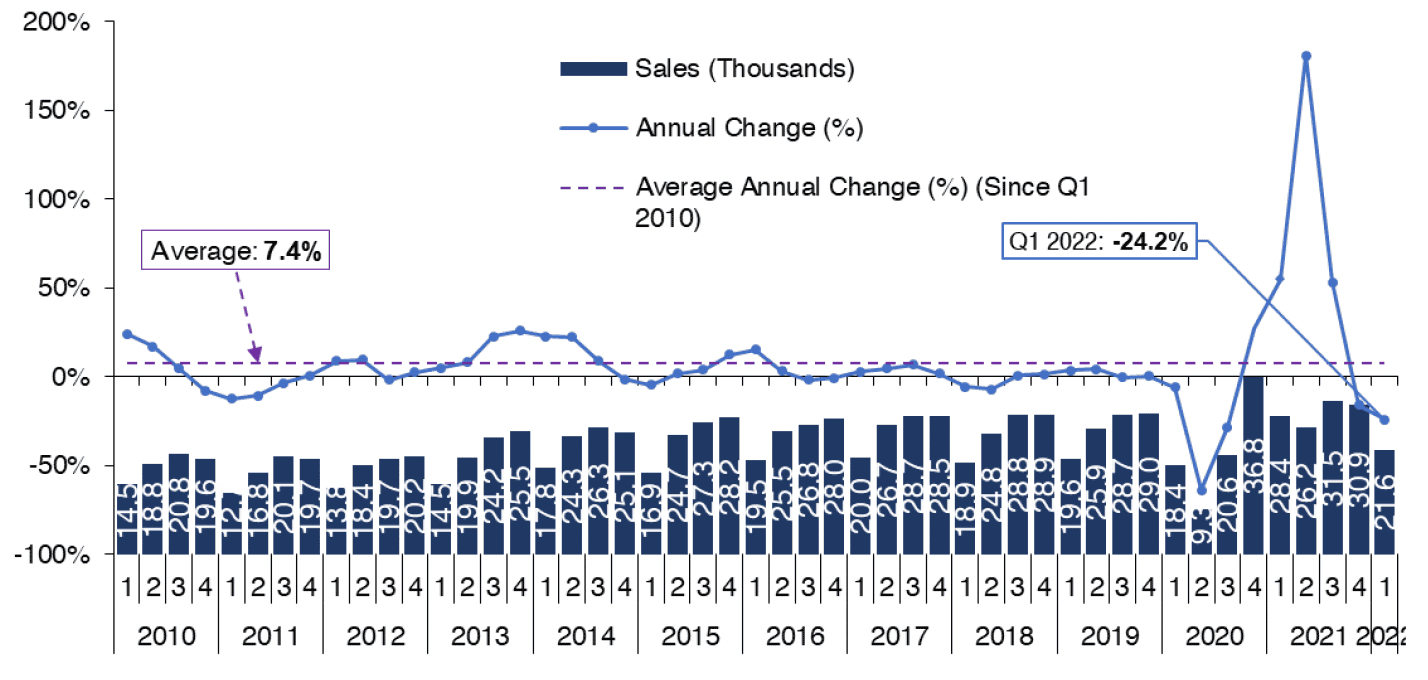
Following the surge in transactions after home move restrictions were lifted in late June 2020, which was fuelled by pent-up demand as well as the temporary reduction in LBTT (which ended on 31 March 2021), data for Q1 2022 suggests housing market activity is stabilising but remains above pre-pandemic levels, with Registers of Scotland statistics showing that there were 21,553 residential property sales registered across Scotland. Whilst this was an annual decrease of 24.2%, this can be explained by the elevated level of transactions in Q1 2021, prior to the end of the temporary reduction in LBTT, as mentioned above. Relative to Q1 2019, transactions were up by 10.0%.
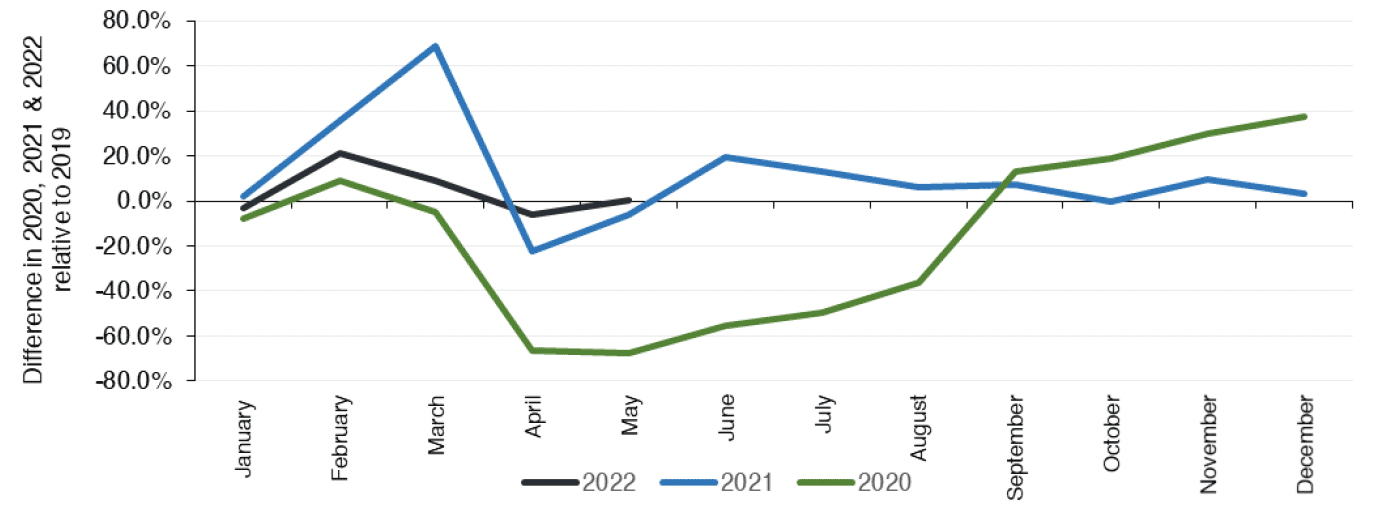
More timely statistics from Revenue Scotland on the number of residential LBTT returns submitted also confirms that although housing market activity remains elevated, it is gradually returning to more normal levels. Chart 1.2 plots the percentage difference between monthly residential LBTT returns in 2020, 2021 and 2022 relative to 2019 for the corresponding month, with 2019 reflecting pre-Covid market conditions. Following a surge and then dip in transactions around March 2021 when the temporary reduction in LBTT ended, since May 2021 monthly transactions have generally been somewhat higher than the same month in 2019. The first five months of 2022 relative to the same period in 2019 has highlighted this trend, with transactions 3.1% higher in 2022.
Source: Revenue Scotland
Scottish Sales Performance: Regional
Registers of Scotland data shows that the reduction in housing market activity in Q1 2022 relative to Q1 2021 (which was elevated by the strong recovery after the lockdown in Q2 2020 and the temporary reduction in LBTT, as discussed above) was experienced across the different regions of Scotland. The largest decrease in residential property sales occurred in Edinburgh, Lothians and Borders, where sales fell by an annual 29.1%. Sales in Aberdeen/shire and Moray decreased by the lowest amount in Scotland, down by 15.7% on the same period last year.
Analysing the annual change using a rolling four quarters method, it can be seen that the increase in transactions for the one year period to Q1 2022 relative to the year prior at the national level has also been experienced across Scotland. The largest increase in sales on a rolling four quarter basis was in Aberdeen/shire and Moray by 30.5% and the lowest increase in sales was in the Forth Valley by 8.9%.
A summary of residential property sales activity by Scottish region is included below. This contains the number of residential property sales registered in Q1 2022, the annual change, as well as the annual change in sales using a rolling four quarter period to Q1 2022. The latter is included to smooth out volatility in quarterly data.
Aberdeen/shire & Moray
|
Sales – Q1 2022 2,257 12 Month Change -15.7% Annual change (rolling 4 quarters) 30.5% |
|---|---|
Argyll & Bute, Highland & Islands
|
Sales – Q1 2022 1,578 12 Month Change -25.2% Annual change (rolling 4 quarters) 14.8% |
Ayrshires, Dumfries & Galloway
|
Sales – Q1 2022 1,965 12 Month Change -22.3% Annual change (rolling 4 quarters) 13.9% |
Clyde Valley
|
Sales – Q1 2022 7,250 12 Month Change -23.1% Annual change (rolling 4 quarters) 14.6% |
Edinburgh, Lothians & Borders
|
Sales – Q1 2022 4,343 12 Month Change -29.1% Annual change (rolling 4 quarters) 14.5% |
Forth Valley
|
Sales – Q1 2022 1,138 12 Month Change -24.1% Annual change (rolling 4 quarters) 8.9% |
Tayside & Fife
|
Sales – Q1 2022 3,022 12 Month Change -25.8% Annual change (rolling 4 quarters) 15.4% |
Scotland
|
Sales – Q1 2022 21,553 12 Month Change -24.2% Annual change (rolling 4 quarters) 15.9% |
Source: Registers of Scotland
Contact
Email: William.Ellison@gov.scot