Scottish Household Survey 2020 - telephone survey: key findings
A summary of the key findings from the Scottish Household Survey 2020 telephone survey.
Section six - Public services and institutions
The results of the SHS 2020 telephone survey are not directly comparable to SHS results for previous years. Please see Introduction for more detail.
61% of adults were satisfied with the quality of all three of the following public services: local health services, local schools and public transport (Table 6.10).
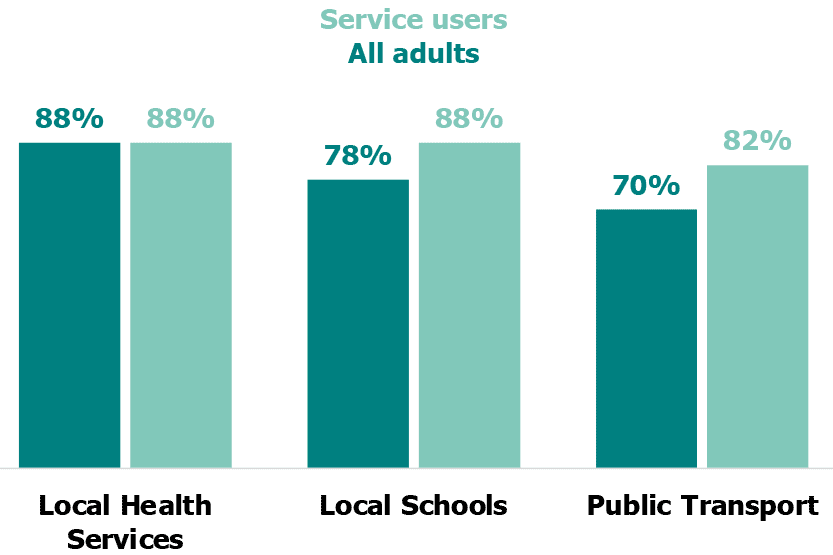
Satisfaction with local schools and public transport was higher among service users than among all adults (Tables 6.4, 6.6, 6.7 and 6.9).
There was no difference in satisfaction with local health services between service users and all adults (Tables 6.1 and 6.3).
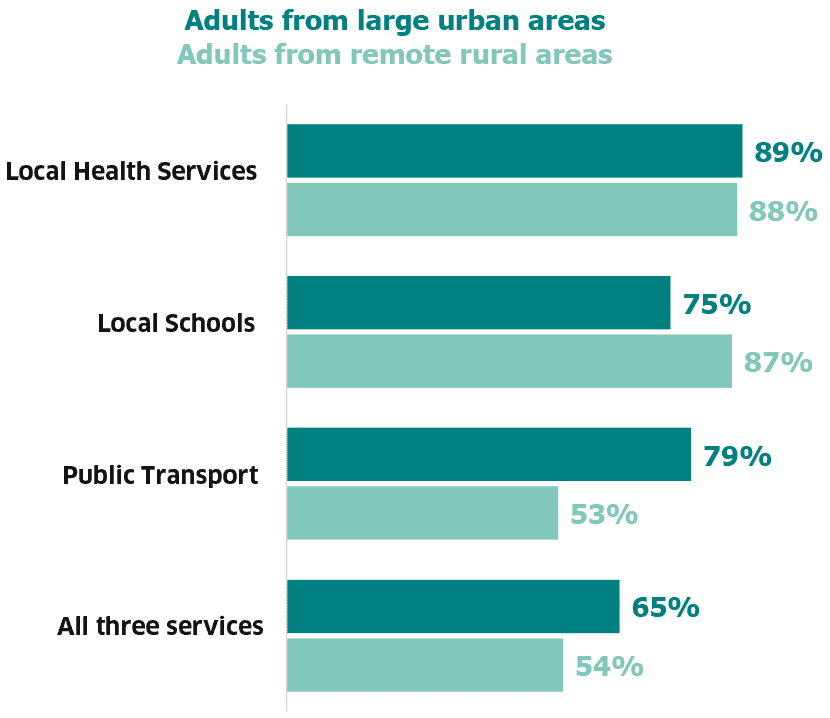
The percentage of adults satisfied with all three public services was lower in remote rural areas (54%) than in large urban areas (65%) (Table 6.10).
Most of this difference was due to adults from remote rural areas being less satisfied with public transport (Table 6.7).
25% of adults felt they could influence decisions affecting their local area (Table 6.12).
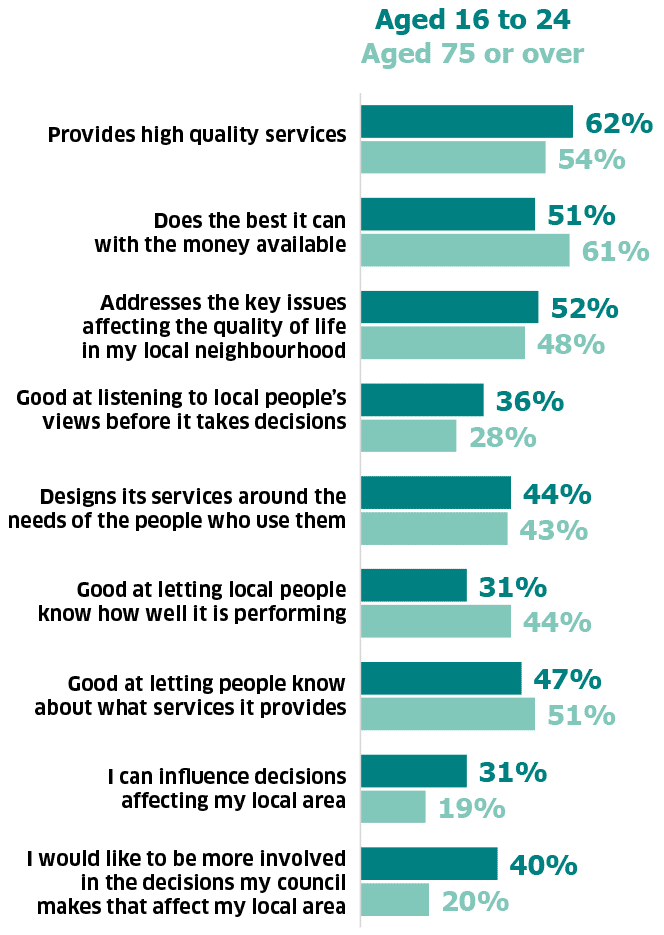
Adults aged 75 or over were more likely than those aged 16 to 24 to agree that their council was good at letting local people know how well it is performing, and were less likely to want greater involvement in the decisions their council make that affect their local area. There were no other statistically significant differences between these age groups in their agreement with statements about their local council.
Adults living in the 20% least deprived areas were more likely to agree that their council address the key issues affecting the quality of life in their local neighbourhood (46%) than those from the 20% most deprived areas (36%) (Table 6.13).
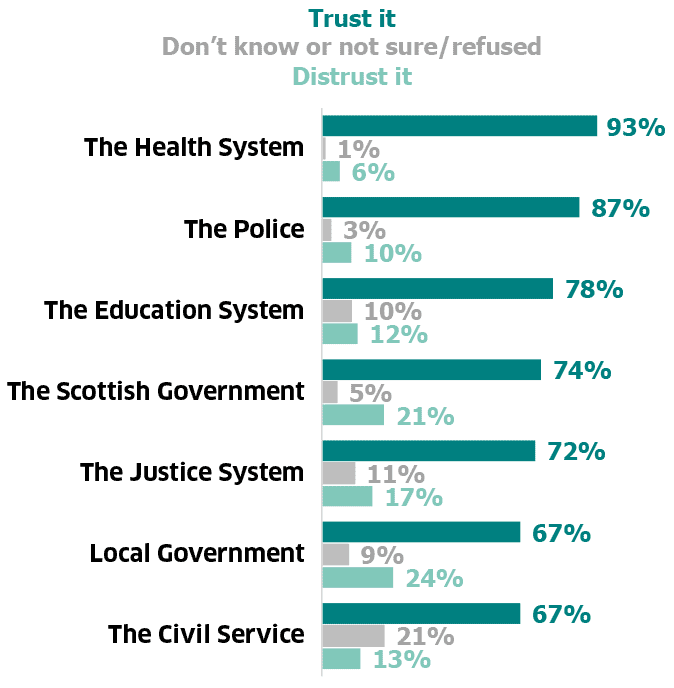
93% of adults trusted the Health System, making it the institution that adults were most likely to express trust in, followed by the police (Table 6.14).
67% of adults reported that they trust the Civil Service and Local Government, making them the public institutions that adults were least likely to express trust in.
However, care must be taken when making comparisons between institutions because the percentage of adults saying they don’t know or are not sure if they trust an institution varies, e.g. 21% of adults for the Civil Service compared to only 1% of adults for the Health System.
Trust in institutions varied by age, with adults aged 16 to 24 being more likely than adults aged 75 or over to express trust in the Scottish Government (81% compared to 57%), Local Government (75% compared to 60%) and the Education System (85% compared to 62%) (Tables 6.15, 6.16 and 6.18).
91% of adults thought it was very or fairly important to vote in local council elections (Table 6.22).
Contact
Email: shs@gov.scot