Scottish Household Survey 2020 - telephone survey: key findings
A summary of the key findings from the Scottish Household Survey 2020 telephone survey.
Section five - Physical activity and sport
The results of the SHS 2020 telephone survey are not directly comparable to SHS results for previous years. Please see Introduction for more detail.
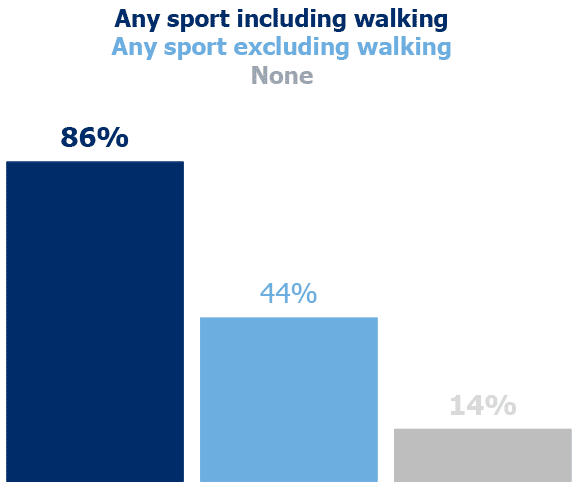
86% of adults had participated in physical activity in the previous four weeks (Table 5.1).
Walking was the most common activity with 82% of adults having done this for recreational purposes for at least 30 minutes in the last four weeks.
61% of adults who participated in physical activity did so on more than half of the last 28 days (Table 5.7).
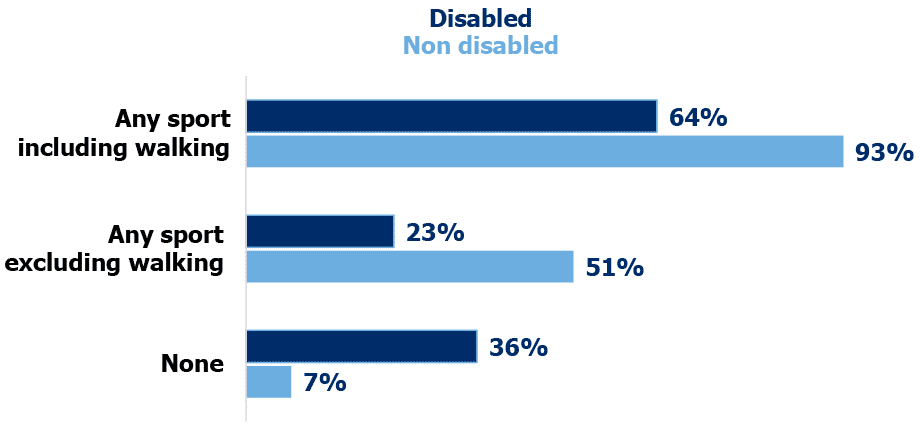
Adults with a disability were less likely to participate in physical activity (Table 5.3).
64% of adults with a disability participated in physical activity compared to 93% of adults with no disability.
Walking was the most common activity among disabled adults, with 61% having done this for recreational purposes for at least 30 minutes in the last four weeks.
36% of adults with a disability did not participate in any physical activity.
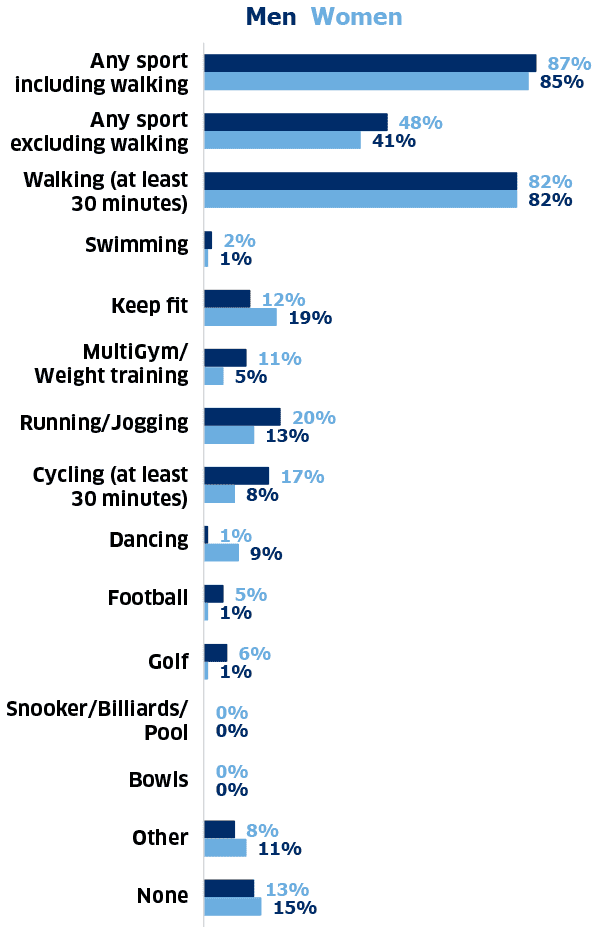
When including walking, there was little difference in participation in physical activity between men (87%) and women (85%). However, when excluding walking, men (48%) were more likely to participate than women (41%) (Table 5.1).
Walking was the most common form of physical activity for men and women.
Men were more likely than women to participate in running/jogging, cycling, MultiGym/weight training, football and golf.
Women were more likely than men to participate in keep fit and dancing.
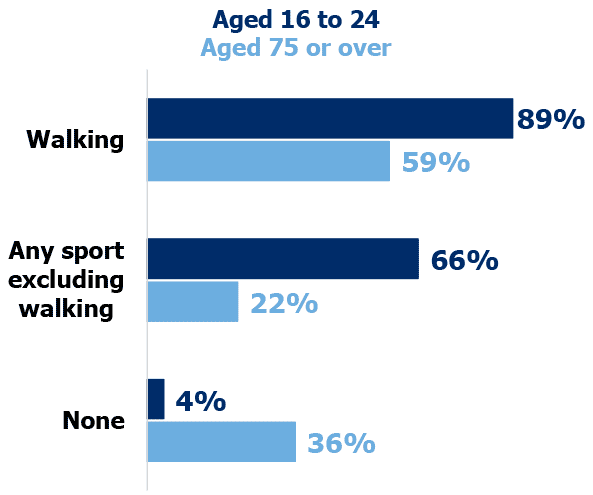
Participation in physical activity varied by age (Table 5.2).
Adults aged 16 to 24 were the more likely to participate in recreational walking (89%) and sports excluding walking (66%) than those aged 75 or over.
36% of adults aged 75 or over did not participate in any physical activity.
Participation in physical activity varied by ethnicity (Table 5.6).
White Scottish adults were less likely to participate in recreational walking (81% compared to 87% and 92%, respectively) and sports excluding walking (42% compared to 50% and 60%, respectively) than white other British adults and other white adults. Other white adults includes Irish, Gypsy/Traveller, Polish and other white ethnic groups.
There were no statistically significant differences between minority ethnic groups and white Scottish adults in participation in walking or any sport excluding walking, though there was some evidence of differences for specific sports. Minority ethnic groups includes mixed or multiple, Asian, African, Caribbean or Black, Arab or any other ethnic groups.
Participation in physical activity varied by deprivation (Table 5.5).
Adults living in the 20% least deprived areas were more likely to participate in recreational walking (89%) and sports excluding walking (56%) than those living in the 20% most deprived areas.
Walking was the most common physical activity undertaken by adults living in the least and most deprived areas.
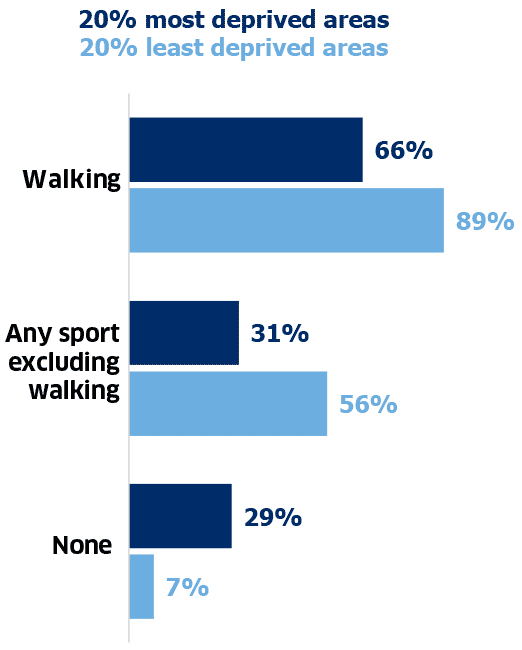
29% of adults from the 20% most deprived areas did not participate in any physical activity.
Contact
Email: shs@gov.scot