Scottish Household Survey 2020 - telephone survey: key findings
A summary of the key findings from the Scottish Household Survey 2020 telephone survey.
Section two - Neighbourhoods and communities
The results of the SHS 2020 telephone survey are not directly comparable to SHS results for previous years. Please see Introduction for more detail.
96% of adults rated their neighbourhood as a very or fairly good place to live (Table 2.4).
59% of adults rated their neighbourhood as a very good place to live, and 37% rated it as a fairly good place to live.
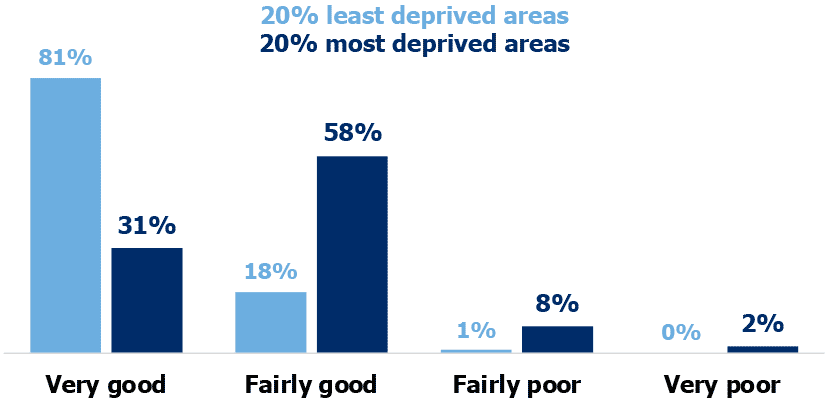
In the 20% least deprived areas in Scotland, 81% rated their neighbourhood as a very good place to live, whereas only 31% did so in the 20% most deprived areas.
In the 20% most deprived areas, 11% of adults rated their neighbourhood as a fairly or very poor place to live, whereas only 1% did so in the 20% least deprived areas.
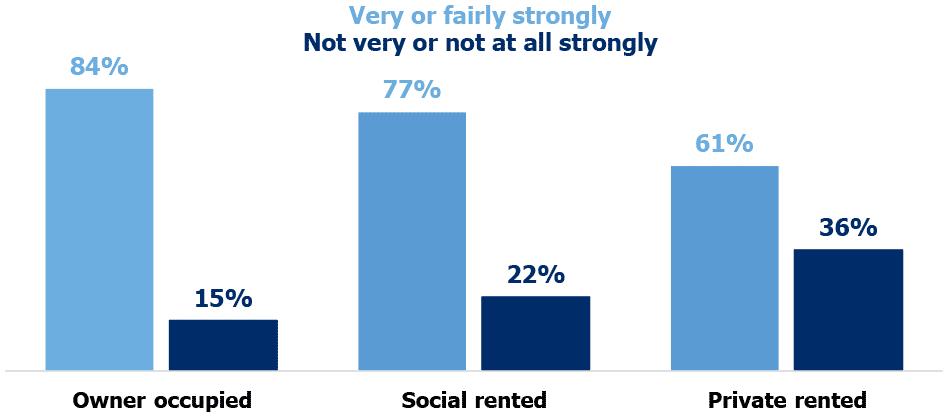
84% of adults felt a very or fairly strong sense of belonging to their community (Table 2.14).
This differed by tenure. 84% of adults who were owner occupiers reported that they felt a very or fairly strong sense of belonging. The equivalent figures were 77% for those in the social rented sector and 61% for those in the private rented sector.
Adults living in less deprived areas were more likely to report a strong sense of belonging than those living in more deprived areas: 88% of adults in the 20% least deprived areas reported that they felt a very or fairly strong sense of belonging, compared to 72% in the 20% most deprived areas (Table 2.13).
Sense of belonging to one’s community increased with age (Table 2.11): 93% of adults aged 75 or over felt a very or fairly strong sense of belonging compared to 74% of adults aged 16 to 24.
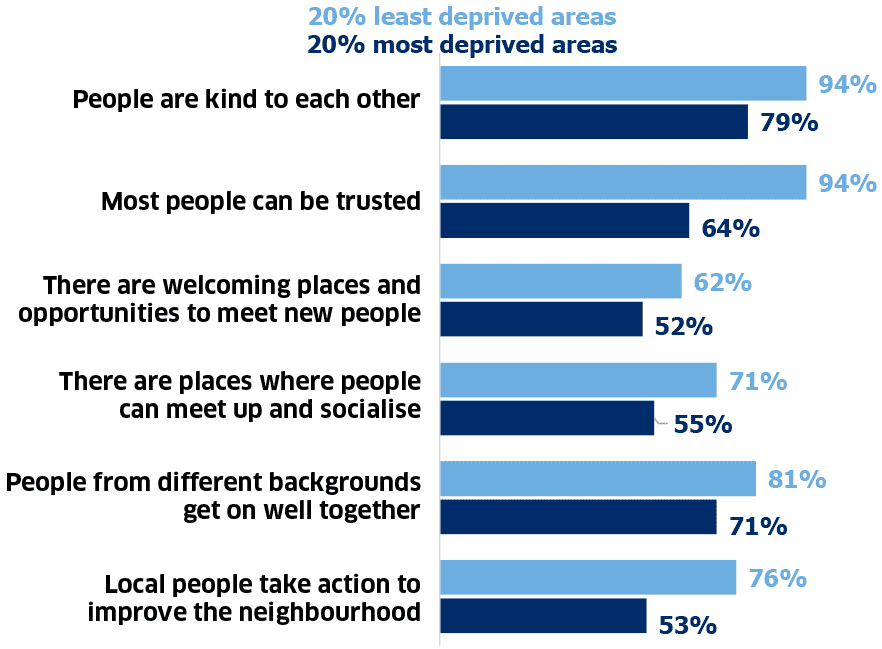
61% of adults agreed that there are places in their neighbourhood where people can meet up and socialise (Table 2.8).
This varied by area deprivation: 71% of adults in the 20% least deprived areas agreed that there are places in their neighbourhood where people can meet up and socialise, compared to 55% of adults in the 20% most deprived areas.
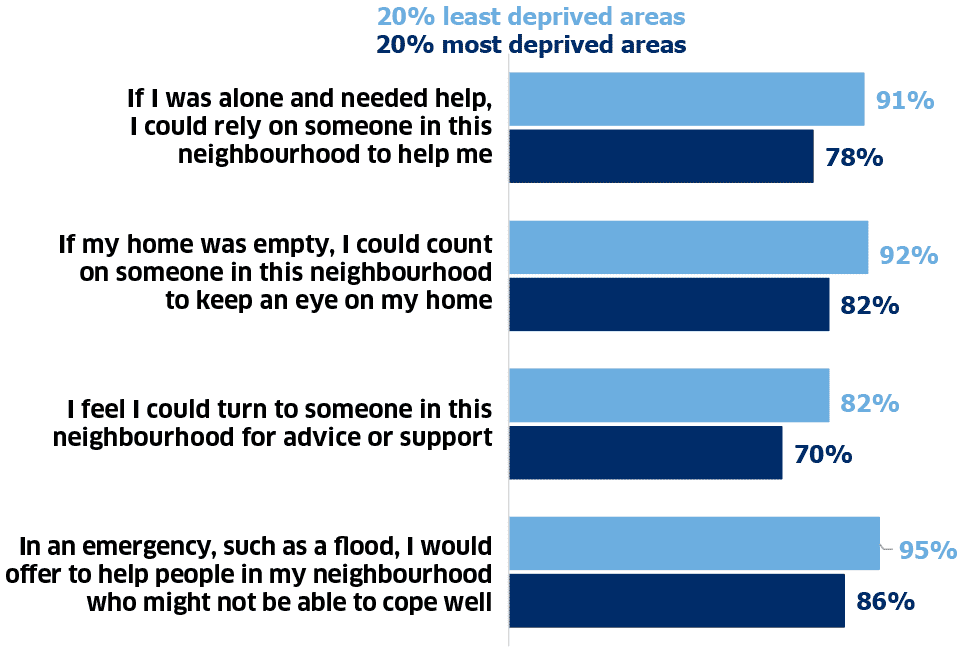
Most adults agreed with statements about their involvement with other people in their neighbourhood: if I was alone and needed help, I could rely on someone to help me (88%); if my home was empty, I could count on someone to keep an eye on it (88%); I could turn to someone for advice or support (80%) and; in an emergency I would offer to help people who might not be able to cope well (92%) (Table 2.18).
This varied by area deprivation with adults from the 20% least deprived areas more likely to agree than those from the 20% most deprived areas.
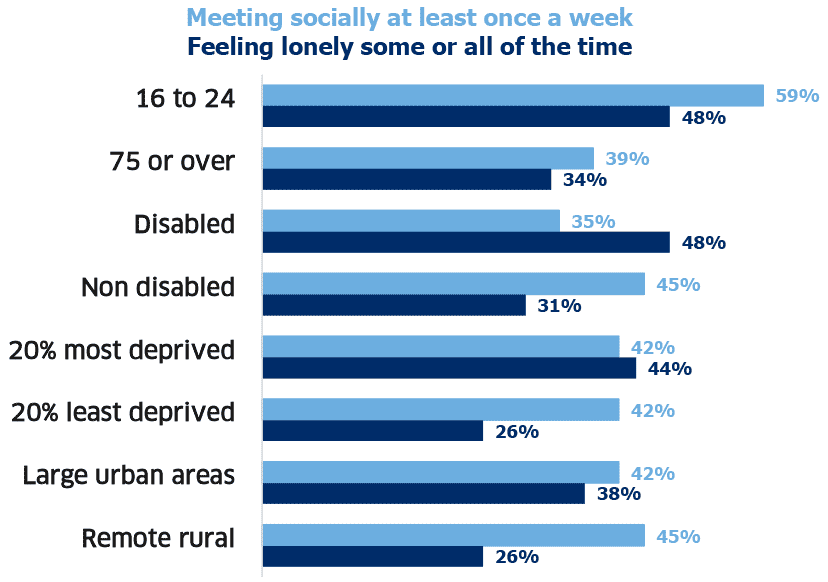
44% of adults rarely (less than once a month) or never met people socially (Table 2.19) and 35% of adults reported feeling lonely (Table 2.25).
Although younger adults were more likely to meet others socially at least once a week than older adults, they were also more likely to report feeling lonely. Disabled adults (Table 2.28), adults from deprived areas (Table 2.26) and adults from urban areas (Table 2.27) were more likely to report feeling lonely.
Younger adults living in single households were most likely to report feeling lonely (65% of single parents and 63% of single adults), followed by older adults living in single pensioner households (46%) (Table 2.29).
50% of adults perceived at least one problem to be very or fairly common in their neighbourhood (Table 2.31). The most commonly perceived problems were rubbish or litter lying around (32%), animal nuisance (29%), and drug misuse (15%).
Most problems were perceived to be common in their neighbourhood by more adults in the 20% most deprived areas compared to those in the 20% least deprived areas.
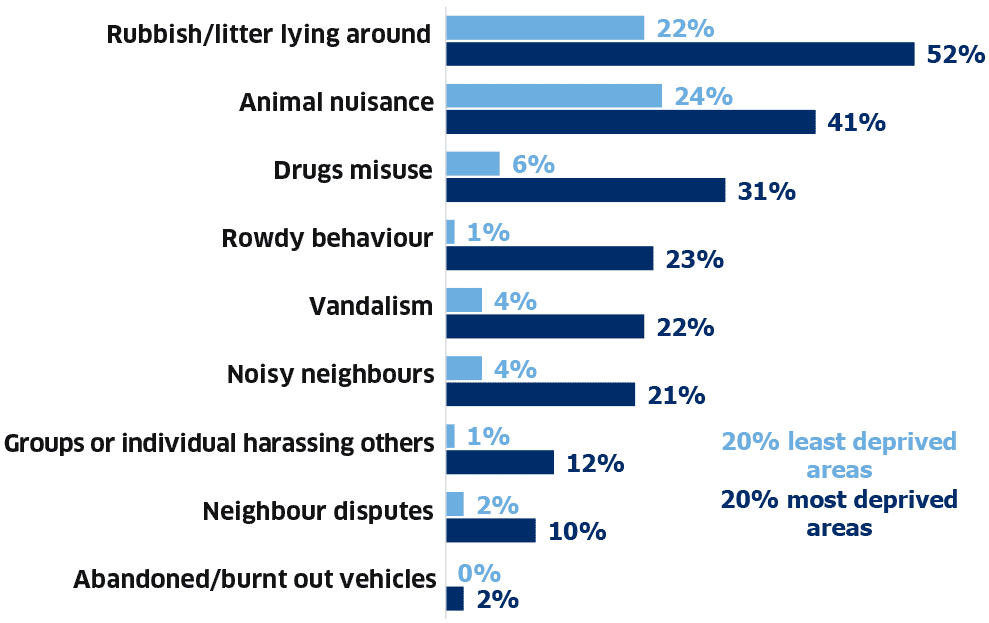
Animal nuisance was a problem experienced (40%) to a greater extent than it was perceived to be common (29%) (Table 2.35). The opposite was true for drug misuse (8% experienced it, compared to 15% who perceived it as common).
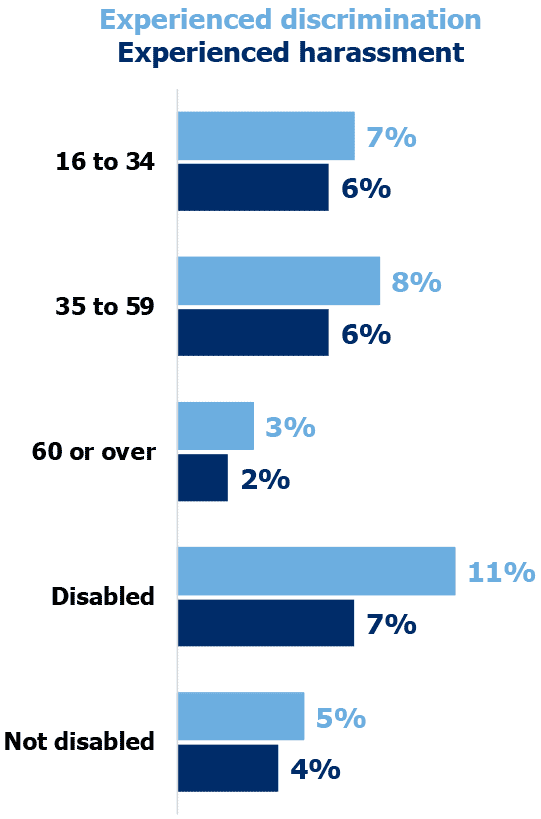
6% of adults reported having experienced discrimination and 5% of adults reported having experienced harassment (Tables 2.40 and 2.48).
Adults aged 60 or over were less likely to have experienced discrimination and harassment than younger adults.
Disabled adults were more likely to have experienced discrimination (11%) and harassment (7%) than non disabled adults (5% and 4%, respectively) (Tables 2.45 and 2.53).
Contact
Email: shs@gov.scot