Scottish household survey 2019: key findings
An infographic summary of the key findings from the 2019 edition of the Scottish Household Survey, a continuous survey running since 1999 based on a sample of the general population in private residences in Scotland.
Section Twelve - Culture and Heritage
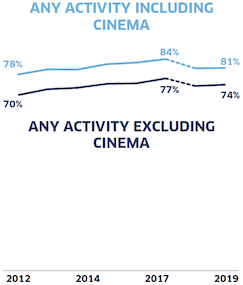
In 2019, 81% of adults in Scotland had attended a cultural event or place in the past twelve months. When excluding going to the cinema, this figure was 74%.
The proportion of adults attending any cultural event or place was increasing from 2012 to 2017, both including and excluding the cinema.
The figures for 2019 were consistent with 2018 results. However, the questions are not directly comparable with figures before 2018 as the questions were revised, and 2018 formed a new baseline.
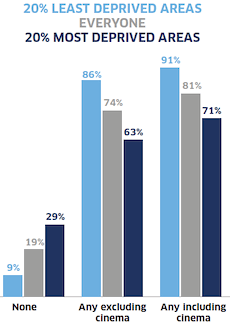
This bar chart shows the proportion of adults in the most and least deprived areas attending cultural events or places in 2019, differentiating between “any including the cinema”, “any excluding the cinema” and “none”. It also shows the Scotland average for all three options. It highlights that adults in the least deprived areas were more likely to attend any cultural activity than adults in the most deprived areas, and adults in the most deprived areas were more likely to not attend any cultural events or places than those in the least deprived areas.
In 2019, 90% of adults in Scotland were culturally engaged
either by attending or visiting a cultural event or place, or by participating in a cultural activity
Attendance at cultural events or places increased as the level of deprivation of the household area decreased.
Attendance was significantly lower in the 20% most deprived areas in Scotland. 71% of those living in the 20% most deprived areas attended a cultural event or place including the cinema compared with 91% of those living in the 20% least deprived areas.
29% of adults in the most deprived areas had not attended any cultural event or place in the past twelve months.
Lack of time and the costs of tickets were reported as the most common barriers to attendance.
This bar chart lists the most common types of cultural events or places attended in 2019, showing the proportion of adults attending them in the most and least deprived areas. In order of how common they were, the activities are the following: “Cinema”, “Live music event”, “historic place”, “museum”, and “theatre”. It highlights that while a lot of these activities were popular in both the most and least deprived areas, attendance was normally higher among adults living in the least deprived areas.
19% of adults who go to the library did so at least once per week
This made it the most common cultural event or place for adults to go at least once per week
The cinema was the most common cultural place or event to attend in Scotland, with 58% of adults having gone over the past year.
The cinema was the most common type of cultural event attended by both those living in the 20% most and those living in the 20% least deprived areas in Scotland.
While 70% of adults in the least deprived areas had attended the cinema, 48% of adults in the most deprived areas had done so.
Among the five most common types of cultural events or places, all had been attended by a higher proportion of adults in the least deprived areas.
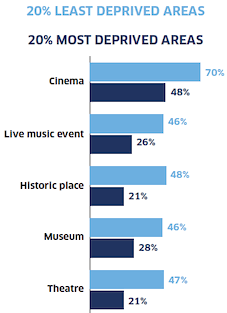
This bar chart lists the most common types of cultural events or places attended in 2019, showing the proportion of adults attending them in the most and least deprived areas. In order of how common they were, the activities are the following: “Cinema”, “Live music event”, “historic place”, “museum”, and “theatre”. It highlights that while a lot of these activities were popular in both the most and least deprived areas, attendance was normally higher among adults living in the least deprived areas.
This line graph shows the proportion of adults attending a cultural event or place in the past twelve months and how this has changed between 2012 and 2019, differentiating between “any activity including the cinema” and “any activity excluding the cinema”. It shows that both trends were increasing before 2017, but 2018 constituted a new baseline as the questions were revised this year.
Among those that had not attended any cultural events over the past year, the cinema (14%) was the most common place to want to go to
70% said that there was no event or place they would like to attend
In 2019, 75% of adults in Scotland participated in a cultural activity in the past twelve months. When excluding reading, this number was 52%.
The proportion of adults participating in any cultural activity when reading is included was consistent across 2012 to 2017. However, when excluding reading, the figure had increased from 48% in 2012 to 54% in 2017.
The figures from 2019 were consistent with 2018 results. However, the questions are not directly comparable with figures before 2018 as the questions were revised, and 2018 formed a new baseline.
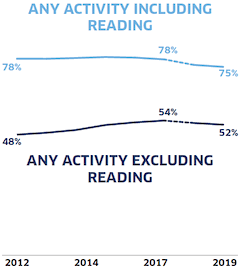
This line graph shows the proportion of adults participating in a cultural activity in the past twelve months and how this has changed between 2012 and 2019, differentiating between “any activity including reading” and “any activity excluding reading”. It highlights that the proportion of adults participating in activities other than reading increased between 2012 and 2017. However, 2018 constituted a new baseline, as the questions were revised this year.
In the 20% most deprived areas, 62% of adults had taken part in a cultural activity over the past year if reading is included
If reading is excluded, 41% of adults had taken part in cultural activities in these areas
Participation in cultural activities increased as the level of deprivation of the household area decreased.
In 2019, the most common cultural activity to participate in was reading, with 62% of adults having read in the past year.
While 74% of adults in the 20% least deprived areas had read in the past year, 49% of adults in the most deprived areas had done so.
Among the five most common types of cultural events or places, all but art and sculpture had been attended by a higher proportion of adults in the least deprived areas.
For those who had not participated in any cultural activities, lack of time was the most common reason (19%).
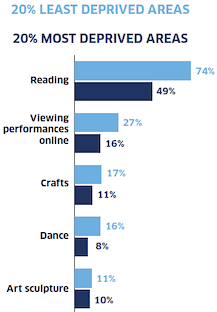
This bar chart lists the most common types of cultural activities in 2019, and shows the proportion of adults participating in them in the most and least deprived areas. In order of how common they were, it lists the following activities: “Reading”, “Viewing performances online”, “Crafts”, “Dance”, and “Art sculpture”. It highlights that while some of these activities were popular in both the most and least deprived areas, participation was generally higher in the least deprived areas.
75% of adults who read books did so at least once per week
Women read more than men – 70% of women said that they had read in the past twelve months, while 54% of men said so
9 in 10 library users were very or fairly satisfied with the service.
Levels of satisfaction amongst library service users have tended to be high since 2007.
However, the satisfaction rate for libraries among all adults (both service users and non-users) had decreased from 55% in 2007 to 42% in 2019.
Satisfaction rates for museums and theatres were also consistently higher among service users.
In 2019, 88% of museum service users were very or fairly satisfied, while this was true for 40% of all adults. Similarly, 89% of those going to the theatre or concert halls were satisfied, while the figure for all adults was 42%.
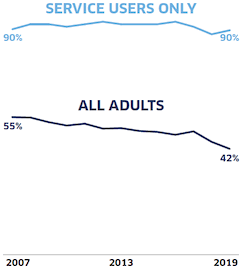
This line graph shows levels of satisfaction with public libraries from 2007 to 2019, differentiating between those using the service and all adults. It highlights that service users consistently had higher satisfaction rates than the adult average, and while the satisfaction rate among all adults had gone down in this period, that was not the case among service users.
While satisfaction with libraries, museums and theatres increased as deprivation decreased when all adults were asked, this difference was not seen among service users
86% of adults either strongly agreed or tended to agree that it was important to them that Scotland’s heritage is well looked after.
69% of adults strongly agreed or tended to agree that the heritage of their local area was well looked after. Around half (46%) of adults in Scotland also strongly agreed or tended to agree that culture and the arts made a positive difference to their lives.
Women were more likely to say that culture and the arts made a positive difference to their lives, with 48% of women strongly agreeing or tending to agree in comparison to 44% of men.
77% of those who said that culture and the arts made a positive difference to their life reported that culture and the arts make them feel happy or are something that they really enjoy.
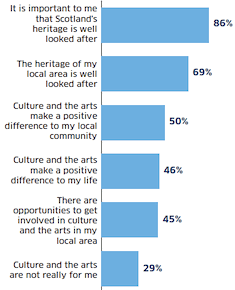
This bar chart shows the proportion of adults agreeing with a set of statements about culture. Starting with the statement the most people agreed with, the following ones were included: “It is important to me that Scotland’s heritage is well looked after” (86%), “The heritage of my local area is well looked after” (69%), “Culture and the arts make a positive difference to my local community” (50%), “Culture and the arts make a positive difference to my life” (46%), “There are opportunities to get involved in culture and the arts in my local area” (45%), and “Culture and the arts are not really for me” (29%).
In the least deprived areas in Scotland, 58% of adults strongly agreed or tended to agree that culture and the arts made a positive difference to their lives
In the 20% most deprived areas, 34% of adults strongly agreed or tended to agree with this
Contact
Email: shs@gov.scot