The Scottish Health Survey 2022 – volume 1: main report
This report presents results for the Scottish Health Survey 2022, providing information on the health and factors relating to health of people living in Scotland.
8 Diet and Obesity
The proportion of children aged 2-15 eating five or more portions of fruit and vegetables a day was higher in 2021 and 2022 than in the rest of the time series, the mean number of portions of fruit and vegetables consumed per day followed the same pattern.
The proportion of children that did not consume any fruit or vegetables increased with age
- Aged 2-4: 4%
- Aged 5-7: 4%
- Aged 8-10: 10%
- Aged 11-12: 11%
- Aged 13-15: 14%
In 2021/2022 there continued to be a decline in the proportion of children consuming tuna fish once a week or more, whilst the proportion of children consuming oily fish or white fish once a week or more increased.
- Tuna fish
- 2008/2009: 32%
- 2021/2022: 22%
- Oily fish
- 2008/2009: 13%
- 2021/2022: 19%
- White fish
- 2008/2009: 48%
- 2021/2022: 52%
Children’s consumption of red meat at least twice a week has declined over time.
- 2008/2009: 57%
- 2021/2022: 51%
Children’s consumption of skimmed or semi- skimmed milk has declined over time.
- 2008/2009: 57%
- 2021/2022: 52%
The linear decline in consumption of biscuits once a day or more continued in 2021/2022.
- 2008/2009: 42%
- 2021/2022: 24%
The greatest change over the time series has occurred in consumption of non-diet soft drinks once a day or more, from 38% in 2008/2009 to 16% in 2017/2018, and to 5% in 2021/2022.
- 2008/2009: 38%
- 2017/2018: 16%
- 2021/2022: 5%
Children’s consumption of at least 2-3 slices of high fibre bread a day has declined over time.
- 2008/2009: 35%
- 2021/2022: 24%
In 2022, the Body Mass Index (BMI) for adults was 28.0, the same as in 2021, and an increase from 27.1kgm-2 in 2003.
- 2003: 27.1
- 2021: 28.0
- 2022: 28.0
In 2022, 32% of all adults had a BMI between 18.5 and 25 kgm-2 - classed in the healthy weight category.
- BMI of 18.5 to less than 25 kgm-2 32%: 32%
Around two-thirds of all adults (67%) were living with overweight (including obesity) in 2022, with a higher prevalence in men than women.
- Men: 70%
- Women: 63%
Those aged 16-24 had a significantly lower prevalence of living with overweight (including obesity) compared with older age groups.
- 16-24: 39%
- 25-34: 59%
- 35-44: 66%
- 45-54: 75%
- 55-64: 75%
- 65-74: 77%
- 75+: 70%
The proportions of adults in the healthy weight category decreased as area deprivation increased, from 39% in the least deprived areas to 28% in the most deprived areas.
- Least deprived: 39%
- 4th: 32%
- 3rd: 30%
- 2nd: 28%
- Most deprived: 28%
Mean adult BMI varied significantly by area deprivation in 2022, increasing from 26.7kgm-2 in the least deprived areas to 29.0 kgm-2 in the most deprived areas.
- Least deprived: 26.7%
- 4th: 27.8%
- 3rd: 28.1%
- 2nd: 28.7%
- Most deprived: 29.0%
In 2022, 64% of children were in the healthy weight category. This was at the same level as in 2021, which was the lowest since the start of the time series in 1998.
One third of children were at risk of overweight (including obesity). This was 5 percentage points higher than in 2021, and the highest level since 2011.
- 2011: 33%
- 2021: 28%
- 2022: 33%
Eleanor Holman & Josephine Wildman
8.1 Introduction
Poor diet is a leading risk factor for ill health internationally[132] and has been linked to a range of poor health outcomes including, dental caries, obesity, type 2 diabetes, cardiovascular disease (CVD), hypertension and certain cancers[133],[134],[135].
Obesity is defined by the World Health Organisation as a disease characterised by excess adiposity. It is a “chronic, relapsing disease resulting from complex interactions between a range of factors, including those that occur at a biological, commercial, social and political level”[136]. Obesity is classified as having a Body Mass Index (BMI) of 30 kg/m2 or more.
Research has shown that more than 1 in 20 adult cancer cases are linked to excess weight in the UK making obesity possibly the second largest preventable cause of cancer[137]. Obesity, independently of diet, has also been linked to a range of health outcomes including type 2 diabetes, CVD and hypertension in addition to cancer[138],[139].
Studies have indicated that there is an association between mental health problems such as depression and anxiety and living with obesity[140],[141],[142]. There is also evidence of a link between living with overweight and obesity in midlife and possible dementia in late life[143],[144],[145]. The evidence also suggests that younger people in the UK are living with a higher BMI at an earlier age and staying at that higher BMI for longer[146]. The longer a person lives with a higher BMI, the greater their risk of developing chronic diseases and some forms of cancer[147]. More recently, evidence suggests that living with excess weight is also associated with an increased risk of serious COVID-19 outcomes[148],[149].
The risk of such conditions can be reduced by improvements in the nutritional content of diets and overall reductions in elevated body mass[150]. Nutritional requirements include the consumption of five 80g portions of fruit and vegetables per day. For children, a portion size will vary in accordance with age, body size and level of physical activity, and approximates the amount that fits into the palm of their hand[151].
8.1.1 Policy background
Eating well, maintaining a healthy weight and regular physical exercise are key public health priorities for Scotland. A Healthier Future: Scotland’s Diet and Healthy Weight Delivery Plan[152], published in July 2018, sets out a vision where everyone eats well and has a healthy weight, working towards five outcomes:
- Children have the best start in life – they eat well and have a healthy weight, including seeking to halve the prevalence of child obesity by 2030.
- A food environment that supports healthier choices.
- People have access to effective weight management services.
- Leaders across all sectors promote healthy weight and diet.
- Diet-related health inequalities are reduced.
These outcomes are supported by a wide range of actions including efforts to address factors such as environmental cues that encourage people to make less healthy choices, including food choices available outside of the home as advocated in the 2021 Out Of Home Action Plan[153]. Tranformation of the food environment is more likely to be effective in improving diet and reducing health inequalities than encouraging behaviour change alone. A Scottish Government commitment to legislation restricting the promotion of less healthy food and drink sold to the public will be informed by a forthcoming consultation on the detail of proposed regulations.
The Delivery Plan is underpinned by the Scottish Dietary Goals[154] and implemented alongside intiatives such as: Eat Well Your Way (a guide to help people plan, prepare and cook healthier food)[155]; the Scottish Grocers' Federation Healthy Living Programme (which supports retailers, predominantly in areas of higher deprivation, to offer and promote healthy choices at the point of sale)[156]; Parent Club (a holistic support package for parents and carers which includes advice on easy, healthy meals and snacks for children)[157]; and the Reformulation For Health Programme (a partnership with the Food and Drink Federation Scotland to encourage small and medium-sized business reformulation to improve the nutritional composition of food products available for purchase)[158].
8.1.2 Reporting on diet and obesity in the Scottish Health Survey (SHeS)
This chapter presents trend data on children’s fruit and vegetable consumption, as well as data for 2022 by age and sex, along with trend data on children’s eating habits for 2008/2009 to 2021/2022. Diet questions for adults were not included in the survey in 2022. In addition, adult and child body mass index (BMI)[159], disaggregated by age and sex, BMI trends, and age-standardised BMI by area deprivation are reported.
The area deprivation data are presented in Scottish Index of Multiple Deprivation (SIMD) quintiles. To ensure that the comparisons presented are not confounded by the different age profiles of the quintiles, the data have been age standardised. For detailed definitions of both SIMD and age-standardisation as well as terminology used in this chapter and for further details on the data collection methods for diet and obesity, please refer to Chapter 2 of the Scottish Health Survey 2022- volume 2: technical report.
Supplementary tables on diet and obesity are also published on the Scottish Government website: Scottish Health Survey.
8.1.3 Comparability with other UK statistics
Adult obesity is defined consistently in the Scottish Health Survey (SHeS) and the other health surveys within the UK using BMI classifications. Sampling methodologies differ between the surveys. Of the four UK health surveys, SHeS and Health Survey for England are the most closely aligned.
8.2 Diet and Obesity
8.2.1 Child fruit and vegetable consumption, 2008 to 2022, by sex
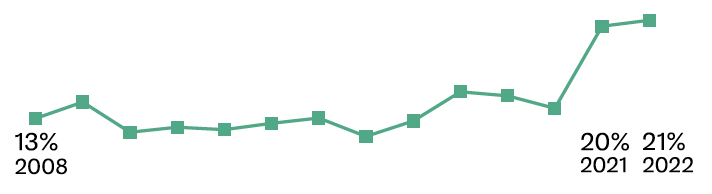
In 2022, the proportion of children aged 2-15 who consumed five or more portions of fruit and vegetables in a day, at 21%, was consistent with consumption in 2021 (20%) and significantly higher than earlier in the time series when it was fairly stable at between 11 and 16%. This pattern was observed for both boys and girls.
In 2022, the proportion of children aged 2-15 consuming no fruit and vegetables on the day before the interview (8%) returned closer to the level seen prior to 2021 (9-11% between 2016 and 2019, compared with 5% in 2021). The increase, between 2021 and 2022, in the proportion eating no fruit and vegetables was true for both boys (from 6% to 9%) and girls (from 5% to 7%).
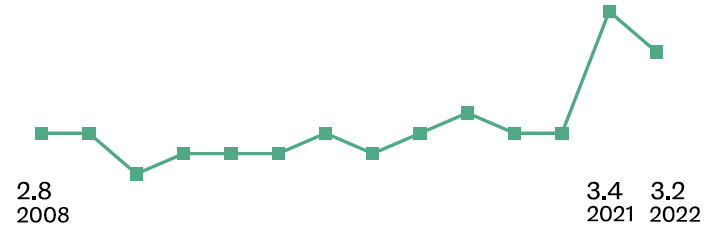
In line with the consistent pattern observed for the proportion of 2-15 year olds eating five or more portions of fruit and vegetables a day, the mean number of portions consumed per day by children aged 2-15 in 2022 (3.2 portions) was consistent with 2021 (3.4) and significantly higher than earlier in the time series (2.6-2.9 portions between 2008 and 2019). This pattern was observed for boys and girls. Table 8.1
8.2.2 Child fruit and vegetable consumption, 2022, by age and sex
In 2022, the proportion of children aged 2-15 consuming five or more portions of fruit or vegetables in a day did not vary significantly by sex or age, with this proportion in the range 18-24% across all age groups.
However, the proportion that did not consume any fruit or vegetables did vary significantly by age, increasing from 4% among children aged 2-7 to 14% among those aged 13-15. This increase was observed for both boys and girls.
The mean number of portions consumed per day also varied by age, increasing from 2.8 portions among those aged 13-15 to 3.6 portions among children aged 2-5. Again, this pattern by age was observed among both boys and girls. Table 8.2
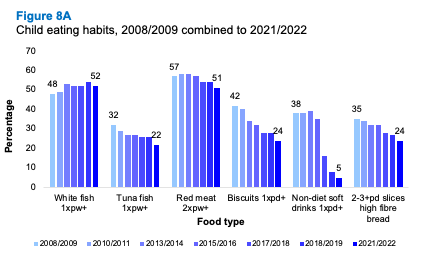
8.2.3 Summary of child eating habits, 2008/2009 to 2021/2022, by sex
While the eating habits of children were broadly consistent between 2008/2009 and 2021/2022, some changes have been observed. In 2021/2022 there continued to be a decline in the consumption of tuna fish once a week or more from 32% in 2008/9 to 22% in 2021/22. This decline was coupled with an increase in consumption of other types of fish since 2008/2009.
Children’s consumption of red meat at least twice a week declined from 57% in 2008/2009 to 51% in 2021/2022, the decline being greater for girls (56% to 46%) than for boys (59% to 55%). Over the same period, consumption of other meat products fluctuated between 38-42%.
In 2021/2022 52% of children aged 2-15 drank skimmed or semi-skimmed milk. This represents a decline from 57% in 2008/2009.
The linear decline in consumption of biscuits once a day or more continued in 2021/2022 (42% in 2008/2009 compared with 24% in 2021/2022). The greatest change over the time series has occurred in consumption of non-diet soft drinks once a day or more, from 38% in 2008/2009 to 16% in 2017/2018, and to 5% in 2021/2022. This decline was observed for both boys and girls.
Almost one-quarter (24%) of children (26% of boys and 23% of girls) consumed at least 2-3 slices of high fibre bread a day in 2021/2022. This proportion has declined from a high of 35% in 2008/2009.
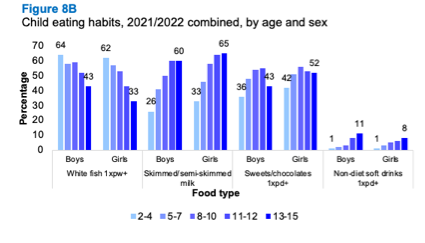
8.2.4 Child eating habits, 2021/2022, by age and sex
Consumption of white fish once a week or more declined linearly from 63% among children aged 2-4 years (boys 64%; girls 62%), to 38% among 13-15 year olds (boys 43%; girls 33%). Across all age groups, consumption was higher among boys than girls (55% compared with 49%, respectively).
Across most age groups (with the exception of those aged 2-4), the proportion of children eating red meat twice or more per week was higher among boys than girls with the largest difference occurring among 8-10 year olds (61% for boys, compared with 45% for girls).
There was an increase in the proportion of children drinking skimmed or semi-skimmed milk by age, from 29% of those aged 2-4, to 63% of those aged 13-15. The proportion of girls drinking skimmed or semi-skimmed milk was higher than for boys across all age groups.
At age 2-4, almost four in ten (39%) children were consuming sweets or chocolates once a day or more, this increased to 55% of those aged 8-10, and decreased to 47% of those aged 13-15. Across most age groups, consumption was higher among girls than boys.
Whereas 1% of children aged 2-4 drank non-diet soft drinks once a day or more, 9% of those aged 13-15 years did so, with boys aged 13-15 most likely to consume such drinks.
Conversely, the consumption of high fibre/low sugar cereal at least 5-6 times a week decreased with age from 39% among 2-4 year olds, to 19% among 13-15 year olds.
Across most age groups, boys were more likely than girls to consume chips twice or more times per week, and potatoes, pasta or rice five or more times per week, and at least 2-3 slices of high fibre bread a day, although differences were not statistically significant.
Patterns of consumption of oily or tuna fish once a week or more did not differ significantly among children by age or sex. Similarly, consumption of cakes twice or more per week did not differ by age or sex, nor did consumption of ice-cream once a week or more.
8.2.5 Adult BMI, 2003 to 2022, by sex
In 2022, the Mean Body Mass Index (BMI) for adults was 28.0kgm-2, the same level as in 2021, and with a small difference between males (27.6) and females (28.1). This level has increased from a mean of 27.1kgm-2 for adults measured in 2003. The proportion of men with a BMI of 25 or more (defined as living with overweight, including obesity) increased from 65% in 2003 to 70% in 2021 and 2022. The proportion of women with a BMI of 25 or more increased from 60% to 63% during the same period. Moreover, the proportions with a BMI of 30 or more (defined as living with obesity) increased between 2003 and 2022 from 22% to 28% of men and from 26% to 30% of women. Table 8.5
8.2.6 Adult BMI, 2022, by age and sex
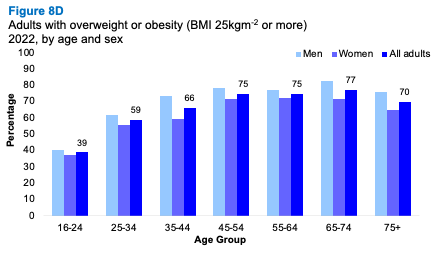
In 2022, 32% of all adults had a BMI of 18.5 to less than 25 kgm-2, classed as a healthy weight, with a higher proportion of women compared with men in this category (36% and 28% respectively). Around two-thirds of all adults were living with overweight, including obesity, in 2022 (67%), with a higher prevalence in men (70%) compared with women (63%). The prevalence of living with obesity did not differ significantly between men and women in 2022 (28% and 30% respectively).
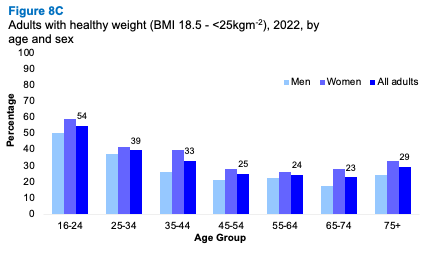
Just over half of adults aged 16-24 were in the healthy weight category (54%), a higher proportion than among other age groups with the prevalence of healthy weight in the range 23-39% among those aged 25 and over. Those aged 16-24 had a significantly lower prevalence of living with overweight (39%) compared with 59-77% among older age groups or obesity (16% compared with 23-39% among older age groups).
There was also a significant variation in mean BMI by age ranging from 25.2 kgm-2 for those aged 16-24 of to between 27.1 - 29.6 kgm-2 among the older age groups.
8.2.7 Adult BMI (age-standardised), 2022, by area deprivation and sex
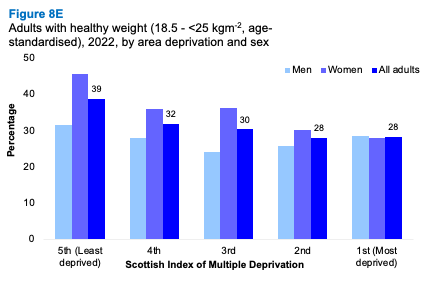
The proportions of adults in the healthy weight category (18.5 to 25 kgm-2) decreased as area deprivation increased, from 39% in the least deprived areas to 28% in the most deprived areas. The pattern among women followed this trend and there was a statistically significant difference between women living in the most and least deprived quintiles. However, among men the proportion decreased from 32% in the least deprived areas to 23% in the mid-deprivation areas, and increased again to 29% in the most deprived areas.
In 2022, the proportion of adults living with overweight or obesity increased as area deprivation increased. The proportion of those in this weight category increased from 59% in the least deprived areas to 70-71% in the two most deprived quintiles and the proportion of adults living with obesity increased from 19% in the least deprived areas to 36% in the most deprived areas.
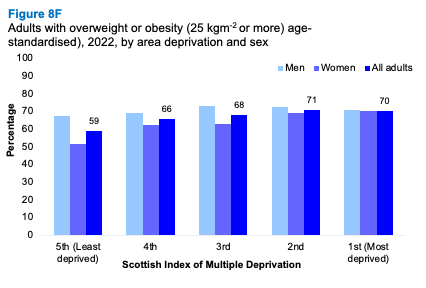
The mean BMI also varied significantly by area deprivation in 2022, increasing from 26.7 kgm-2 in the least deprived areas to 29.0kgm-2 in the most deprived areas.
8.2.8 Child BMI, 1998 to 2022, by sex
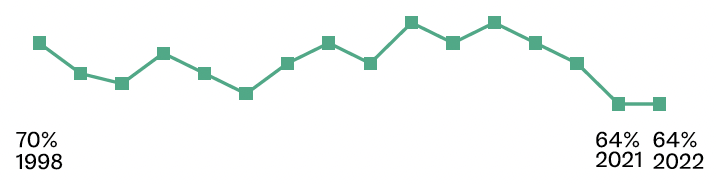
In 2022, 64% of children were in the healthy weight category. This was at the same level as in 2021, which was the lowest in the time series. Just over one third (36%) of children had a weight outside of the healthy range (at risk of underweight, overweight or obesity) in 2022. This was the same as in 2021, which was highest level since the start of the time series in 1998.
One-third (33%) of children were classed as at risk of overweight (including obesity). This was 5 percentage points higher than in 2021, and the highest level since 2011.
Table 8.8
8.2.9 Child BMI, 2022, by age and sex
Prevalence of children at risk of overweight or obesity increased from 29% among those aged 2-6 years to 38% among those aged 12-15, although this difference was not statistically significant. There were no significant differences in the proportion of children in any of the BMI categories by age or sex in 2022.
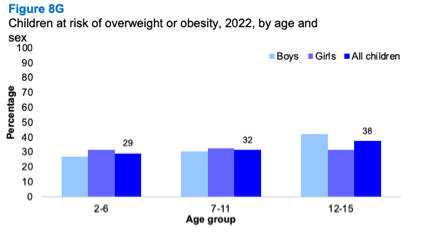
Table list
Table 8.1 Child fruit and vegetable consumption, 2008 to 2022, by sex
Table 8.2 Child fruit and vegetable consumption, 2022, by age and sex
Table 8.3 Summary of child eating habits, 2008/2009 to 2021/2022, by sex
Table 8.4 Child eating habits, 2021/2022, by age and sex
Table 8.5 Adult BMI, 2003 to 2022, by sex
Table 8.6 Adult BMI, 2022, by age and sex
Table 8.7 Adult BMI (age-standardised), 2022, by area deprivation and sex
Table 8.8 Children BMI, 1998 to 2022, by sex
Table 8.9 Children BMI, 2022, by age and sex