Shortage occupation list 2020: call for evidence - our response
Our response to the UK Migration Advisory Committee call for evidence on the shortage occupation list.
Recruitment, Earnings and Skills
58. EU and non-UK nationals are making a vital contribution to Scotland's economy. They are driving our population growth and ensuring that we have workers to meet the needs of business and the public sector. In 2018 there were 198,000 non-UK workers in Scotland, 141,000 of which were EU nationals, across low, medium and high skilled jobs.
59. The vast majority of EU citizens in Scotland are of working age (78.2%) and in employment (81.2%).[18] Indeed the employment rate for 16-64 years was the highest for EU nationals at 81.2%, versus 74.5% for the UK. Many are also highly educated - more than a third (38.4%) have a degree level qualification, compared to 28.7% of UK citizens in Scotland.[19]
60. Migrant workers in the UK also contribute on average more to the economy than their UK equivalents in terms of hours; the average EU-15 and EU-10 employee works around 5% more than their UK-born equivalent.[20]
61. The Employer Skills Survey (ESS) 2017 found one in five employers (19%) employed at least one member of staff from an EU (non UK) member state. The survey results suggest 7% of the Scottish workforce in establishments with two or more staff were non-UK EU nationals.[21]
62. Ensuring ongoing access to labour from across the EU through free movement is of fundamental concern to many businesses across the Scottish economy, as highlighted in our paper Brexit: What's at Stake for Businesses.[22] Businesses have repeatedly told us how they worry that any restriction on the free movement of EU labour could negatively affect their businesses, especially if it were to involve new administrative or bureaucratic requirements that would impose financial and/or other costs.
63. For many smaller businesses, in particular, such restrictions make the recruitment of essential staff impossible. By applying the same restrictive rules to EEA migrants the UK Government are removing another valuable source of labour from smaller businesses and adding significant cost and bureaucracy to recruitment for all businesses.
64. There are concerns that negative rhetoric in the UK against migration may already be having an impact both on the willingness of individuals already in Scotland to stay, and on those who may be interested in moving to Scotland. The Scottish Government is committed to making it clear that we welcome those who make a positive contribution to Scotland and we have developed and run our We Are Scotland[23] campaign on social media to emphasise our positive position on migration. However, we know that some employers are already seeing a downturn in recruitment from the EU.
65. There are particular sectors, regions and occupations that have higher than average (> 6%) concentrations of EU nationals - leaving them particularly vulnerable to the impact of Brexit.[24] Sectors, regions, and occupations with existing skills challenges are likely to see shortages and gaps exacerbated by a decrease in the availability of EU labour.[25]
Source: Annual Population Survey (Jan18-Dec18)
** Estimates suppressed
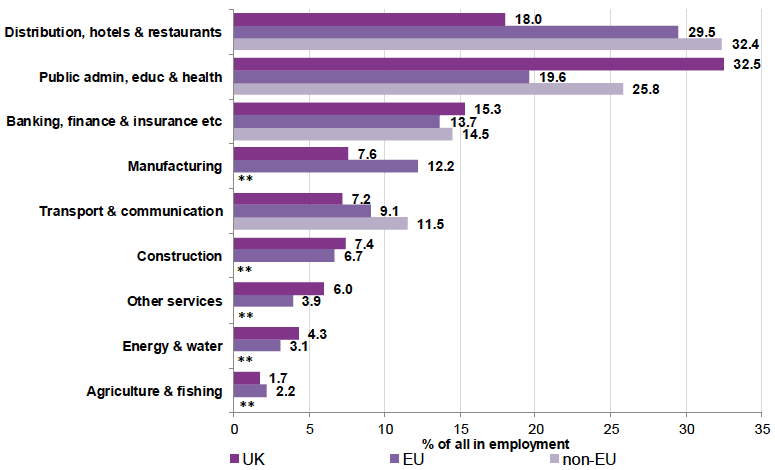
Employment of non-UK nationals in Scotland
66. Nearly two-thirds of all EU nationals in employment in Scotland worked in the distribution, hotels and restaurants, public administration, education and health and banking, finance and insurance industry sectors. For non-EU nationals, the proportion was even higher with nearly three-quarters of total employment concentrated in these three sectors (see Figure 1).
67. As Figure 1 shows, of the 42,000 EU nationals employed in the distribution, Hotel and restaurants sector (29.5% of all EU nationals employment), 14,000 were employed in food and beverage service activities and 8,000 in accommodation. There were 18,000 non-EU nationals employed in the distribution, hotels and restaurants sector, 32.4% of all non EU nationals in employment.
68. There were 28,000 EU nationals employed in the public administration, education and health sector (19.6% of all EU nationals employment) and an additional 15,000 non-EU nationals (25.8% of all non-EU nationals employment).
69. 19,000 EU nationals employed in the banking, finance and insurance sector, 13.7% of all EU nationals in employment in Scotland. A further 8,000 non-EU nationals were employed in this sector, 14.5% of all non-EU nationals in employment.
70. Health and social care employs an estimated 16,000 non-UK EU nationals, 11.2% of all EU nationals in employment. EU nationals represent 3.9% of all employment in this sector. A further 10,000 non-EU nationals were employed in this sector, 18.4% of all non-EU nationals in employment and 2.6% of all employment in this sector.[26]
71. Education (includes primary, higher and secondary education) employs 7,000 EU nationals, 5.3% of all EU nationals in employment and 3.3% of all employment in this sector. There are an additional 3,000 non-EU nationals employed in the Education sector, 5.7% of all non EU nationals in employment and 1.4% of all in employment in this sector.[27]
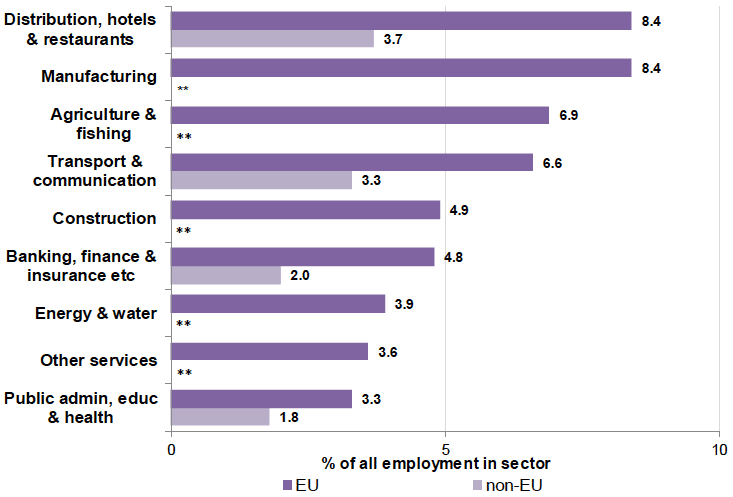
Concentration of non-UK nationals by industry
72. While non-UK nationals (aged 16 and over) account for 7.5% of all employment in Scotland, there is greater representation in some industry sectors than others (see Figure 2).
Source: Annual Population Survey (Jan18-Dec18)
** Estimates suppressed
73. The industry sectors which show the greatest reliance on non-UK workers are distribution, hotels and restaurants (12.0% of workers have non-UK nationalities), transport and communication (9.9%) and manufacturing (9.7%) (see Figure 2 above).
Employment of non-UK nationals in growth sector
74. Tourism: There were 30,000 non-UK Nationals (21,000 EU Nationals and 9,000 non EU Nationals) employed in tourism, 16.5% of all employment in the sector. 14.8% of all EU nationals in employment work in tourism, which corresponds to 11.5% of the workforce in that sector. For non-EU nationals, 16.2% of all those in employment work in tourism, which is 5.0% of this sector's workforce.
75. Finance and business services: There were 10,000 non-UK Nationals (6,000 EU Nationals and 4,000 non EU Nationals) employed in finance and business services, 5.3% of all employment in the sector. 4.2% of all EU nationals in employment work in finance and business services, a 3.2% share of the workforce in this sector. 7.2% of non EU nationals in employment work in this sector, which is 2.2% of the workforce.[28]
76. Creative industries: There were 9,000 EU Nationals employed in creative industries, which is 6.5% of all EU Nationals in employment and 7.2% of all employment in the sector.[29]
77. Food and drink: There were 11,000 EU Nationals employed in food and drink, 14.0% of all employment in the sector. 8.0% of all EU nationals in employment work in the Food and drink sector. The food processing sector (which includes the processing of fish and meat) employs 8,000 EU nationals, 29.1% of its workforce.[30]
78. Life sciences: There were 3,000 EU Nationals employed in life sciences, 12.4% this sector's workforce. 2.2% of all EU nationals in employment work in this sector.[31]
79. Energy: There were 4,000 EU Nationals employed in energy, 3.5% of all employment in this growth sector. 2.8% of all EU nationals in employment work in the energy sector.[32]
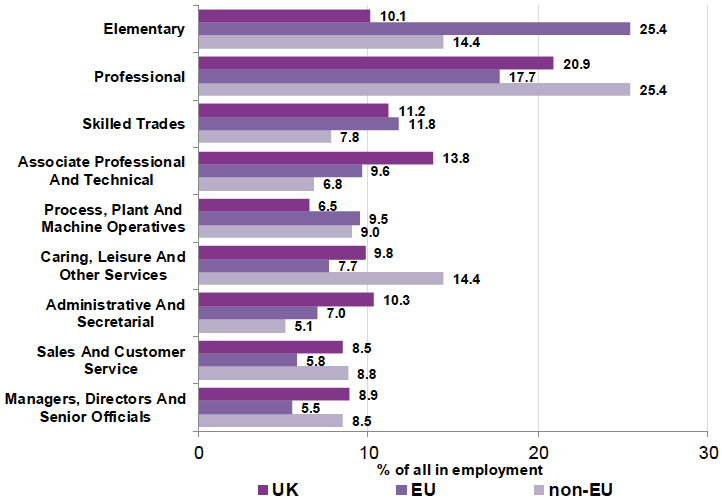
Employment by occupation
80. The highest number of EU nationals (36,000) were employed in elementary occupations, followed by professional occupations (25,000) and skilled trades (17,000).
81. Figure 3 compares the proportions of UK, EU and non-EU employees within each major occupational group.
- 25.4% of all EU nationals in employment worked in elementary occupations (which includes cleaners, hospital porters and labourers). This compares with 14.4% of non-EU nationals and 10.1% of UK nationals.
- For non-EU nationals, 25.4% were employed in professional occupations (including IT, teaching and health professions) while 20.9% of UK nationals and 17.7% of non-EU nationals were employed in this occupational Group.
Source: Annual Population Survey (Jan18-Dec18)
Health and Social Care
82. Health and social care as a whole is a sector widely recognised to be at significant risk due to the impacts of Brexit, both in terms of workforce and disruption to supply lines of medicines and other medical supplies. It is included here as an example of an area heavily reliant on EU, and a wider international, workforce.
83. The health and social care workforce in Scotland benefits enormously from the contribution made by staff from across the European Union. Evidence from the European Commission EC Regulated professions database (97 - 2016)[33] demonstrates that in this period, across the whole EU, 72,314 doctors applied to work elsewhere within the EU, of which 24,945 came to the UK. The equivalent proportion for nursing was equally high with 73,067 nurses moving within Europe, of which 34,678 came to the UK.
84. Robust estimates of the contribution of EU-nationals to the social services workforce indicate that 5.5% of adult social care staff in Scotland are from other EU countries.[34] However, Scottish Care believe that the proportion of non-UK EEA workers is likely to be significantly greater in some areas.
85. 17% of all doctors currently practising in Scotland have a primary medical qualification from out-with the UK (4,331/25,541) with 5.7% from the EEA (4,456/25,541).[35]
86. Within the UK Nursing and Midwifery workforce, 15.2% of staff are registered outside of the UK. This includes 4.4% registered in EEA countries, and 11.8% international nursing and midwifery graduates.[36]
87. The Nursing and Midwifery Council report that the number of people from the EEA on our register decreased by 1,650 (4.99%) between March 2019 and March 2020. The numbers of Nurses joining the UK register for the first time from the EEA are down more than 90% between 2015/16 and 2019/20.[37]
Skills Shortages
88. Since the decommissioning of the Department for Education's biannual ESS in 2017, there has been no UK-wide survey or research on skills or sector shortages.
89. However, considering this data, the 2017 ESS, one in five employers (19%) hired at least one member from an EU (Non UK) member state, and that 7% of the Scottish workforce in establishments with two or more staff were non-UK EU nationals.
90. Indeed in the two years preceding the survey, national-level skills gaps, shortages and under-utilisation either sustained or modestly increased, and these challenges, along with wider recruitment difficulties, are likely to be a permanent feature of the Scottish labour market. While we do not have data for this, we may consider this trend to have continued to increase.
91. Of 75,000 reported vacancies in the sample for Scotland (a proportion of 3.1% of all employment in Scotland), 18,000 or 24% were skills-shortage vacancies (hard to fill because applicants lacked the relevant skills, qualifications or experience).
92. According to the ESS 2017, the sectors with the highest density skills gaps in 2017 were:
- Manufacturing (7.2%);
- Hotels and restaurants (6.8%);
- Wholesale and Retail (6.8).
93. The sectors with the highest density of skills under-utilisation were:
- Hotels + restaurants (17%);
- Information + Communications (24%);
- Arts and Other (14%).
94. The sectors with the highest density of Skills Shortage Vacancies (SSVs) were:
- Business Services (37%);
- Financial Services (34%);
- Construction (34%).
95. The survey also highlighted:
- A steep rise in vacancy levels among employers in Scotland from 54,000 to 74,000 between 2013-2015, a modest increase to 75,000 in 2017, maintaining the relatively high demand for labour;
- The proportion of establishments in Scotland with skills shortage vacancies was sustained at 6% between 2015-2017;
- The proportion of establishments reporting skills gaps in Scotland has risen from 14% to 16% between 2015-2017.
96. 89% of employers who tried to recruit non-UK nationals to 'hard to fill' vacancies and 93% of those trying to fill skills gaps looked to EU nationals. And unless these roles appear on the SOL, and indeed even if they do but cannot meet the salary, the UK Government's future Immigration System effectively removes this as a route for employers: requiring them to go through the Tier 2 route with associated costs and complications of becoming a registered employer. There is a clear and very active risk that Scottish businesses will struggle to recruit the necessary skills with damage to the Scottish economy as a result: an economy that is facing the double damage of both Brexit and the COVID-19 crisis.
97. As highlighted elsewhere, the ESS similarly found regions of Scotland face different levels of shortages as well as varying levels of density:
- The regions with the highest incidences of Skills Shortage Vacancies were West Lothian, Forth Valley and West (all 9%), followed by Glasgow (8%).
- West Lothian, Forth Valley and Ayrshire are those areas with the highest density of Skills Shortage Vacancies, with 38%, 35% and 33% density respectively.
- West Lothian saw the highest incidence of skills gaps, followed by Fife and West.
- West also sees the highest density of skills gaps (6.7%), followed by West Lothian (6.2%) and the Highlands and Islands (6.1%).
98. It should be noted that, although the number of shortages and the density of these shortages is concentrated in the urban centres, shortages in rural areas can disproportionately affect communities.
99. Future jobs growth in Scotland is expected to be driven by Edinburgh and Glasgow cities. These two regions are expected to account for 83% of the net additional jobs in Scotland to 2027. Prospects for the major employment centres are positive, yet a number of areas face the likelihood of very low levels of employment growth. These areas also face the possibility of further population loss, exacerbating historic demographic challenges.
100. ONS estimate that in March 2018 there were 151,200 establishments in Scotland employing over 2.4 million people between them. This is made up predominately of small establishments as nearly three-quarters (73%) of employers have fewer than 10 staff. Employers with only 2 to 4 staff made up 50% of establishments but employed only 8% of the workforce.
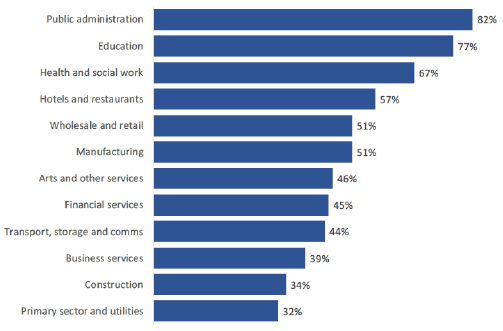
101. 48% of employers reported at least one vacancy in the previous 12 months, with 43% recruiting staff. Public administration had the highest proportion of establishments with vacancies at 82%; primary sector and utilities the lowers (32%).
Post-Brexit Shortages
102. From 1 January 2021 the end of free movement will restrict a crucial supply of labour for Scotland the rest of the UK.
103. The EAG researched shortages that are likely to arrive post-Brexit as a result. This considered the sectors and occupations in Scotland that particularly rely on EU/non-UK workers, and the different income thresholds (£30k, £27.5, £25). An update report has been published which considers the new threshold of £25,600. Notably, the EAG retain their estimate of a reduction in net migration of between 30 and 50%, even at this new threshold.
104. Certain sectors are more dependent on migrant labour. The figure below shows employment shares across sectors in Scotland by country of birth and industry, and shows how this is distributed between the EU-15, EU-10 and other non-EU countries.
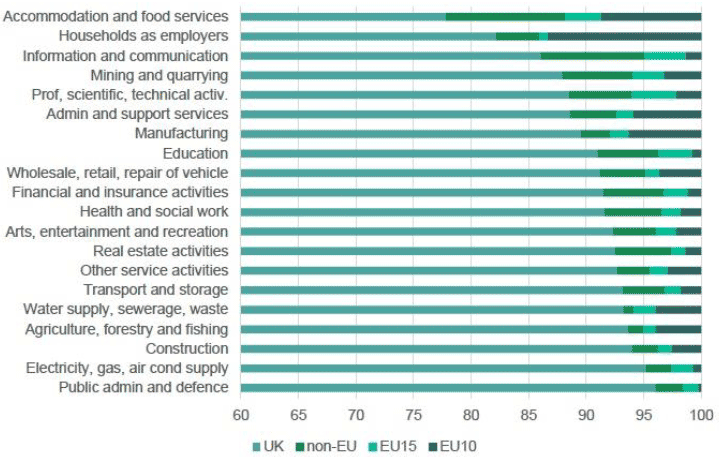
Source: ONS Annual Population Survey 2013-2017
105. Accommodation and food services (hotels and restaurants) are most dependent on migrants, with almost 22% of the workforce born outside the UK (and at least half of whom from the EU). These services form the main component of the tourism sector, which contributes around £6 billion to Scottish GDP.
106. Many other sectors similarly depend on migrant workers, such as IT and communication; admin and support services; manufacturing; mining; and professional, scientific and technical activities. The percentage of those born in the EU significantly exceeds that of those born outside the EU. Exceptions are sectors requiring advanced qualifications - education, finance and health - where the share is similar or with slightly more non-EU nationals.
107. Further detail of the dependency on migrant labour is captured by Figure 5 below, providing a breakdown of industries in Scotland with more than 10% of their employees born outside the UK. This disaggregation highlights the key role played by EU-10 workers in manufacturing food, leather products, etc. It also highlights the dependency of scientific research and computer programming on migrants from the EU-15 countries.
108. Many of these also have high levels of key workers supporting Scotland's economy and communities during the COVID-19 crisis.
Source: ONS Annual Population Survey 2013-2017
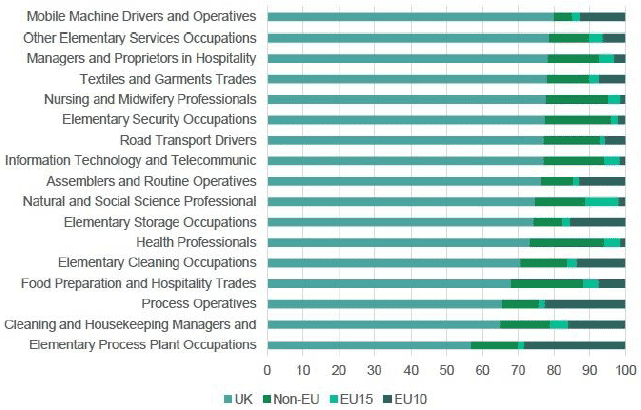
109. The distribution of migrants by occupation indicates where shortages may appear in the Scottish labour market should the numbers of migrants in future be reduced. Figure 6 below shows those occupations where more than 20% of the workforce was born outside of the UK.
Source: ONS Annual Population Survey 2013-2017
110. The majority of these professions are not classed as high-skilled but low or medium; the exception being health professions, science and IT. In the 'lower' skilled occupations, migrants from EU-10 play an even greater role: most likely because international migrants at this skill level are not eligible for a visa, whereas Scotland has benefitted from EU workers through free movement.
Tier 2 skills and income thresholds
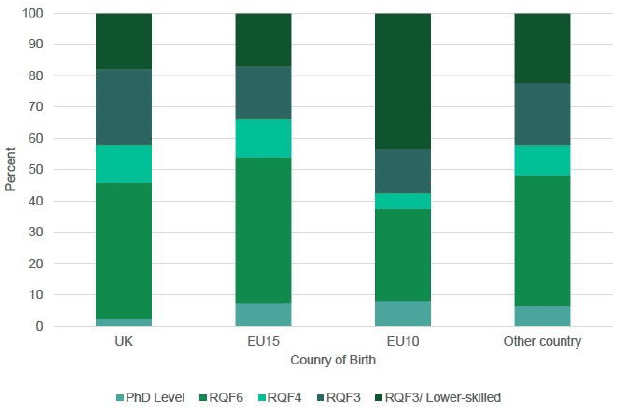
111. Distribution of RQF levels in Scotland by country of birth is shown in Figure 7 below.
112. Those born outside the UK are more concentrated at the extremes of the qualification distribution: for example, the proportion of those born in the EU who hold a PhD is more than three times the equivalent UK share. Migrants at this skill level will be eligible for the future system.
113. The proportion of unskilled labour from the EU-10 countries is more than double the UK proportion. This implies that there are likely to be fewer migrants in the middle of the income distribution than there are UK-born. It is this 'low-skilled' labour from the EU-10 countries where the impact of ending free movement will be most acute.
Source: ONS Labour Force Survey 2013-2017
114. Table 1 shows estimated annual earnings in Scotland by country of birth and level of qualification based on the LFS 2013-2017 dataset. Consistent with the argument above, the range of earnings is wider for those born outside the UK. For example, median earnings for those born in the EU-15 with PhD level qualifications exceed £54,200 while their "low-skilled" counterparts earn only £14,100. These compare with £35,200 and £18,100 for equivalent levels of skill among the UK-born workforce.
| PhD | RQF6 | RQF4 | RQF3 | Lower-skilled | All | |
|---|---|---|---|---|---|---|
| UK | £35,200 | £34,400 | £25,600 | £23,100 | £18,100 | £14,500 |
| EU-15 | £54,200 | £30,100 | £22,900 | £24,100 | £14,100 | £16,900 |
| EU-10 | £40,200 | £31,700 | N/A | £18,300 | £13,300 | £14,600 |
| Non-EU | £35,100 | £32,700 | £23,100 | £22,600 | £15,700 | £14,100 |
| All | £35,200 | £34,200 | £25,300 | £23,100 | £17,600 | £14,500 |
Source: ONS Labour Force Survey 2013-2017
Effects on different sectors
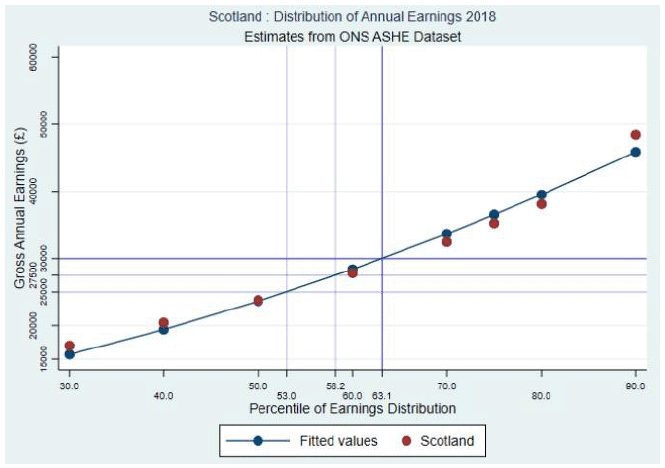
115. The EAG identified the types of work and worker likely to be most affected by the proposed restrictions on EU migration by analysing the distribution of annual earnings in Scotland for different groups within the workforce. While this analysis focused on the previous threshold of £30,000, they also considered the lower thresholds of £27,500 and £25,000. In these cases, 58% and 53% of Scottish employees earn less than £27,500 and £25,000 respectively as demonstrated in Figure 8.
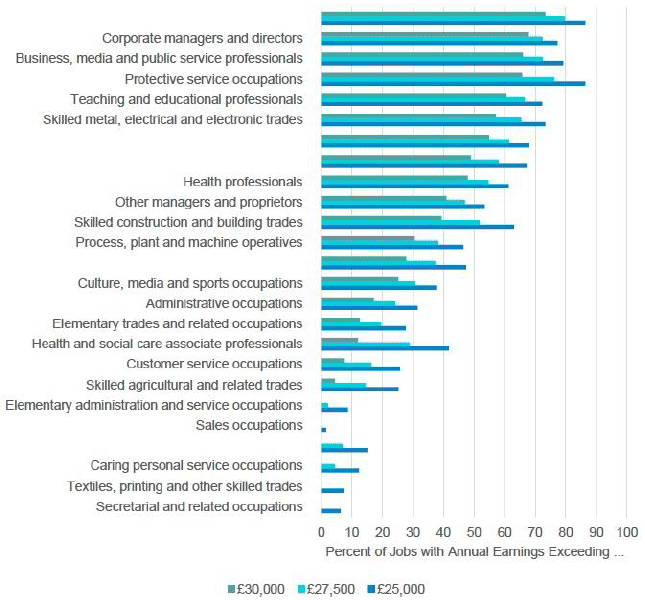
116. For a more detailed analysis, we first analyse the distribution of earnings by occupation. Figure 9 shows the proportion of jobs in broad occupational groups where annual earnings exceed thresholds again set at £30,000, £27,500 and £25,000. The results show that over 70% of jobs in science, research, engineering and technology have earnings exceeding the £30,000 threshold. However, even at a threshold of £25,000, it is unlikely that any jobs in secretarial work, textiles, social care, leisure and travel, sales and elementary occupations would qualify, effectively barring non-UK migrants from these occupations.
Source: ONS ASHE 2018
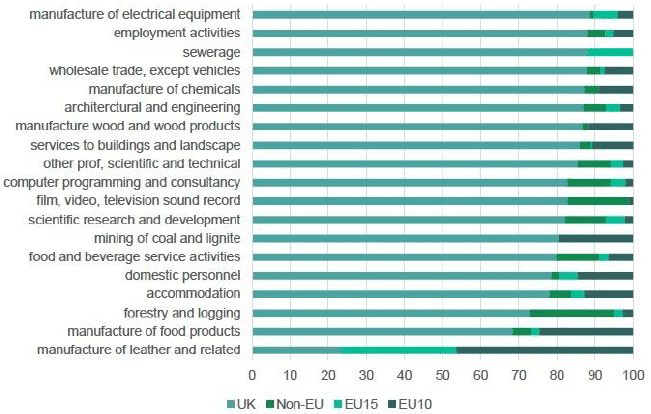
Source: ONS Annual Survey of Hours and Earnings (ASHE) 2018
117. These calculations include both UK-born and non-UK born workers in Scotland, since the ASHE dataset does not record country of birth. There is considerable overlap between low-wage occupations and occupations which employ a large share of migrant workers. For example, earnings in cleaning, processing and hospitality are typically low: they also employ a relatively large share of EU-10 workers. Recruitment to these occupations, particularly where turnover is high, is likely to be challenging.
118. Scottish employers may respond to labour shortages by increasing investment, enhancing the skill levels of existing employees, more active recruiting of UK-born workers and/or increasing wage rates. Almost all of these courses of action would lead to increased costs. These may be passed on to consumers if market conditions permit. If they cannot be passed on, profitability will suffer. Given the current economic situation as a result of the pandemic the position of many businesses is likely to be particularly fragile.
119. Considering that employers and businesses in Scotland (and the rest of the UK) are understandably focused on the impacts of COVID-19 as well as the end of the Brexit transition period, these increased costs and criteria will cause even more difficulty in recruiting international workers.
The cases of social care and seasonal agriculture
Social Care
120. The care sector in Scotland currently faces many challenges, including a significant demand for suitable workers. This is evidenced by a Scottish Care employer survey from 2018, which indicated that 77% of care homes were having recruitment difficulties. There were staff vacancies of around 20% in nursing posts in care homes.[38]
121. EU workers make up a significant proportion of Scotland's care workforce. Our estimate from the LFS is that since 2015, around 9.1% of the workforce were born outside the UK, with 38.5% of these coming from the EU. This estimate is lower than that of Care Scotland: the LFS estimate may be biased downwards if its postcode-based sampling frame fails to adequately capture the addresses of migrant workers. Care Scotland reports that EU workers have been a particular target for recruitment to the sector in recent years, although recruitment difficulties have been recently experienced due to the negative perception of Brexit.
122. As shown in Figure 9, the 2018 ASHE data suggests that less than 10% of those working in "Caring and personal service occupations" in Scotland earn £25,000. Under current immigration policy, the majority of care workers are classed as "low- skilled",[39] and therefore would not qualify under the proposal to extend the skilled route for migrants to RQF 3.[40]
Seasonal Agricultural Workers
123. Employers of seasonal agricultural workers in Scotland will face additional challenges if the supply of migrant workers is significantly constrained. Around 9,300 seasonal workers were engaged in Scottish agriculture in 2017.[41] They were particularly concentrated in fruit production. This sector has been an important source of growth within Scottish agriculture in recent years. The value of its output grew to almost £140 million in 2017, while the volume of production has more than tripled since 2003. Food production in general has been growing more rapidly in Scotland than in the rest of the UK.
124. A survey of the sector indicated that labour shortages were evident in 2017, with 48% of respondents indicating that they had difficulty harvesting due to labour shortages.[42] Without access to sufficient seasonal labour, 58% of respondents were 'likely' or 'very likely' to downsize their business, while 42% would cease their current activity.
Implications for Migration to Scotland
125. The EAG have updated their report to consider the new proposed threshold of £25,600, and the eligibility of migrants to access specific occupations following this reduction. Table 2 shows the effects of the reduction in the threshold on broad occupations within the Scottish labour market.
| Threshold | ||
|---|---|---|
| £30,000 | £25,600 | |
| Protective service occupations | 14.8 | 0 |
| Science, research, engineering and technology professionals | 23.6 | 13.4 |
| Business, media and public service professionals | 31.7 | 21.6 |
| Corporate managers and directors | 30.3 | 22.5 |
| Teaching and educational professionals | 36.2 | 25.7 |
| Managers, directors and senior officials | 34.2 | 25.9 |
| Skilled metal, electrical and electronic trades | 39.3 | 26.4 |
| Professional occupations | 41 | 30.1 |
| Science, engineering, technology and associated professionals | 48.6 | 34.3 |
| Business, public service and associated professionals | 47.1 | 35.2 |
| Other managers and proprietors | 49 | 37.2 |
| Health professionals | 48.8 | 37.5 |
| Associated professional technical occupations | 49.5 | 37.7 |
| Skilled construction and building trades | 61.4 | 39 |
| Skilled trades occupations | 58.1 | 44.6 |
| Transport, mobile machine drivers and operators | 68.1 | 51.2 |
| Process plant machine operators | 68.5 | 53.3 |
| Process plant machine operators 2 | 68.7 | 55.7 |
| Health and social care associated professionals | 79.4 | 59 |
| Culture, media and sports occupations | 78 | 62.4 |
| Administrative occupations | 81.6 | 68.9 |
| Administrative and secretarial occupations | 84.2 | 71.5 |
| Customer service occupations | 100 | 77.9 |
| Leisure and travel related personal service occupations | 100 | 88.3 |
| Elementary occupations | 100 | 88.5 |
| Caring, leisure and other service occupations | 100 | 88.9 |
| Sales customer service occupations | 100 | 89.6 |
| Secretarial related occupations | 100 | 90.7 |
| Caring personal service occupations | 100 | 90.9 |
| Skilled agricultural related trades | 100 | 91.2 |
| Elementary administration service occupations | 100 | 91.8 |
| Sales occupations | 100 | 97.4 |
126. The occupations are arranged in order of decreasing eligibility for potential migrants, with associated figures describing the proportion of jobs that fall below the proposed thresholds. Clearly, a large proportion of jobs in protective service, science research and engineering, media and management would be available to migrants. In contrast, very few jobs in agriculture, caring, office and customer related occupations would be eligible.
127. Nevertheless, the reduction in the salary threshold would allow migrants to be eligible for a small proportion of jobs in these sectors. Thus, for example, whereas under a £30,000 threshold no jobs in customer services, leisure and elementary occupations would be available to migrants, a small proportion of such jobs would qualify under the lower threshold.
128. We have drawn out some more detailed evidence on the contribution of EU citizens to key sectors, but the following trends in the evidence are illustrative of the Scottish economy as a whole. Workers from other EU countries make a vital contribution to the Scottish economy and the continued availability of such workers is vital to employers in all sectors, right across Scotland. Employers value the ability to recruit the right workers, with the right skills and experience quickly and easily. They are deeply concerned by the proposals to end free movement as this will limit or curtail the supply of the workers they need, make the process of recruitment too burdensome and complicated (especially for smaller businesses) and mean that EU workers no longer see the EU as a desirable destination.
129. The evidence also highlights the role played by EU citizens in sectors vital to the rural economy, namely agriculture, fisheries, and agricultural processing, and highlights shortages in the public sector in education and early learning and childcare, and finally the significant impact on the health and social care sector.
130. The SOL currently relates to non EU/EEA migration, however, the government's proposals for a single work based migration route mean that in future these sectors currently reliant on EU/EEA staff will in future need to look to the skilled worker route (Tier 2) and the SOL.
Base population: 2,652
Skill Levels of EU workers
131. In 2018 there were 198,000 non-UK born workers in Scotland, 141,000 of which were EU nationals, employed across low, medium and high skilled jobs. The vast majority of EU citizens in Scotland are of working age (78.2%), and over three-quarters are in employment (81.2%). Many are also highly educated - more than a third (38.4%) have a degree level qualification, compared to 28.7% of UK citizens in Scotland.
Earnings and Non-UK Nationals Employment for All Major Occupations Scotland and the UK
| Major Occupation Group | Code | Number of jobsb(thousand) | Median | Annual percentage change | Mean | Annual percentage change | Percentiles | Number of non-UK nationals in employment (16 years and above)2 | |
|---|---|---|---|---|---|---|---|---|---|
| 25 | 75 | ||||||||
| Scotland | |||||||||
| Managers, directors and senior officials | 1 | 167 | 42,381 | 4.7 | 51,122 | 1.5 | 29,462 | 61,742 | 13000 |
| Professional occupations | 2 | 366 | 37,663 | 3.8 | 42,769 | -0.1 | 30,819 | 47,817 | 39000 |
| Associate professional and technical occupations | 3 | 230 | 32,076 | 1.9 | 36,962 | -0.3 | 25,571 | 41,175 | 17000 |
| Administrative and secretarial occupations | 4 | 132 | 22,899 | 1.0 | 25,683 | -0.6 | 19,218 | 29,120 | 13000 |
| Skilled trades occupations | 5 | 143 | 28,530 | 3.2 | 30,437 | 3.8 | 22,050 | 36,298 | 21000 |
| Caring, leisure and other service occupations | 6 | 98 | 20,725 | -0.1 | 21,822 | -0.2 | 17,259 | 24,888 | 19000 |
| Sales and customer service occupations | 7 | 72 | 20,240 | 3.7 | 22,242 | 1.2 | 17,169 | 25,272 | 13000 |
| Process, plant and machine operatives | 8 | 94 | 25,052 | -3.5 | 27,225 | -0.4 | 20,059 | 32,723 | 19000 |
| Elementary occupations | 9 | 94 | 20,060 | 1.6 | 21,247 | 1.7 | 16,655 | 25,591 | 44000 |
| United Kingdom | |||||||||
| Managers, directors and senior officials | 1 | 2,182 | 44,597 | 2.1 | 61,610 | 1.6 | 30,097 | 69,869 | |
| Professional occupations | 2 | 4,010 | 39,384 | 2.3 | 44,367 | 0.7 | 30,928 | 50,584 | |
| Associate professional and technical occupations | 3 | 2,826 | 33,051 | 0.9 | 39,171 | -0.6 | 25,581 | 43,722 | |
| Administrative and secretarial occupations | 4 | 1,608 | 23,487 | 2.2 | 26,852 | 3.9 | 19,180 | 30,224 | |
| Skilled trades occupations | 5 | 1,503 | 28,273 | 3.4 | 30,133 | 2.9 | 21,782 | 35,965 | |
| Caring, leisure and other service occupations | 6 | 1,041 | 19,385 | 4.4 | 20,489 | 4.7 | 16,041 | 23,805 | |
| Sales and customer service occupations | 7 | 792 | 20,402 | 2.4 | 22,828 | 3.9 | 16,900 | 25,887 | |
| Process, plant and machine operatives | 8 | 1,118 | 25,751 | 2.2 | 27,805 | 3.1 | 20,448 | 33,068 | |
| Elementary occupations | 9 | 1,138 | 20,579 | 3.7 | 21,976 | 3.9 | 17,110 | 25,985 | |
Source: ASHE 2019 (Estimates in bold are considered reasonably precise, all other estimates are considered precise).
https://www.ons.gov.uk/employmentandlabourmarket/peopleinwork/earningsandworkinghours/datasets/regionbyoccupation4digitsoc2010ashetable15
2. Annual Population Survey 2018 (Jan-Dec), In total 198,000 non-UK Nationals were in employment. Employment is all employment (full-time and part-time)
https://www2.gov.scot/Topics/Statistics/Browse/Labour-Market/Publications-Topical/NonUKNatJD18 Major Occupation Group SOC 2010
| Description | Number of jobsb (thousand) | Median | Annual percentage change | Mean | Annual percentage change | Percentiles | |||||||||
|---|---|---|---|---|---|---|---|---|---|---|---|---|---|---|---|
| 10 | 20 | 25 | 30 | 40 | 60 | 70 | 75 | 80 | 90 | ||||||
| United Kingdom | 16,216 | 30,353 | 2.7 | 37,428 | 2.3 | 17,189 | 20,327 | 21,870 | 23,483 | 26,698 | 34,583 | 39,591 | 42,642 | 46,485 | 60,890 |
| North East | 615 | 27,187 | 3.2 | 31,852 | 2.4 | 16,627 | 19,137 | 20,356 | 21,608 | 24,308 | 30,682 | 34,972 | 37,380 | 40,231 | 49,967 |
| North West | 1,771 | 28,137 | 2.8 | 33,479 | 2.4 | 16,573 | 19,273 | 20,609 | 21,895 | 24,895 | 32,019 | 36,844 | 39,693 | 43,041 | 53,513 |
| Yorkshire and The Humber | 1,277 | 27,835 | 3.5 | 32,653 | 2.9 | 16,521 | 19,294 | 20,541 | 21,949 | 24,634 | 31,322 | 35,823 | 38,125 | 41,613 | 51,615 |
| East Midlands | 1,113 | 28,000 | 4.8 | 32,639 | 3.4 | 16,477 | 19,210 | 20,508 | 21,848 | 24,760 | 31,560 | 35,962 | 38,833 | 41,884 | 52,507 |
| West Midlands | 1,340 | 28,536 | 3.1 | 34,247 | 3.6 | 16,597 | 19,517 | 20,955 | 22,503 | 25,459 | 32,477 | 37,345 | 40,043 | 43,481 | 54,339 |
| East | 1,399 | 30,345 | 4.1 | 36,143 | 3.4 | 17,212 | 20,475 | 22,072 | 23,705 | 27,000 | 34,348 | 39,198 | 42,127 | 45,940 | 59,929 |
| London | 2,595 | 38,992 | 2.2 | 53,100 | 0.9 | 20,000 | 25,000 | 27,299 | 29,544 | 34,145 | 44,624 | 52,526 | 58,082 | 65,478 | 93,870 |
| South East | 2,207 | 32,120 | 4.1 | 38,715 | 4.6 | 17,669 | 21,168 | 23,049 | 24,820 | 28,220 | 36,438 | 41,888 | 45,123 | 49,477 | 64,515 |
| South West | 1,289 | 28,654 | 2.5 | 33,543 | 2.1 | 16,869 | 19,791 | 21,099 | 22,513 | 25,436 | 32,148 | 36,540 | 39,607 | 42,451 | 53,659 |
| Wales | 702 | 27,500 | 4.4 | 31,251 | 3.0 | 16,638 | 19,205 | 20,447 | 21,762 | 24,353 | 31,418 | 35,871 | 38,163 | 40,411 | 48,426 |
| Scotland | 1,394 | 30,000 | 2.4 | 34,916 | 0.9 | 17,374 | 20,431 | 21,808 | 23,290 | 26,479 | 33,726 | 37,964 | 40,452 | 43,591 | 54,886 |
| Northern Ireland | 515 | 27,434 | 1.2 | 32,083 | 3.0 | 16,600 | 19,208 | 20,504 | 21,788 | 24,677 | 31,221 | 35,886 | 38,202 | 40,740 | 49,992 |
a Employees on adult rates who have been in the same job for more than a year.
b Figures for Number of Jobs are for indicative purposes only and should not be considered an accurate estimate of employee job counts.
Estimates in bold are considered reasonably precise, all other estimates are considered precise.
Source: ASHE, 2019 Office for National Statistics
132. As Table 4 above shows, at median full-time gross annual pay, Scotland is the fourth highest region in the UK (after London, the South East and the East), with a median of £30,000. However, this masks a degree of variation in salary levels across Scotland and is skewed by increased salaries in Glasgow, Edinburgh and Aberdeen.
133. Even Conservative Government Ministers themselves can see the issues caused by this. For example, Stephen Kerr, Conservative MP for Stirling said:
"With the average salary in Scotland being just under £23,000 these proposals would wrongly classify the majority of Scots as "unskilled". That would be a travesty. The people who run our hotels, maintain our national infrastructure and care for our elderly are skilled, they are hard-working and they are compassionate. A simple salary cut off point is far too blunt an instrument to deal with the problems we have in attracting and retaining talent across the Scottish economy." (25 June 2019)[43]
134. This would hamper our efforts to encourage migrants to rural and remote areas of Scotland which attract lower wages, as they will not be eligible for entry through the future system.
135. Clearly, even at this level, the proposed £25,600 salary threshold is higher than current pay statistics would support.
136. Migration policy should support fair work, protecting workers rights, pay and access to employment, and the potential advantage of a reduced salary threshold for Scotland could contribute to a labour market distortion in future of lower wages in some cases relative to other parts of the UK. A "London weighting" in the salary threshold for this route could remove that risk; however, approaches that are designed to encourage and facilitate migration to Scotland are more likely to be successful and meet Scotland's needs than approaches that are designed to discourage migration to other parts of the UK.
Contact
Email: Migration@gov.scot