
Scottish Fish Farm Production Survey 2025
This report is based on the returns of an annual survey questionnaire sent to all active authorised fish farming businesses in Scotland during 2025. Statistics on employment, production and value are presented.
4. Other Species
The Scottish aquaculture sector continued to farm other finfish species during 2025. Production of brown/sea trout (Salmo trutta) decreased, with most production destined for the angling restocking market. Halibut (Hippoglossus hippoglossus) were also produced during 2025, although production figures cannot be published as this would disclose information relating to an individual company.
Wrasse (Labridae) continued to be reared during 2025 for use as cleaner fish in the marine Atlantic salmon sector, where they are used as a biological control for parasites. No cleaner fish production was reported in 2025, although juvenile fish production activities continued. Cleaner fish production was undertaken by a single business and therefore some production figures cannot be published.
Company, Site and Production Data
| Species | No. of companies | No. of sites | 2024 production (tonnes) | 2025 production (tonnes) | 2026 Estimated production (tonnes) |
|---|---|---|---|---|---|
| Brown/sea trout | 4 | 5 | 23 | 14 | 15 |
| Halibut | 1 | 1 | Data excluded | Data excluded | Data excluded |
| Cleaner fish | 1 | 1 | 3 | 0 | 0 |
Note: The 2026 production values are sector estimates based on stocks currently being on-grown. Halibut production and estimated production figures cannot be published as this would disclose information relating to an individual company. Cleaner fish production comprised wrasse only in 2024. No cleaner fish production was reported in 2025, although production of juvenile fish continued.
Data Source: Scottish Fish Farm Production Survey 2025, Supplementary Tables, Table 40.
Staffing
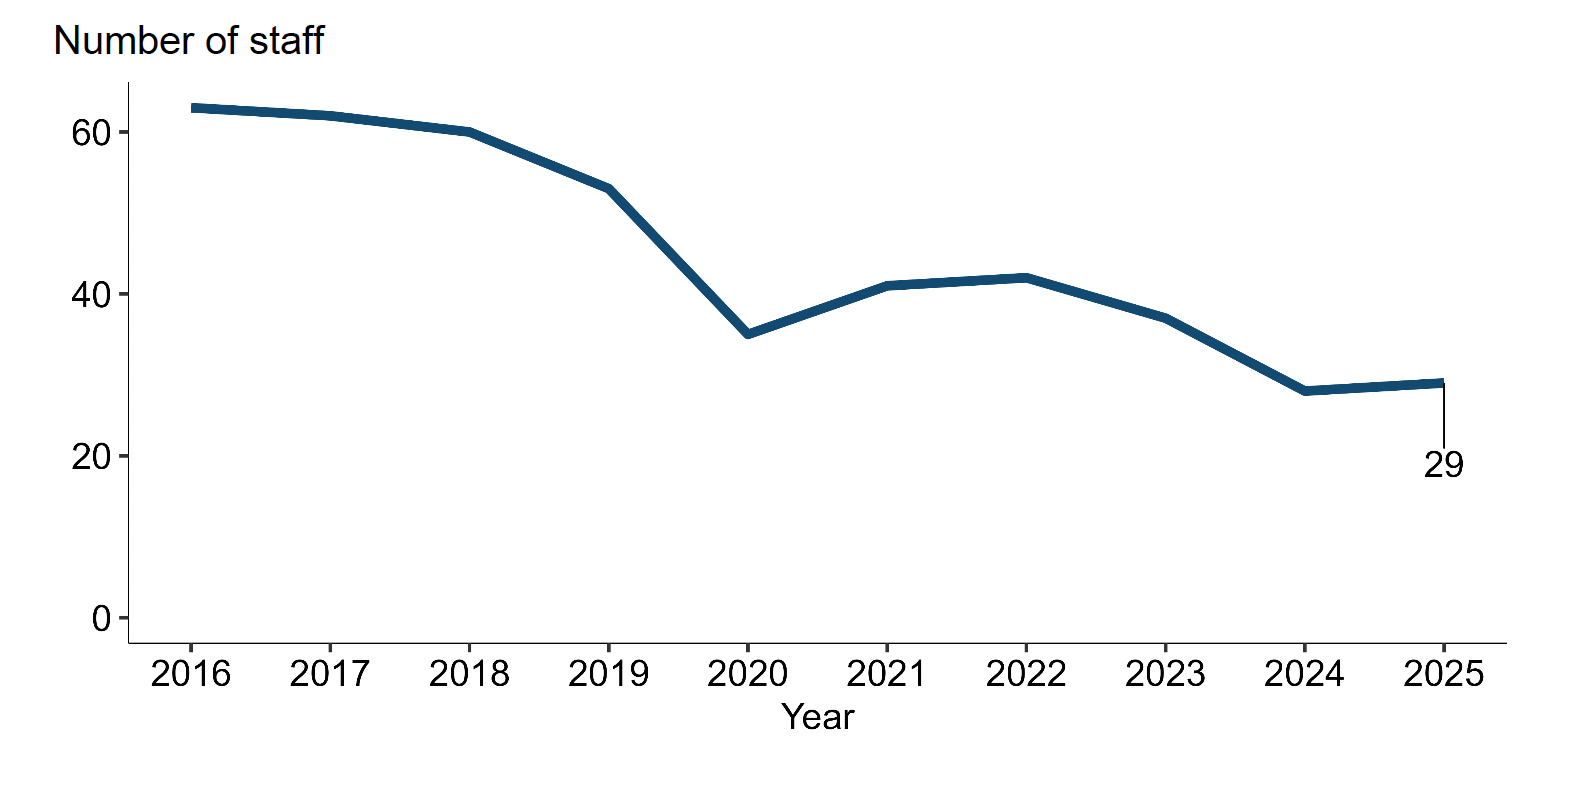
Chart 30 shows the number of staff employed in other species production between 2016 and 2025. The solid dark blue line shows the total number of staff employed each year.
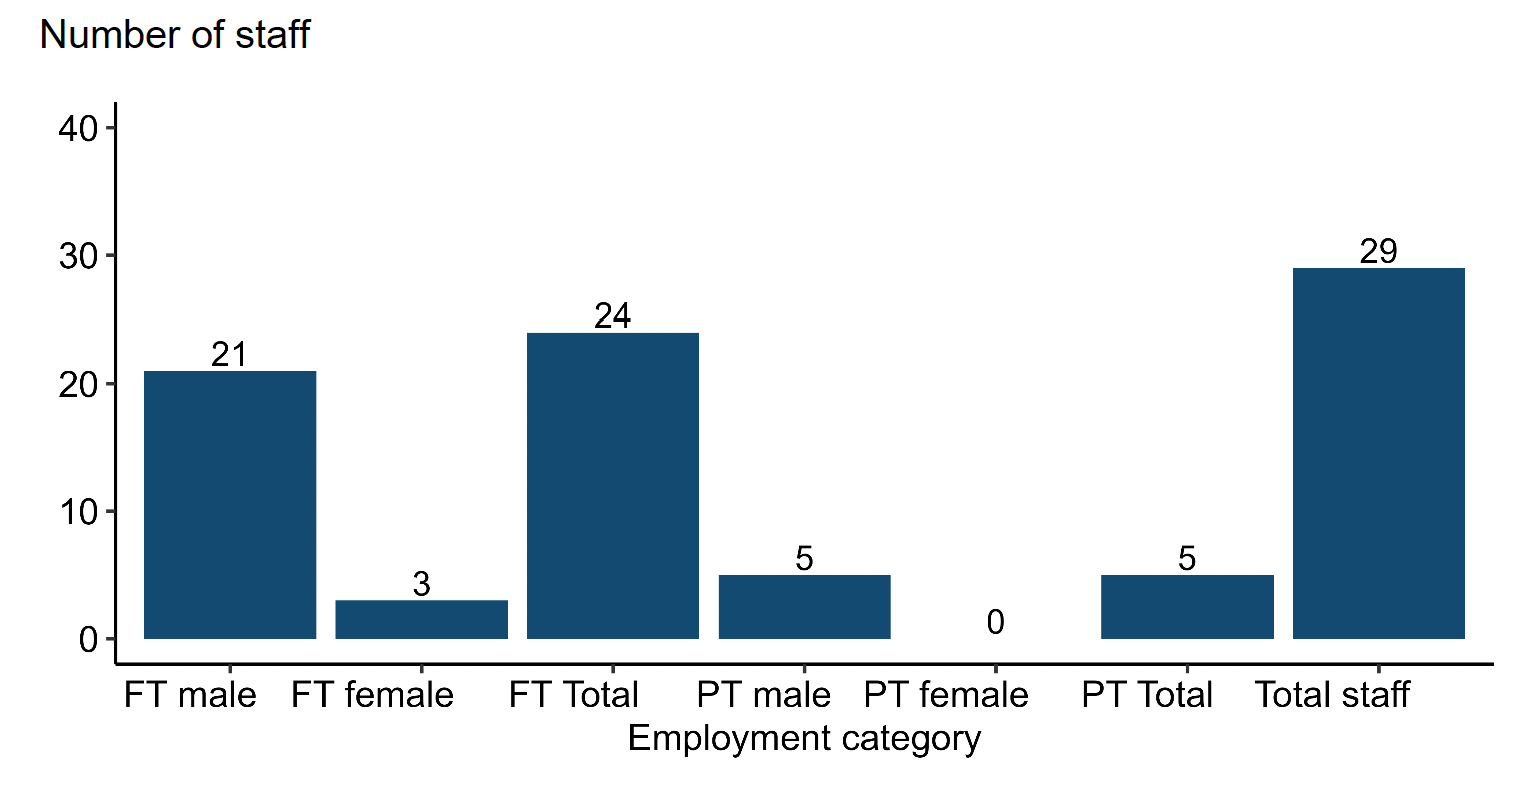
Chart 31 shows the number of staff employed in other species production by sex and employment status in 2025. The dark blue bars show the number of full-time and part-time staff in each category.
Note: FT = Full-time and PT = Part-time
In 2025, the number of staff employed in other species production increased by one (4%) to 29. Of these, 24 were full-time and five were part-time staff. Twenty-six staff (90%) were male and three (10%) were female.
Data Source: Scottish Fish Farm Production Survey 2025, Supplementary Tables, Table 41.
Production of Cleaner fish
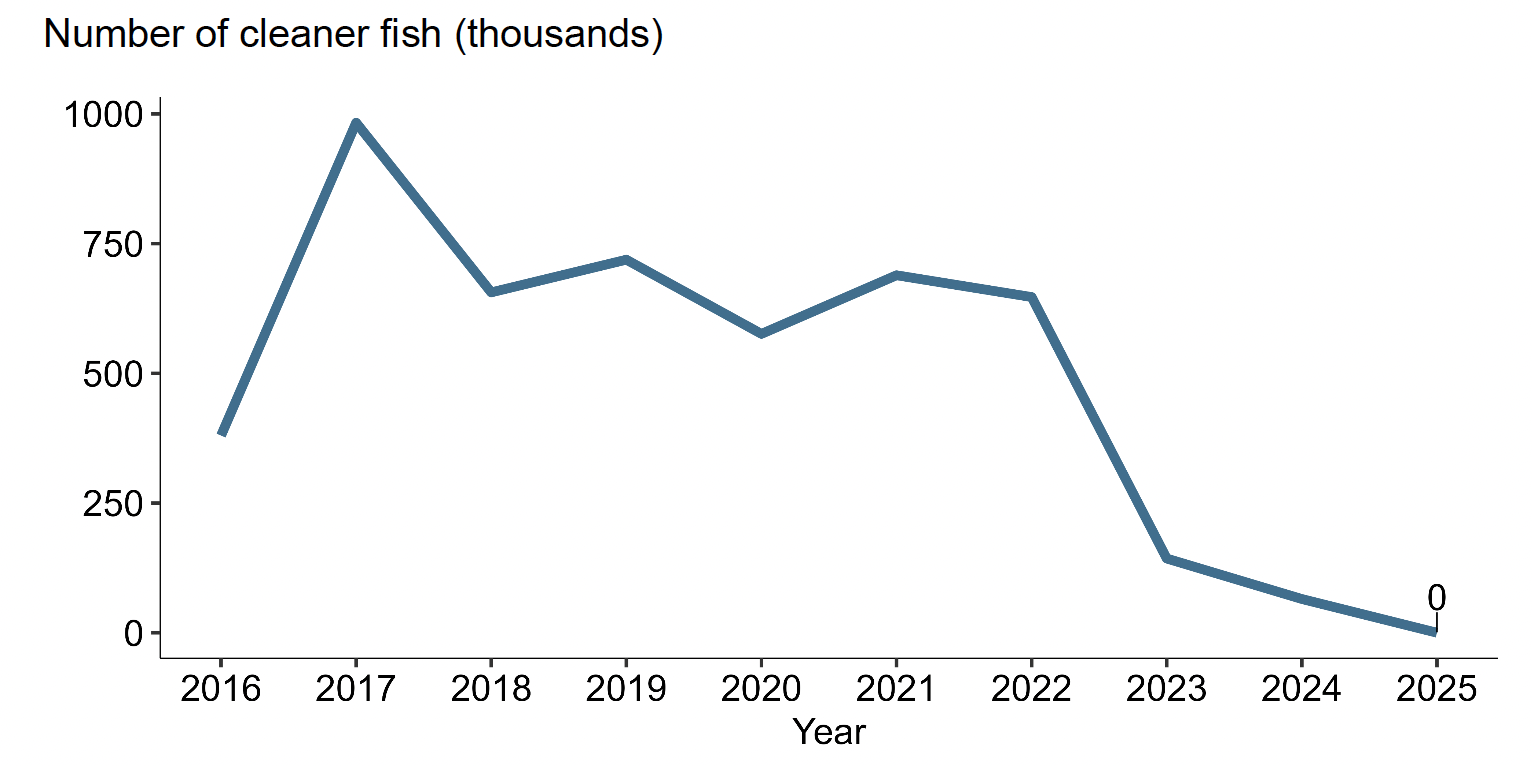
Chart 32 shows total number of cleaner fish produced in Scotland between 2016 and 2025. The solid dark blue line shows the annual number of cleaner fish produced (thousands).
Note: Cleaner fish production comprised wrasse and lumpsucker in earlier years. Since 2024, cleaner fish production has comprised wrasse only. Figures exclude larval-stage fish.
Cleaner fish are produced for use as a biological control for parasites in the marine Atlantic salmon sector. Data on cleaner fish production have been collected since 2015. These figures exclude larval-stage fish, which may be transferred for on-growing shortly after hatching.
No cleaner fish production was reported in 2025, although juvenile fish production activities continued.
Data Source: Scottish Fish Farm Production Survey 2025, Supplementary Tables, Table 42.
Ova Laid Down to Hatch
| Species | Own broodstock laid down to hatch (in 000s) | Other GB broodstock laid down to hatch (in 000s) | Imported ova laid down to hatch (in 000s) |
|---|---|---|---|
| Brown/sea trout | 10 | 20 | 0 |
| Halibut | Data excluded | 0 | Data excluded |
| Cleaner fish | 0 | 0 | 0 |
Note: Halibut ova were laid down to hatch in 2025, but the figures cannot be published as this would disclose information relating to an individual company. Cleaner fish production comprised wrasse only in 2025. No cleaner fish ova were laid down to hatch in 2025.
Data Source: Scottish Fish Farm Production Survey 2025, Supplementary Tables, Table 43.
Trade in Small Fish
| Species | Bought (in 000s) | Sold (in 000s) |
|---|---|---|
| Brown/sea trout | 45 | 10 |
| Halibut | 0 | Data excluded |
| Cleaner fish | 0 | Data excluded |
Note: Halibut and cleaner fish production comprised a single business in 2025. Figures have been excluded where publication would disclose information relating to an individual company. Cleaner fish production comprised wrasse only.
Trade in halibut and cleaner fish cannot be reported in full as this would disclose information relating to individual companies. Cleaner fish production comprised wrasse only in 2025.
There was also a small amount of production of tiger trout (Salmo trutta crossed with Salvelinus fontinalis). However, due to the small number of companies in production, it is not possible to summarise these data without revealing the production of individual companies.
Data Source: Scottish Fish Farm Production Survey 2025, Supplementary Tables, Table 44.
Organic Production
Of the six sites recorded as producing other species in 2025, no organic production was reported.
Escapes
In 2025, there was one escape incident involving the loss of 6,314 cleaner fish from a seawater Atlantic salmon production site. No escape incidents were reported from sites whose primary production was classified as other species.
Escapes data from previous annual surveys can be found in the Scottish Fish Farm Production Survey 2025, Supplementary Tables, Table 46.
Contact
Email: MD.Productionsurvey@gov.scot