
Scottish Fish Farm Production Survey 2025
This report is based on the returns of an annual survey questionnaire sent to all active authorised fish farming businesses in Scotland during 2025. Statistics on employment, production and value are presented.
1. Rainbow trout (Oncorhynchus mykiss)
Production survey information was collected from all 16 companies actively involved in rainbow trout production, farming 35 active sites. This figure represents the entire sector operating in Scotland.
Production
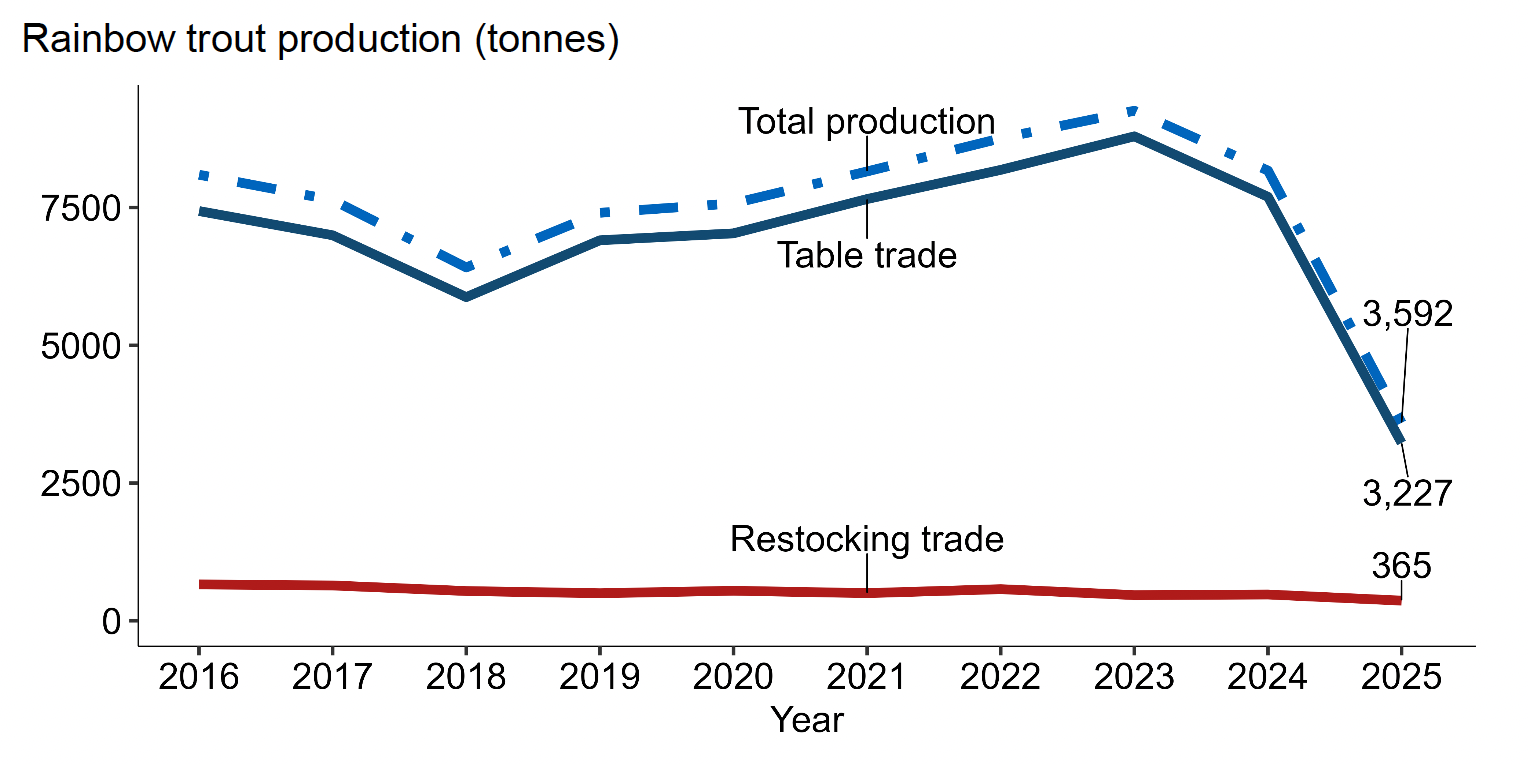
Chart 1 shows the annual rainbow trout production in Scotland between 2016 and 2025. The blue dashed and dotted line shows total production in tonnes. The solid dark blue line shows production for the table trade, while the solid dark red line shows production for the restocking trade.
Production decreased by 4,579 tonnes (56%) in 2025 to 3,592 tonnes. The decrease was largely due to the acquisition of a major rainbow trout producer, with production redirected towards salmon and smolt production. Production in 2026 is projected to be 3,967 tonnes. This is a sector estimate based on stocks currently being on-grown.
Production for the table trade in 2025 was 3,227 tonnes, a decrease of 4,468 tonnes (58%) from the 2024 total. This accounted for 90% of the total rainbow trout production, a decrease on the proportion to that produced in 2024. Decreases in the number of fish in the small, medium and large size ranges were also observed. These data are detailed in the Scottish Fish Farm Production Survey 2025, Supplementary Tables, Table 1b.
In 2025, production for the restocking of angling waters decreased to 365 tonnes, representing a decrease of 111 tonnes (23%) from the 2024 total. This accounted for 10% of total rainbow trout production in 2025. These figures represent the tonnage of fish supplied to angling waters for restocking purposes; they do not account for the catch taken by anglers. There was a decrease in the number of fish in the small and medium size ranges but an increase in the number in the large size range during 2025. These data are detailed in the Scottish Fish Farm Production Survey 2025, Supplementary Tables, Table 1c.
Data Source: Scottish Fish Farm Production Survey 2025, Supplementary Tables, Table 1a, 1b and 1c.
Production by Site
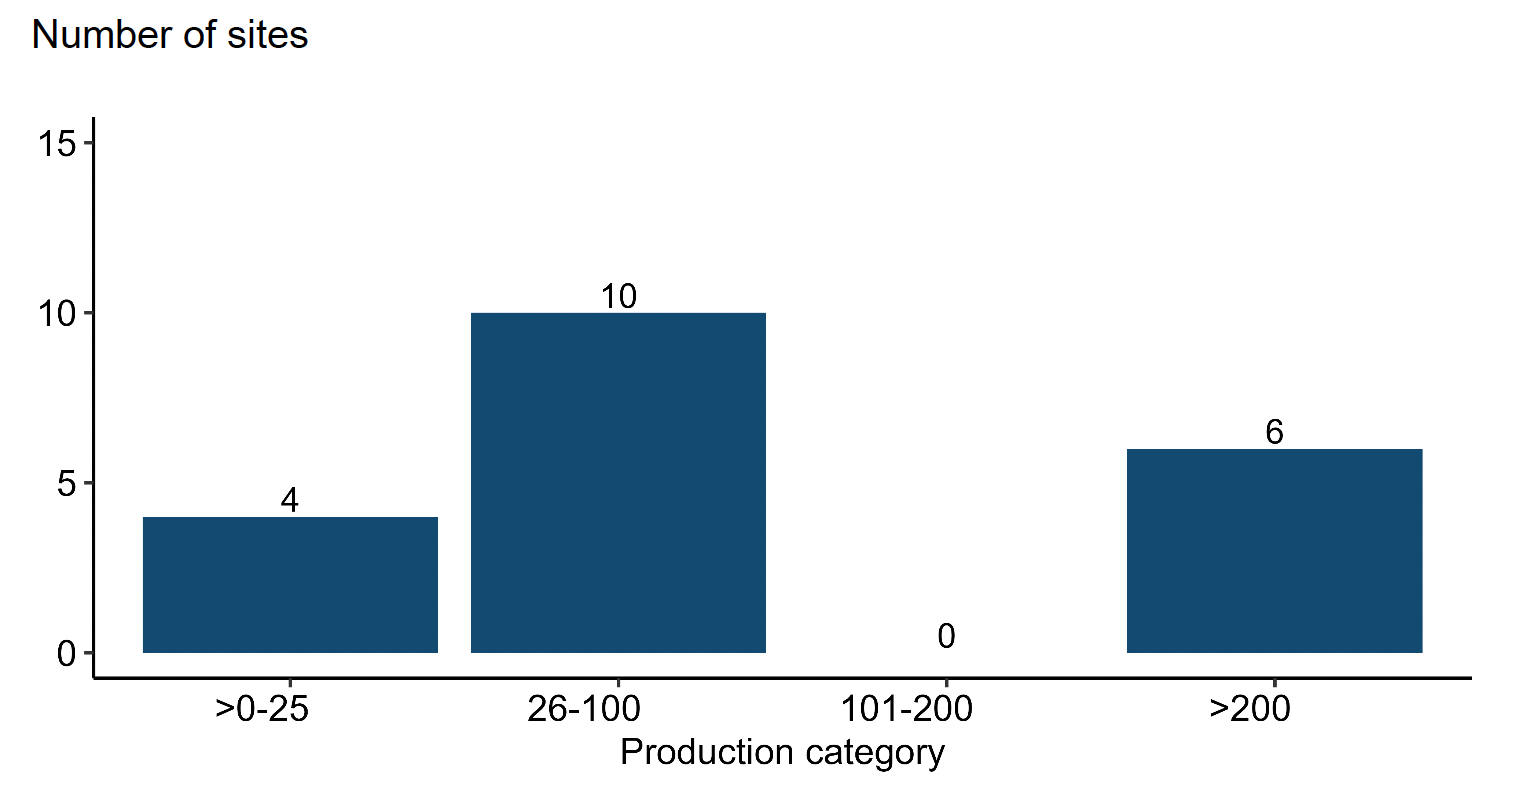
Chart 2 shows the number of rainbow trout production sites in each production category in 2025. The bars show the number of sites producing more than 0 and up to 25 tonnes, 26 to 100 tonnes, 101 to 200 tonnes, and more than 200 tonnes.
Production was reported from 20 of the 35 active rainbow trout sites in 2025. The remaining active sites did not report any rainbow trout production during the year. The number of sites in the more than 0 and up to 25 tonnes production category decreased by one, while the number in the 26 to 100 tonnes category decreased by two. The number of sites in both the 101 to 200 tonnes and more than 200 tonnes categories decreased by three. In total, the number of sites reporting rainbow trout production decreased by nine compared with 2024. These figures do not include those sites specialising in the production of ova or young fish for on-growing.
Data Source: Scottish Fish Farm Production Survey 2025, Supplementary Tables, Table 2.
Production by Method
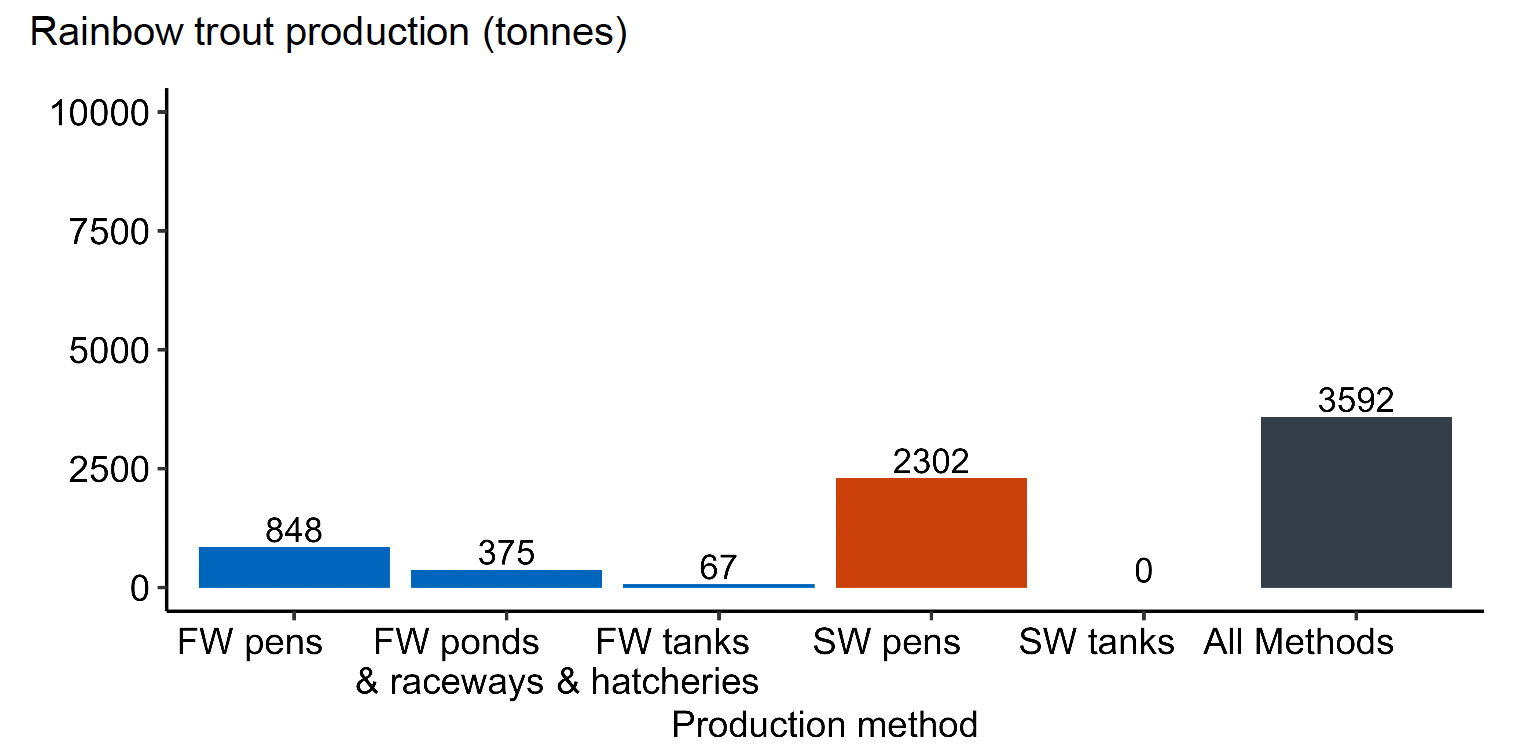
Chart 3 shows rainbow trout production in Scotland by production method in 2025. The blue bars show production from freshwater production methods, while the orange bars show production from seawater production methods. The dark grey bar shows total rainbow trout production by all production methods.
Seawater production accounted for 2,302 tonnes (64%) and freshwater production for the remaining 1,290 tonnes (36%). Seawater pens were the largest production method, accounting for almost two-thirds of total production. Production from all production facilities operated decreased during 2025. No production was reported from seawater tanks.
Data Source: Scottish Fish Farm Production Survey 2025, Supplementary Tables, Table 3.
Company and Site Data
In 2025, the number of companies authorised by the Scottish Government and actively engaged in rainbow trout production was 16. The number of sites registered and in production was 35.
Data Source: Scottish Fish Farm Production Survey 2025, Supplementary Tables, Table 4.
Staffing and Productivity
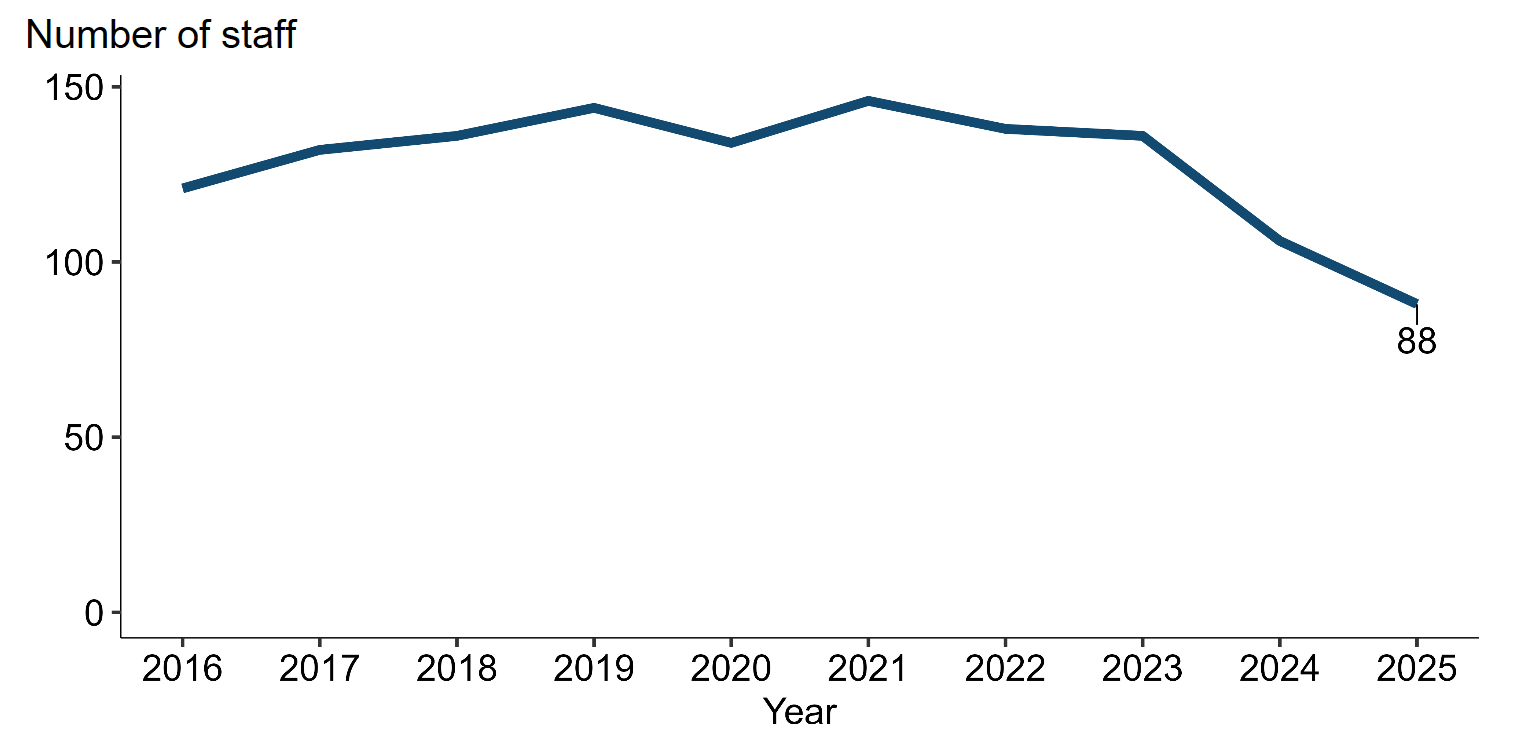
Chart 4 shows the number of staff employed in rainbow trout production between 2016 and 2025. The solid dark blue line shows the combined total full-time and part-time staff each year.
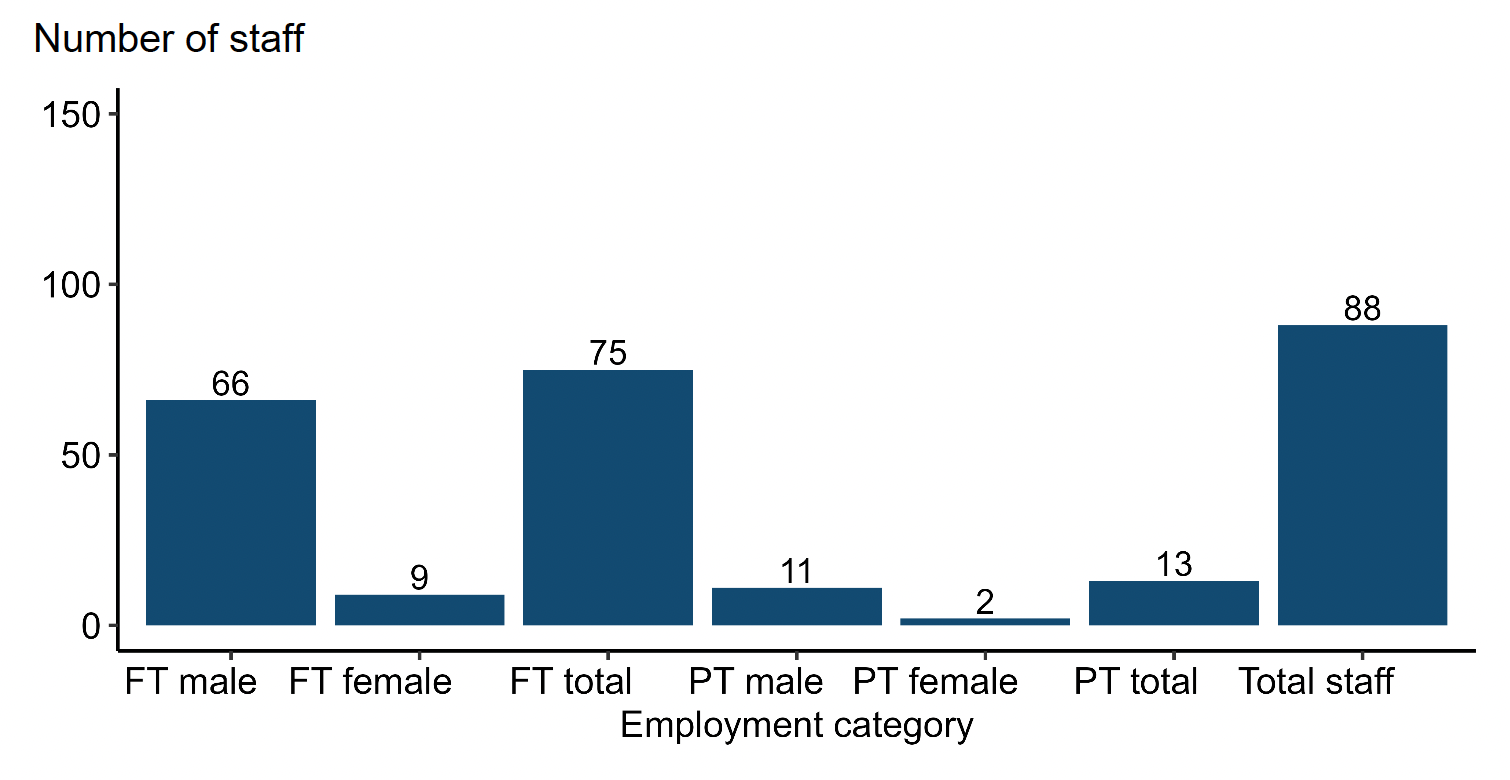
Chart 5 shows the number of staff employed in rainbow trout production by sex and employment status in 2025. The dark blue bars show the number of full-time and part-time staff in each category.
In 2025, the total number of staff decreased by 18 (17%) to 88. This reduction included 23 fewer full-time staff and five more part-time staff. Of the 88 staff, 77 were male and 11 were female. Productivity, measured as tonnes produced per person, decreased by 47% in 2025 to 40.8 tonnes per person. No distinction is made between full and part-time staff for this calculation.
Data Source: Scottish Fish Farm Production Survey 2025, Supplementary Tables, Table 5.
Production by Area
| Area | No. of sites | Table production (tonnes) | Restocking production (tonnes) | Total production (tonnes) | Mean tonnes per site |
|---|---|---|---|---|---|
| North | 6 | 657 | 38 | 695 | 115.9 |
| East | 8 | 925 | 188 | 1,113 | 139.1 |
| West | 12 | 1,645 | 0 | 1,645 | 137.1 |
| South | 9 | 0 | 139 | 139 | 15.4 |
| All Scotland | 35 | 3,227 | 365 | 3,592 | 102.6 |
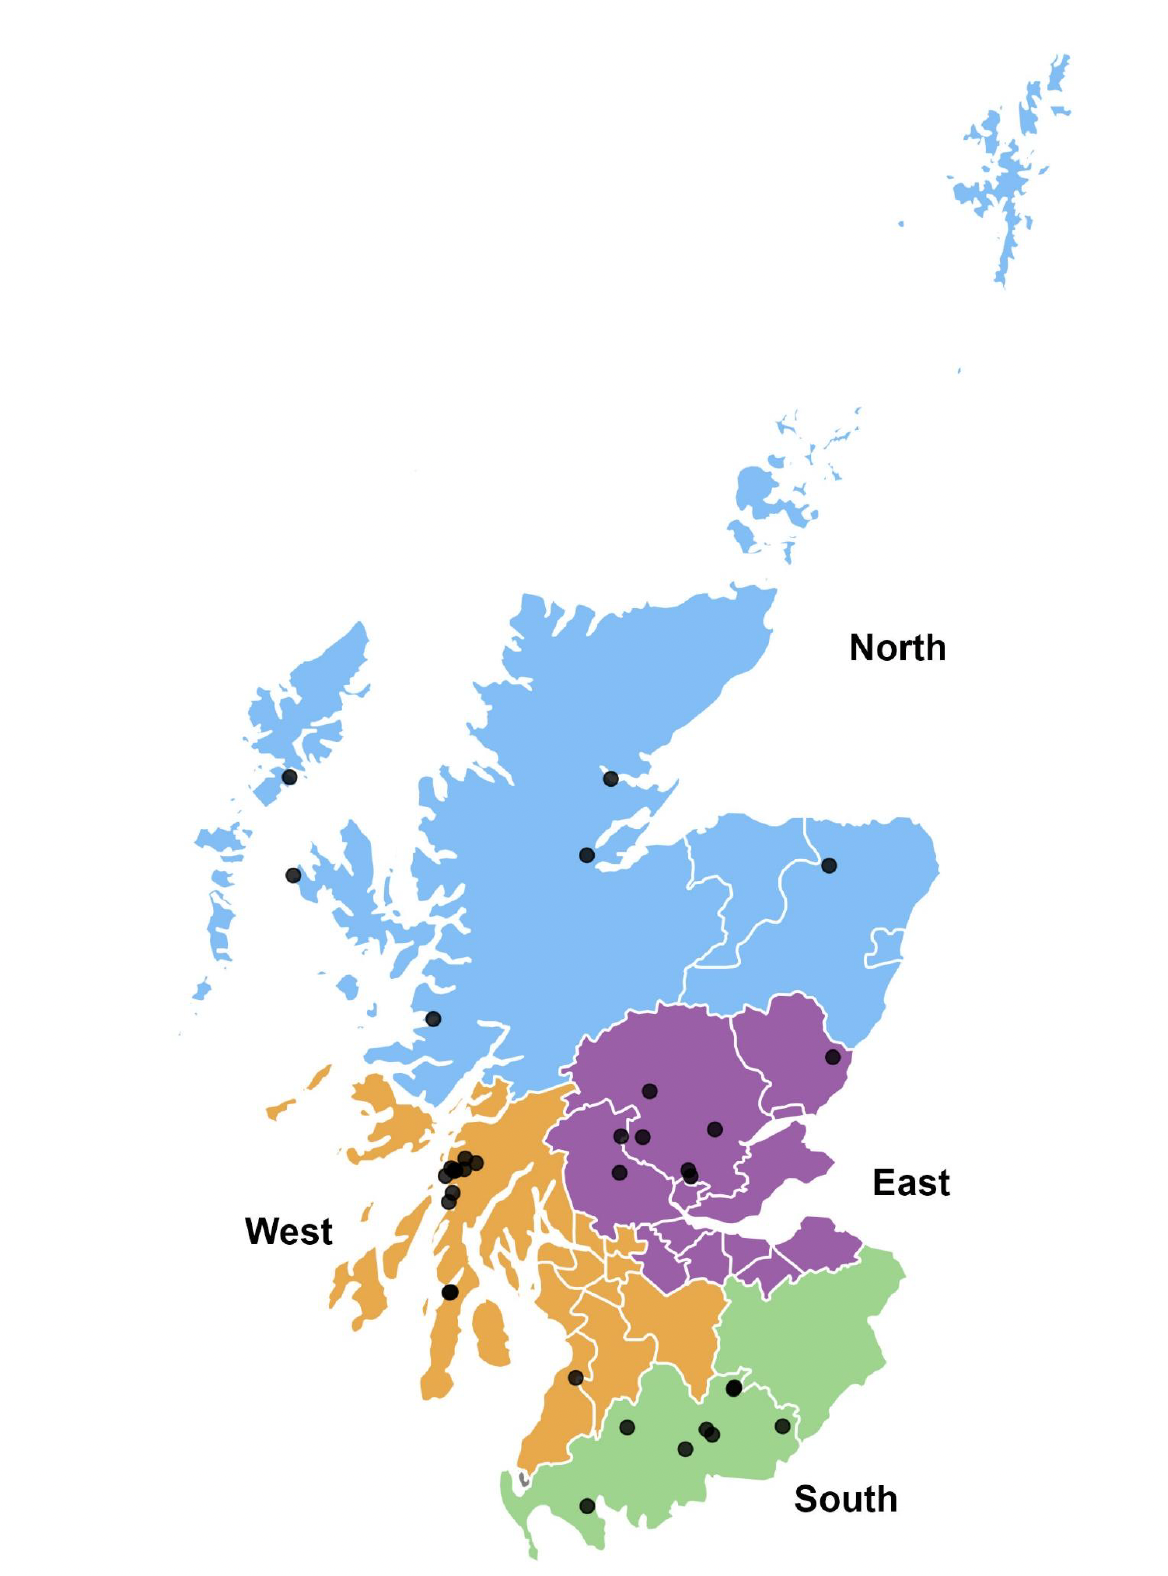
Table 1 presents a summary of rainbow trout production across Scotland in 2025. Production areas were North, East, West, South and All Scotland. The table includes the number of active sites, production volumes (tonnes) for table trade and restocking trade, total production, and the mean production per site.
Note: From 2018, the North area also included production and staff from the Western Isles and from 2021 production and staff from Orkney was also included.
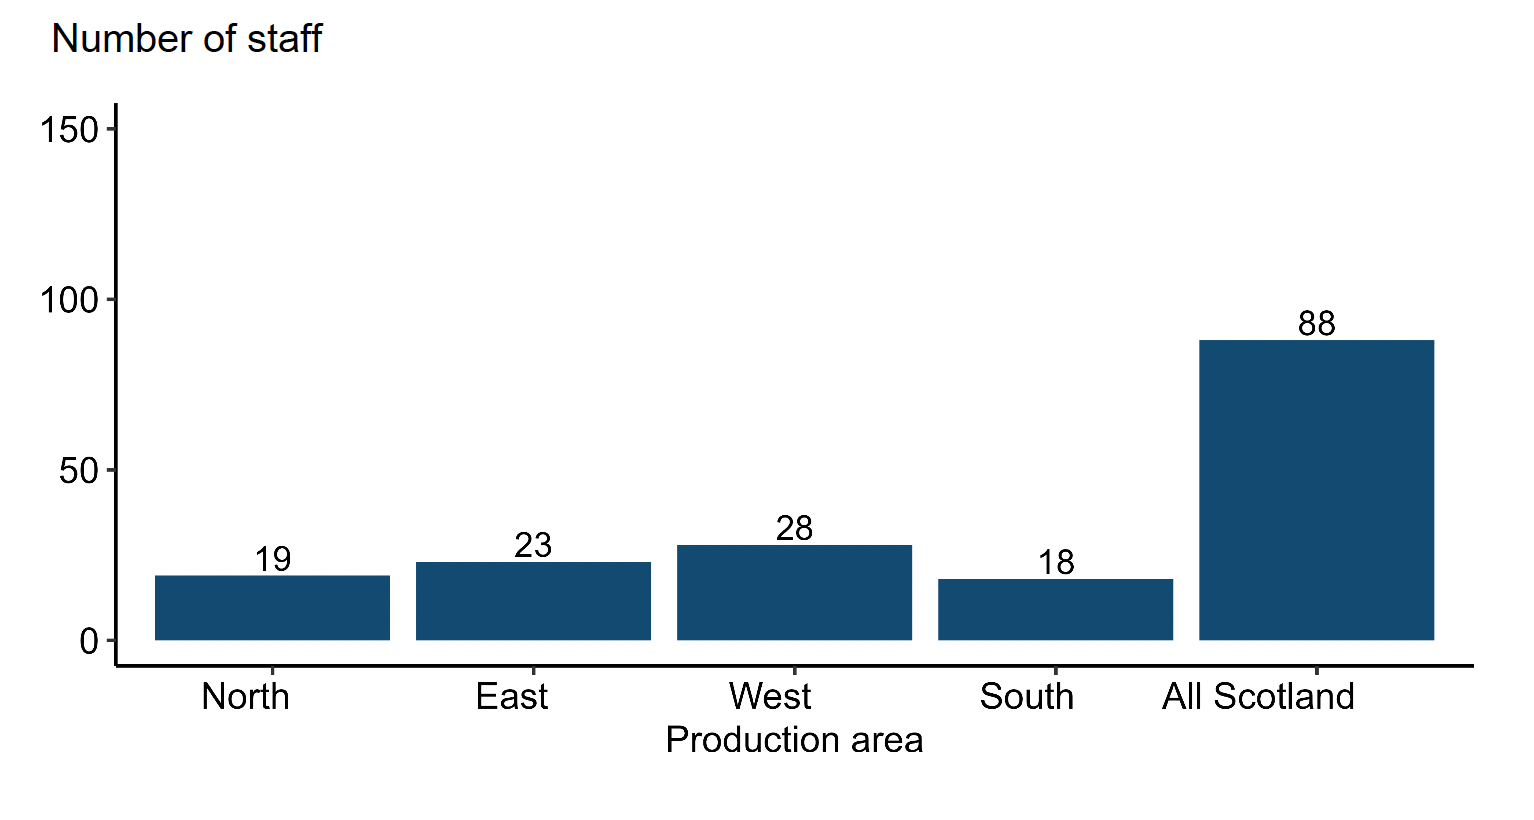
Chart 6 shows the number of staff employed in rainbow trout production areas in Scotland during 2025. The dark blue bars show the number of staff employed in the North, East, West and South production areas, and Scotland as a whole.
In 2025, productivity per site was highest in the East at 139.1 tonnes per site, while productivity per person was highest in the West at 58.8 tonnes per person.
Data Source: Scottish Fish Farm Production Survey 2025, Supplementary Tables, Table 6.
Type and Source of Ova Laid Down
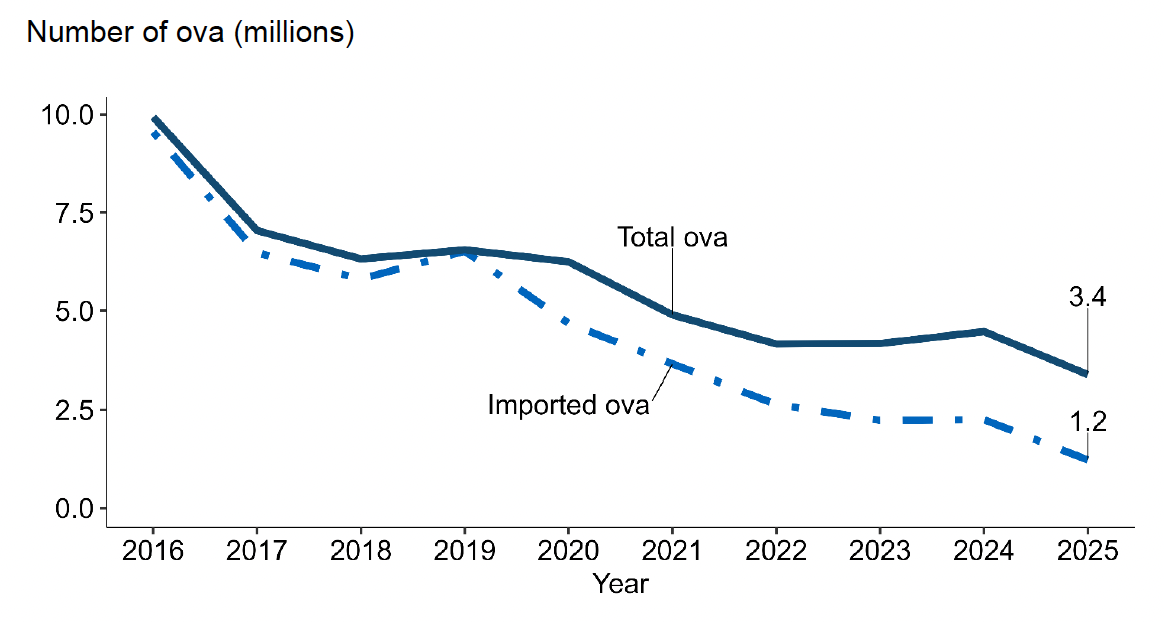
Chart 7 shows the number of rainbow trout ova laid down to hatch in Scotland between 2016 and 2025. The solid dark blue line shows the total number of ova laid down to hatch, while the blue dashed and dotted line shows the number of imported ova laid down to hatch.
In 2025, the total number of eyed ova laid down to hatch decreased by 1.1 million (24%) from the 2024 total. Almost all ova laid down to hatch in 2025 were triploid ova. All imported ova originated from the Northern hemisphere. The proportion of ova sourced from Great Britain (GB) broodstock increased to 64% of the total. In addition to GB produced ova, the sector continues to import ova to supplement domestic stocks. Data on the importation of ova into Scotland are also available from the health certificates and are shown in Chart 8. Any discrepancy between the figures in Chart 7 and 8 is due to data being obtained from two independent sources.
A full breakdown of the ova types and source can be found in the: Scottish Fish Farm Production Survey 2025, Supplementary Tables, Table 7 and Table 8.
Imports from Official Import Health Certificates
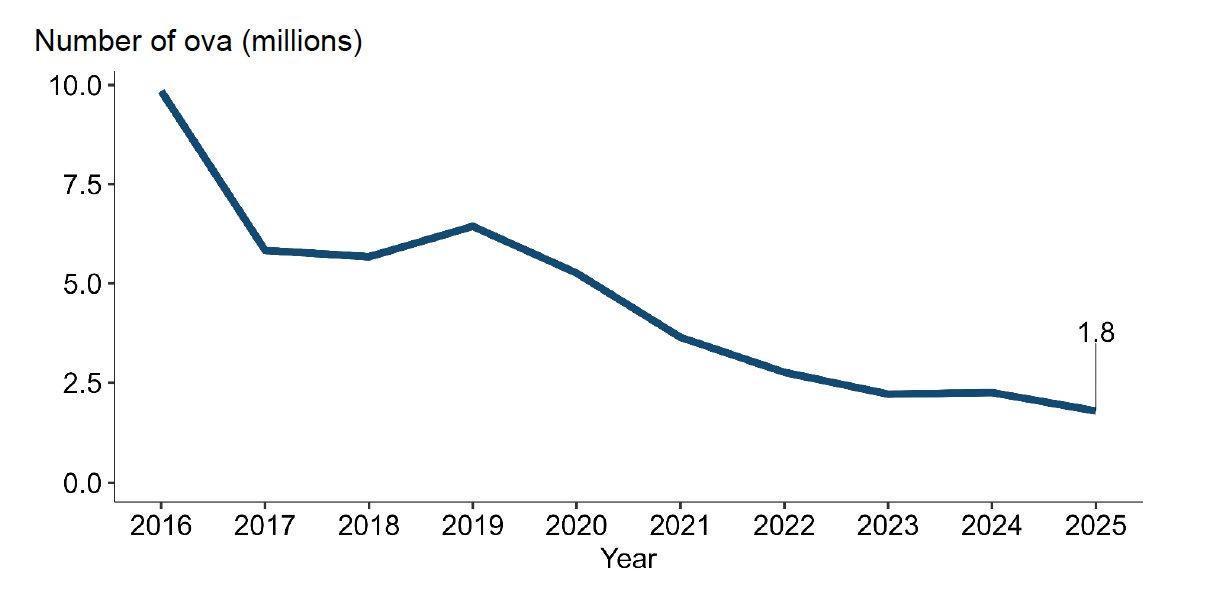
Chart 8 shows the number of rainbow trout ova imported into Scotland from outwith GB between 2016 and 2025. The solid dark blue line shows the annual number of imported ova.
In 2025, official import health certificates recorded 1.8 million ova imported into Scotland from outwith GB. This represents a decrease from 2024. The number of imports and their source countries are detailed in the Scottish Fish Farm Production Survey 2025, Supplementary Tables, Table 9a.
Suppliers from within the European Union (EU) accounted for 65% of ova imported into Scotland during 2025, with suppliers from the USA accounting for the remaining 35%. No producers imported part-grown rainbow trout into Scotland from Northern Ireland in 2025, reflecting the shift by a major producer to salmon and smolt production. Further data on the seasonal variation in ova numbers and sources of imported ova into Scotland from outwith GB during 2025 can be found in the Scottish Fish Farm Production Survey 2025, Supplementary Tables, Table 9b. Data on the numbers and sources of fish imported into Scotland from outwith GB can be found in the Scottish Fish Farm Production Survey 2025, Supplementary Tables, Table 9a and 9c.
Trade in Fry and Fingerlings
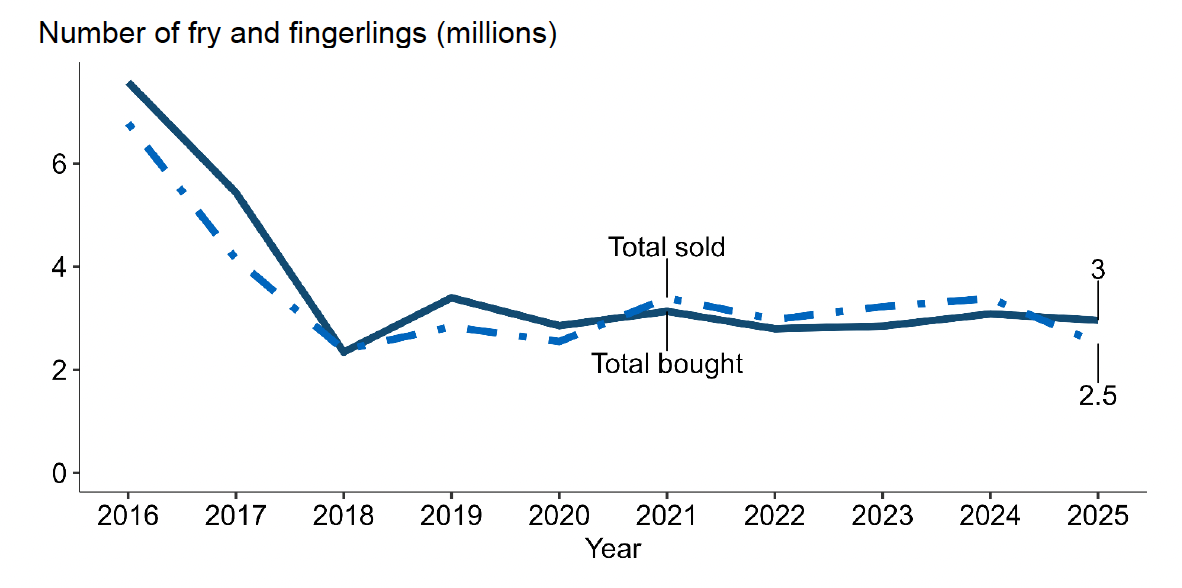
Chart 9 shows the number of rainbow trout fry and fingerlings bought and sold in Scotland between 2016 and 2025. The solid dark blue line shows the number of fry and fingerlings bought, while the blue dashed and dotted line shows the number sold.
The established trade between hatcheries and on-growing farms continued in 2025, with some companies specialising in fry and fingerling production. The total number of fry and fingerlings bought was 3.0 million, decreased by 3% from 2024, while the total number sold was 2.5 million, a decrease of 26%. Almost all (97%) purchased fry and fingerlings were triploid fish. The difference between the numbers bought and sold reflects trade with England and Wales. More detailed data relating to fry and fingerling trade can be found in the Scottish Fish Farm Production Survey 2025, Supplementary Tables, Table 10.
Use of Vaccines
Vaccines continued to be used as a preventative treatment against enteric redmouth disease (ERM), a potentially serious bacterial infection caused by Yersinia ruckeri. Vaccination is generally carried out as a bath treatment at the fingerling stage, although some vaccines are administered by intra-peritoneal injection. A total of 3.0 million fish were vaccinated across 20 sites.
Data Source: Scottish Fish Farm Production Survey 2025, Supplementary Tables, Table 11.
Organic Production
Of the 35 sites recorded as active in rainbow trout production in 2025, none were certified as organic.
Escapes
In 2025, two escape incidents were reported involving the loss of 63 farmed rainbow trout.
Escapes data from previous annual surveys can be found in the Scottish Fish Farm Production Survey 2025, Supplementary Tables, Table 46.
Contact
Email: MD.Productionsurvey@gov.scot