Scottish Civil Estate: efficiency and sustainability report 2019 to 2020
Scottish Ministers are required to lay before the Scottish Parliament this annual report which uses key performance indicators to assess progress in improving the efficiency and sustainability of the Scottish Civil Estate.
4. Efficiency and Sustainability 2019-20
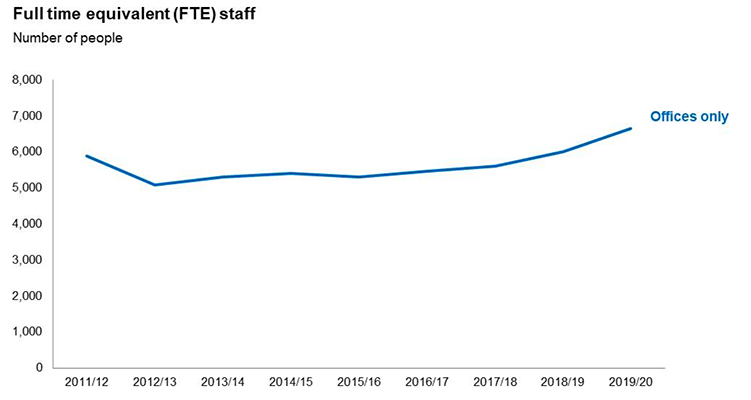
The basis of the full time equivalent count has been revised from 2014-15 onwards which will affect comparisons with previous years' data. The increase shown from 2018-19 to 2019-20 is a result of the addition of Forestry and Land Scotland and Scottish Forestry staff numbers.
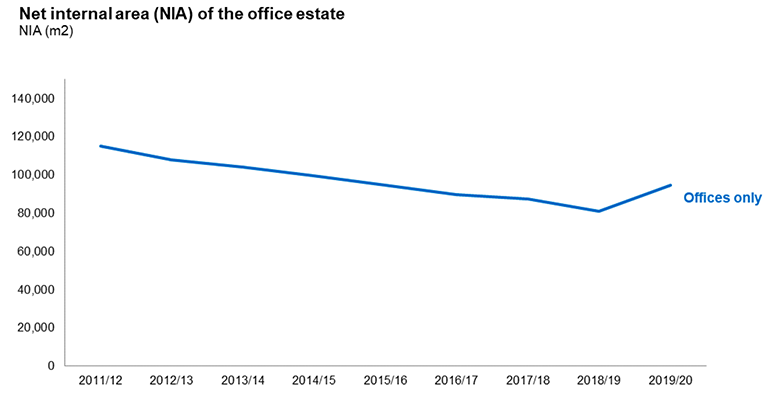
The increase in Net Internal Area is from the addition of the six new properties from Forestry and Land Scotland and Scottish Forestry.
4.1 Property Costs of the Office Estate
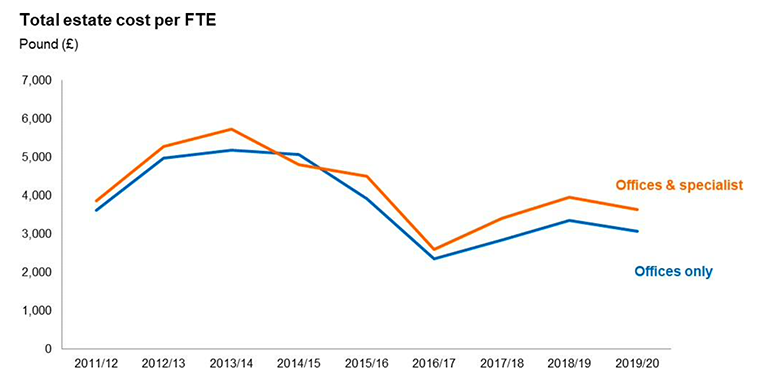
Total Estate Cost includes rent, rates and a wide range of other costs of occupation including repairs and maintenance, service charge, water and sewerage, security and cleaning. The increase in cost per FTE from 2011-12 to 2014-15 was as a result of a combination of factors. It reflected the increasing cost of accommodation at that time, through increases in rent as the property market improved together with uplift in the cost of utilities. It was also affected by the time lag between accommodation being vacated by staff and being disposed of from the estate.
As space reduced there was a significant fall in total cost per FTE between 2014-15 and 2016-17, which is a reflection of the reduction in floor space retained overall. The increases in total costs in 2017-18 and 2018-19 reflects investment in modernising current offices to optimise use of space. This year's figure show a drop in costs following a sustained period of investment in the Estate in the previous two years and is inclusive of the costs and staff from FLS and SF.
4.2 Property Costs on the Combined Office and Non-Office Specialist Estate
One of the SG science buildings at the Marine Laboratory in Aberdeen, the Ellis Building, came back into use in spring 2019-20. The building was subject to a phased reopening after being closed for around 18 months for a major refurbishment. The ground floor of the building houses aquaria: the impact of these coming back online from September 2019 can be seen in Figure 1. As well as requiring space heating, the Ellis Building also requires water heating for the aquaria, and houses water treatment plant and steam generation equipment, accounting for the increase in gas consumption which is noticeably higher than the previous year, as seen in Figure 2.
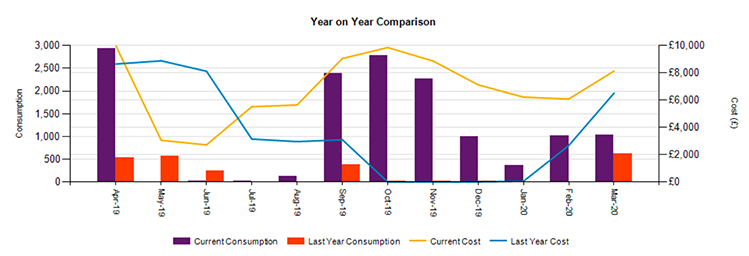
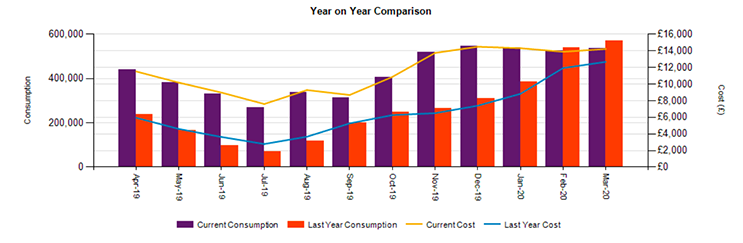
Figure 1 and 2 graphs above sourced from the Facilities Management Contractor.
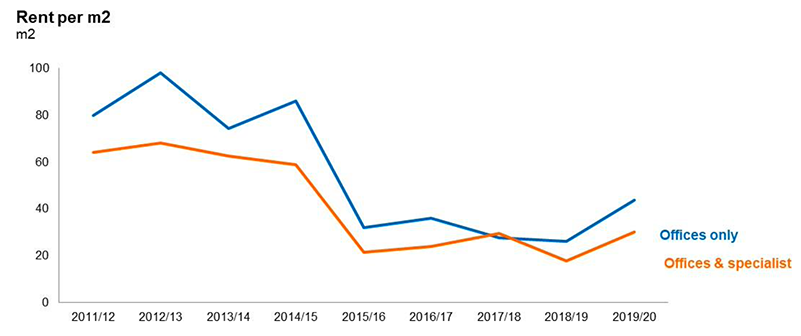
One of the factors affecting the total estate cost is rental levels. Property managers in the civil estate negotiate robustly with landlords at rent review, but some managers are faced with a lease that has either upwards only reviews of rent, or has index-linked increases built in, all of which preclude the ability to make reductions. As the market for offices is reinvigorated, demand has risen and the supply of vacant space fallen, so asset managers, including those in the public sector, have increasingly been working in an environment of declining incentives and rising rents. With the addition of 6 new buildings to the Estate, one of which is a Headquarters building in Edinburgh, the 2019-20 cost per square metre has risen as all 6 buildings are leased.
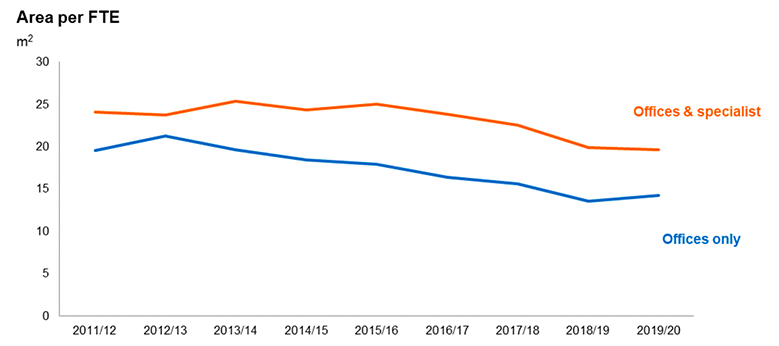
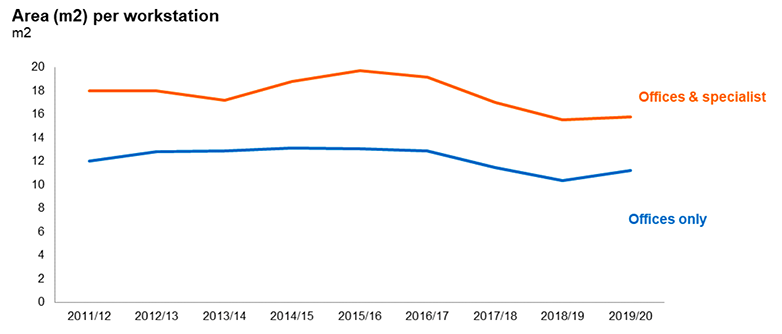
4.3 Use of Occupied Space
The part of the Scottish Civil Estate occupied by the core Scottish Government embedded smarter working principles to make more efficient use of many offices. By December 2016 these disposal and co-locations enabled a reduction of both 25% in cost and size of the estate with efficiency gains of at least £5.5m per annum. Application of the same principles across the wider estate yielded efficiency gains of £29.1m per annum by March 2018, and carbon savings of over 2,500 tonnes per annum.
Scottish Government introduced a Central Estate Strategy in April 2019. This strategy builds on the changes already achieved in preceding years to reduce the total estate size, its running costs and a transition by many organisations to 'smarter working' practices.
The strategy promotes a more corporate and collaborative approach across organisations to ensure an efficient, sustainable and well-managed estate.
The part of the Scottish Civil Estate occupied by the core Scottish Government continued a programme of adaption, rolling out further refurbishment to its corporate buildings in Glasgow and Edinburgh to increase capacity, For example, in Glasgow where 1,750 staff now work more flexibly from 1,400 shared workstations and have access to more collaborative spaces. Similarly in Edinburgh where the strategy for its largest building, Victoria Quay, is close to achieving its increase in capacity from 2,000 to 3,000 FTE.
Again due to the inclusion of the new executive agency buildings this year, the area and workstation per FTE figure has seen a slight increase. The devolution of further powers to Scotland under the Scotland Act (1998) resulted in the transfer of forestry services to the Scottish administration. Some UK services have relocated from those buildings leaving surplus space for use by Scottish Government or its bodies when demand arises. In the meantime, this ebb and flow arising from machinery of government changes adversely affects the headline space utilisation data.
4.4 Waste Recycling
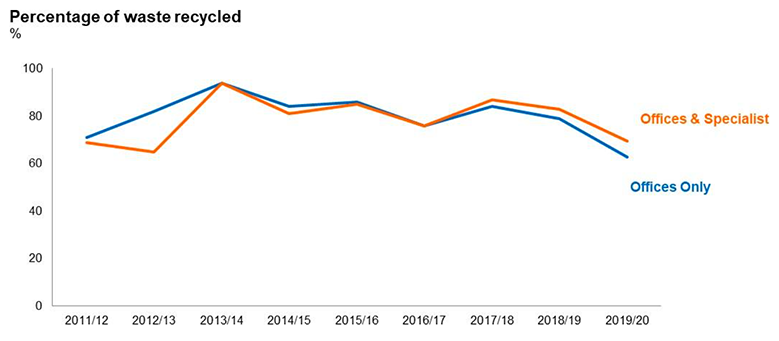
Within Scottish Government, the overall recycling rate has decreased from 88% in 2017-18 to 52% in 2019-20, although the overall landfill avoidance rate is in excess of 95%. The decline in recycling is a result of the general waste stream from the majority of buildings going directly to incineration with energy recovery (EFW), rather than being hand separated in a Materials Recovery Facility for recycling and incineration with energy recovery. Food waste was previously sent for anaerobic digestion. Since 2019, it has instead (along with the commercially compostable takeaway packaging used in the staff canteens) been sent for composting, which is classed as a type of recycling.
Changes in how waste is disposed of such as using incineration with energy recovery produced an apparent downward trend in the headline recycling figures. This use of technology to recover energy is not classed as recycling but contributes to making the SG estate more sustainable.
Alongside that, Scottish Government is committed to reducing waste production, and to removing single use consumer plastics entirely from its waste streams. Again, these initiatives do not boost headline recycling rates in the graph above but do deliver reductions in waste production in the first place, thereby improving sustainability. Single use hot drinks cups have not been available from staff canteens or coffee outlets since June 2018. Ceramic cups are available for sitting in and staff can bring or buy a reusable cup for takeaway. This saves an estimated 450,000 single use cups a year. A number of interventions to remove single use plastics have been undertaken: products with plastic straws have been removed from staff canteens and plastic cutlery has been replaced with reusable metal cutlery. Plastic food takeaway boxes have been replaced with compostable alternatives, which are composted with the food waste in a closed loop system.
One of the last significant remaining sources of single use consumer plastics on the SG estate are cold drinks cups, located in dispensers in the shared kitchens and adjacent to water coolers. The SG uses around 500,000 cups a year.
4.5 Water Consumption
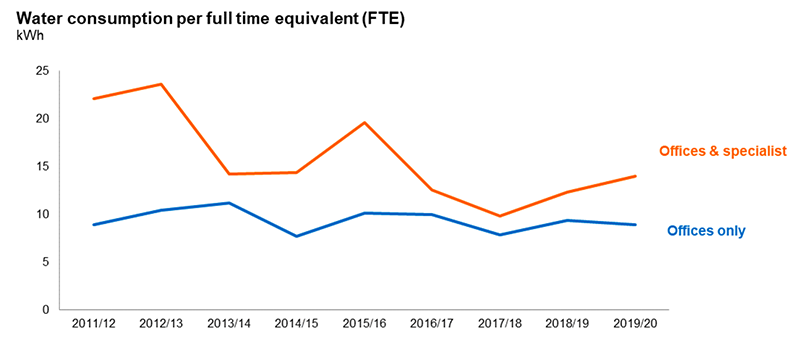
The higher level of water consumption in the combined 'Offices and Specialist' buildings category is heavily influenced by the programme of experimentation at the SG's Marine Laboratory where the focus is either on sea water-based, or fresh water-based activities. Sea water is extracted and returned directly to the adjacent coastal waters and is not included in the consumption figures.
When the business needs of Marine Scotland require a switch to fresh water, mains water consumption increases. As noted in section 4.2, the Ellis Building coming back online in 2019 resulted in a significant spike in demand in the autumn months as the aquaria came into use once more.
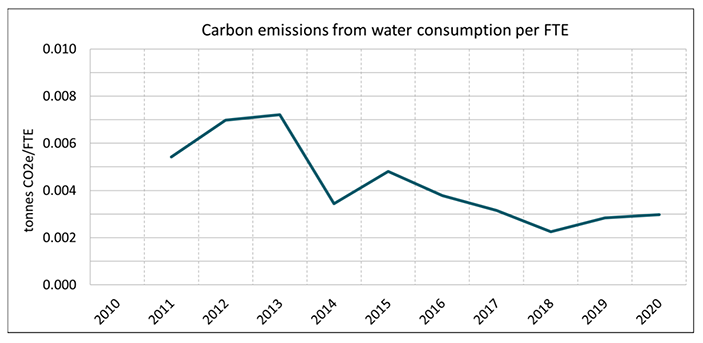
Water consumption by the Scottish Government has increased in absolute terms over the past decade; this was expected and accounted for in the Carbon Management Plan 2014-20 targets. Increases were expected primarily due to Marine Scotland's scientific activities at the Marine Laboratories, and also due to a predicted increase in staff numbers. While absolute consumption
has increased, emissions relative to FTEs have decreased, as illustrated in Figure 3. These reflect overall improvements to estate efficiencies and external efficiency gains by Scottish Water.
4.6 Energy Consumption
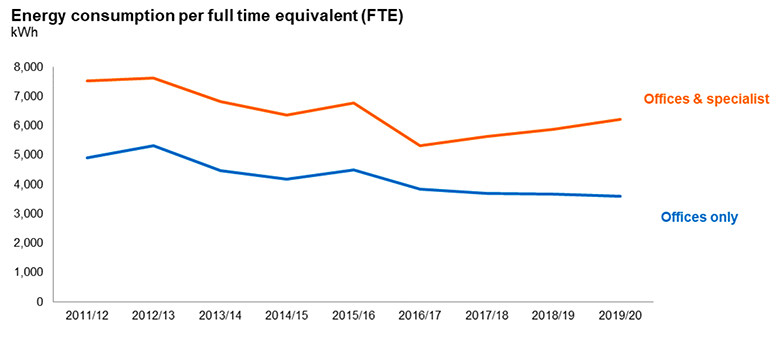
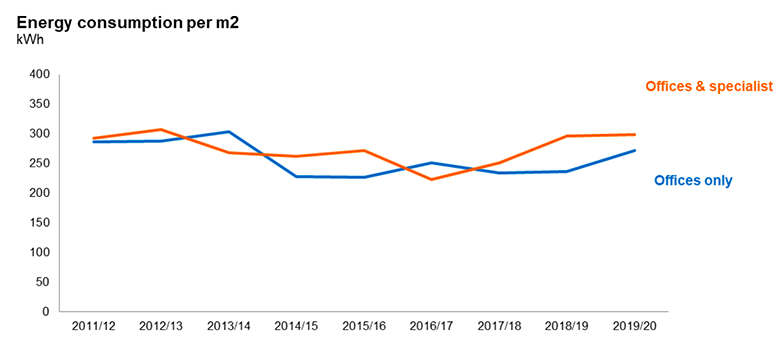
As the energy consumption per FTE declines and the trajectory for improved space utilisation also continues (see 4.3 final para), more people per square metre contribute to the rise in energy consumption per square metre evident in offices in the above graph.
The Scottish Government's Carbon Management Plan (CMP) details how carbon emissions will be reduced across the core estate. The existing CMP ran from 2014 to March 2020; it had an overall target to reduce carbon emissions by 30%. This target was exceeded with emissions reducing by around 45% by end March 2020 compared to the baseline year of 2009-10. A new CMP is under development. The CMP includes a register of projects that are prioritised on carbon reduction principles.
In 2019-20, the following work was undertaken:
- Building-wide heating system upgrade at Victoria Quay. A heating boiler was replaced and gas fired Combined Heat and Power (CHP) plant installed to provide heating and hot water to the east wing. The project included the replacement of all pipework and radiators, to improve reliability and efficiency. Equivalent work to the central and west wings is scheduled to take place in 2021-22 (delayed from 2020-21). The new plant is around 10% more efficient than the old boilers and is expected to save around 27t CO2e in total per year. The carbon savings from running the CHP will be around 9t per year, resulting in a total saving of 36t CO2e per annum.
- Solar photovoltaic panels commissioned at the Science and Advice for Scottish Agriculture building (SASA) and St Andrews House. The array at SASA has 510 panels, generation capacity 153 kWp. The array at St Andrews House is smaller due to the complex nature of the system arranged over multiple flat roofs: the system has 160 panels, 48 kWp. To date SASA has generated over 108 MWh and St Andrews House 30 MWh, with related carbon savings of 27.7t and 7.7t CO2e respectively. All electricity generated is used on site.
- EV Chargers installed at carparks at Saughton House, Victoria Quay, the Marine Labs, Faskally, Tankerness, Stornoway, Cameron House, Atlantic Quay and Longman House.