Innovation strategy: economic evidence paper
Summary of the theory and selected evidence on the role of innovation and its drivers in generating economic growth and Scotland’s innovation performance to provide context for and inform the development of Scotland’s National Innovation Strategy.
5.2 The Application of Innovation into Business
Whereas the previous section sought to identify sectors where businesses in Scotland perform strongest on innovation and have the most growth potential, this section draws on NESTA analysis using data on patenting and business-higher education collaboration and finds that the sectors where the application of innovation into business is highest are: computing/ICT; scientific R&D (part of life sciences); administrative services (part of business services); professional services; creative services; and health.
5.2.1 Patents
Patents are legal documents capturing inventive activity. As such, they provide a useful proxy for innovation that is likely to have commercial application, particularly in sectors where new knowledge is embodied in new products and machinery.
Research undertaken by NESTA[61] for the Scottish Governmentanalysed levels of patenting in Scotland by sector between 2012 and 2019. It should be noted that the sectors used in the NESTA analysis are not directly comparable with those used in the BERD and UKIS analysis above[62]. The analysis showed that the top five sectors in terms of the level of patenting in Scotland are:
- Computing/ICT[63]
- Scientific R&D (part of Life Sciences)[64]
- Administrative Services (part of Business Services)[65]
- Creative Services[66]
- Health[67]
The analysis also shows that, with the exception of R&D, these sectors also have a high level of specialisation in patents relative to the UK, which can be interpreted as evidence of competitive inventive advantage. Other sectors performing strongly on this measure include:
5.2.2 Higher Education Institution and Industry Collaboration
Higher education institution (HEI)-industry collaboration can have significant effects in the sharing and development of new ideas, as well as facilitating the adoption of new knowledge and technologies. Like the patent data discussed above, sectoral data on collaborations can provide an indication of the sectors in which Scotland excels in more applied R&D and innovation that is likely to have commercial application.
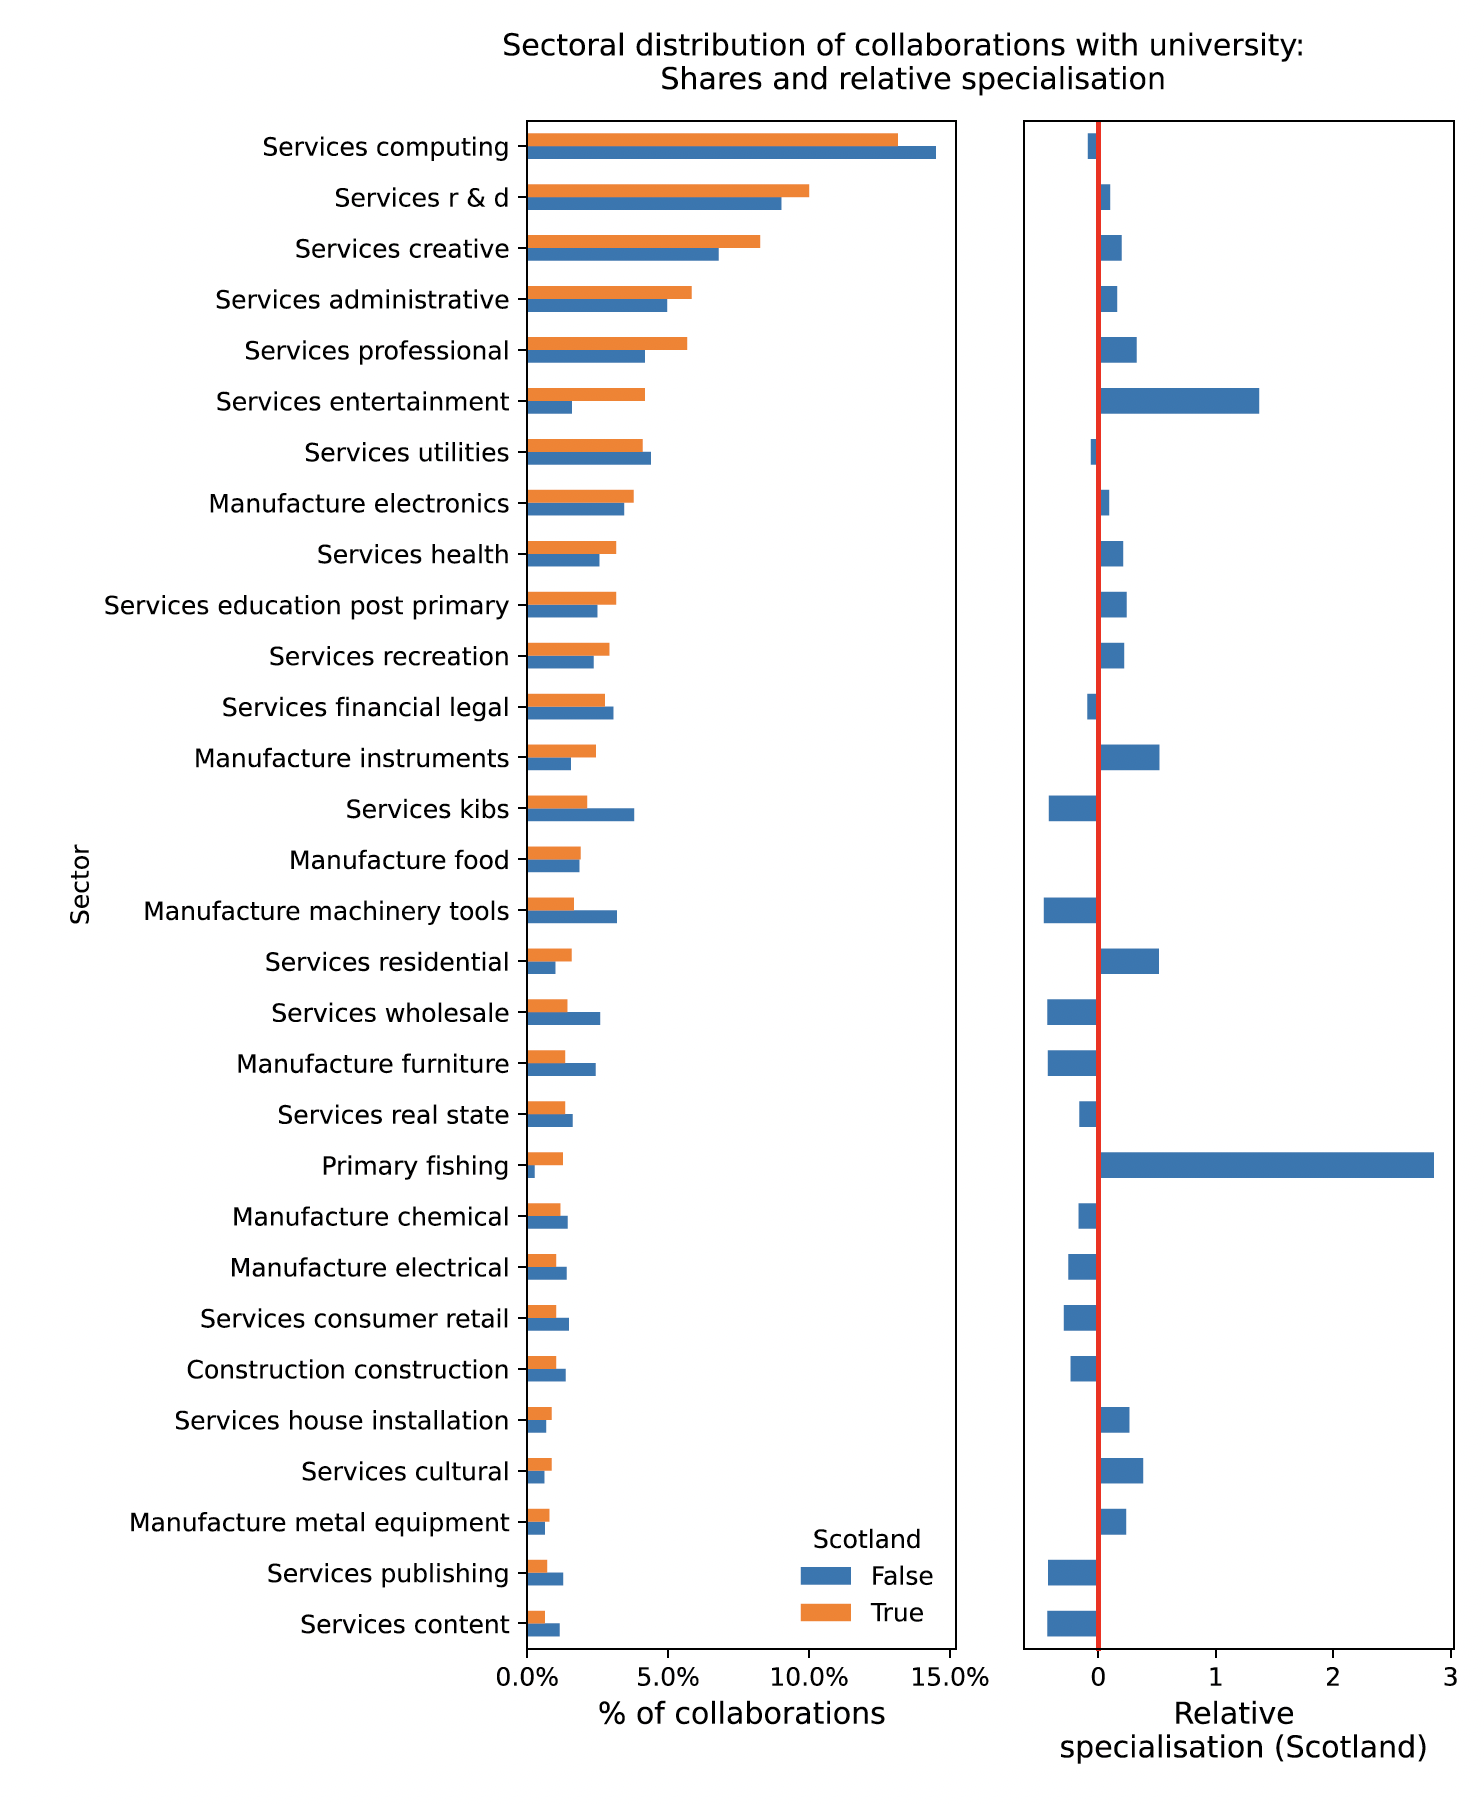
NESTA analysed data on business participation in research collaborations with HEIs by sector[71]. Figure 16 shows the proportion of business collaborations with HEIs that each sector accounts for in Scotland (left hand figure) and the relative specialisation of Scotland in different sectors (the extent to which these sectors are over or underrepresented in university collaborations compared to the UK average) (right hand figure). The analysis considers only the top 30 sectors by share of activity in Scotland.
The analysis shows (left hand figure) that the top five sectors in terms of share of overall research collaboration activity in Scotland are very similar to the sectors identified through the analysis of patents:
- Computing/ICT
- Scientific R&D
- Creative services
- Administrative services (part of business services)
- Professional services (including architecture and creative, arts and entertainment activities) [72]
The analysis also shows (right hand figure) that these sectors (with the exception of computing) also perform strongly relative to the UK (in terms of the share of research collaborations the industry in Scotland accounts for relative to the UK). However, the sectors in which Scotland performs strongest relative to the UK are:
- Fishing
- Entertainment
- Manufacture of Instruments
- Residential Services
- Cultural
It should, however, be noted that these sectors (with the exception of entertainment) do not account for a significant share of Scotland's patenting activity).
Source: NESTA
5.3 Higher Education Sector Capabilities
Whereas the previous section sought to identify sectors where the application of innovation into business is highest, this section focusses purely on Scotland's HEIs' research strengths in terms of research outputs and research funding secured. This includes both applied research likely to have direct commercial application (through examining data on research outputs including technical products, spin outs and patents) but also research outputs 'further from the market' including academic publications and competitive research funding secured.
The evidence reviewed on HEI research outputs and research funding secured indicates that Scotland's higher education institutions' innovation capabilities lie primarily in the following disciplines: health; computing/ICT; energy; biological sciences; nanotechnologies and emerging technologies; and physics and space.
5.3.1 Higher Education Institution Research Outputs
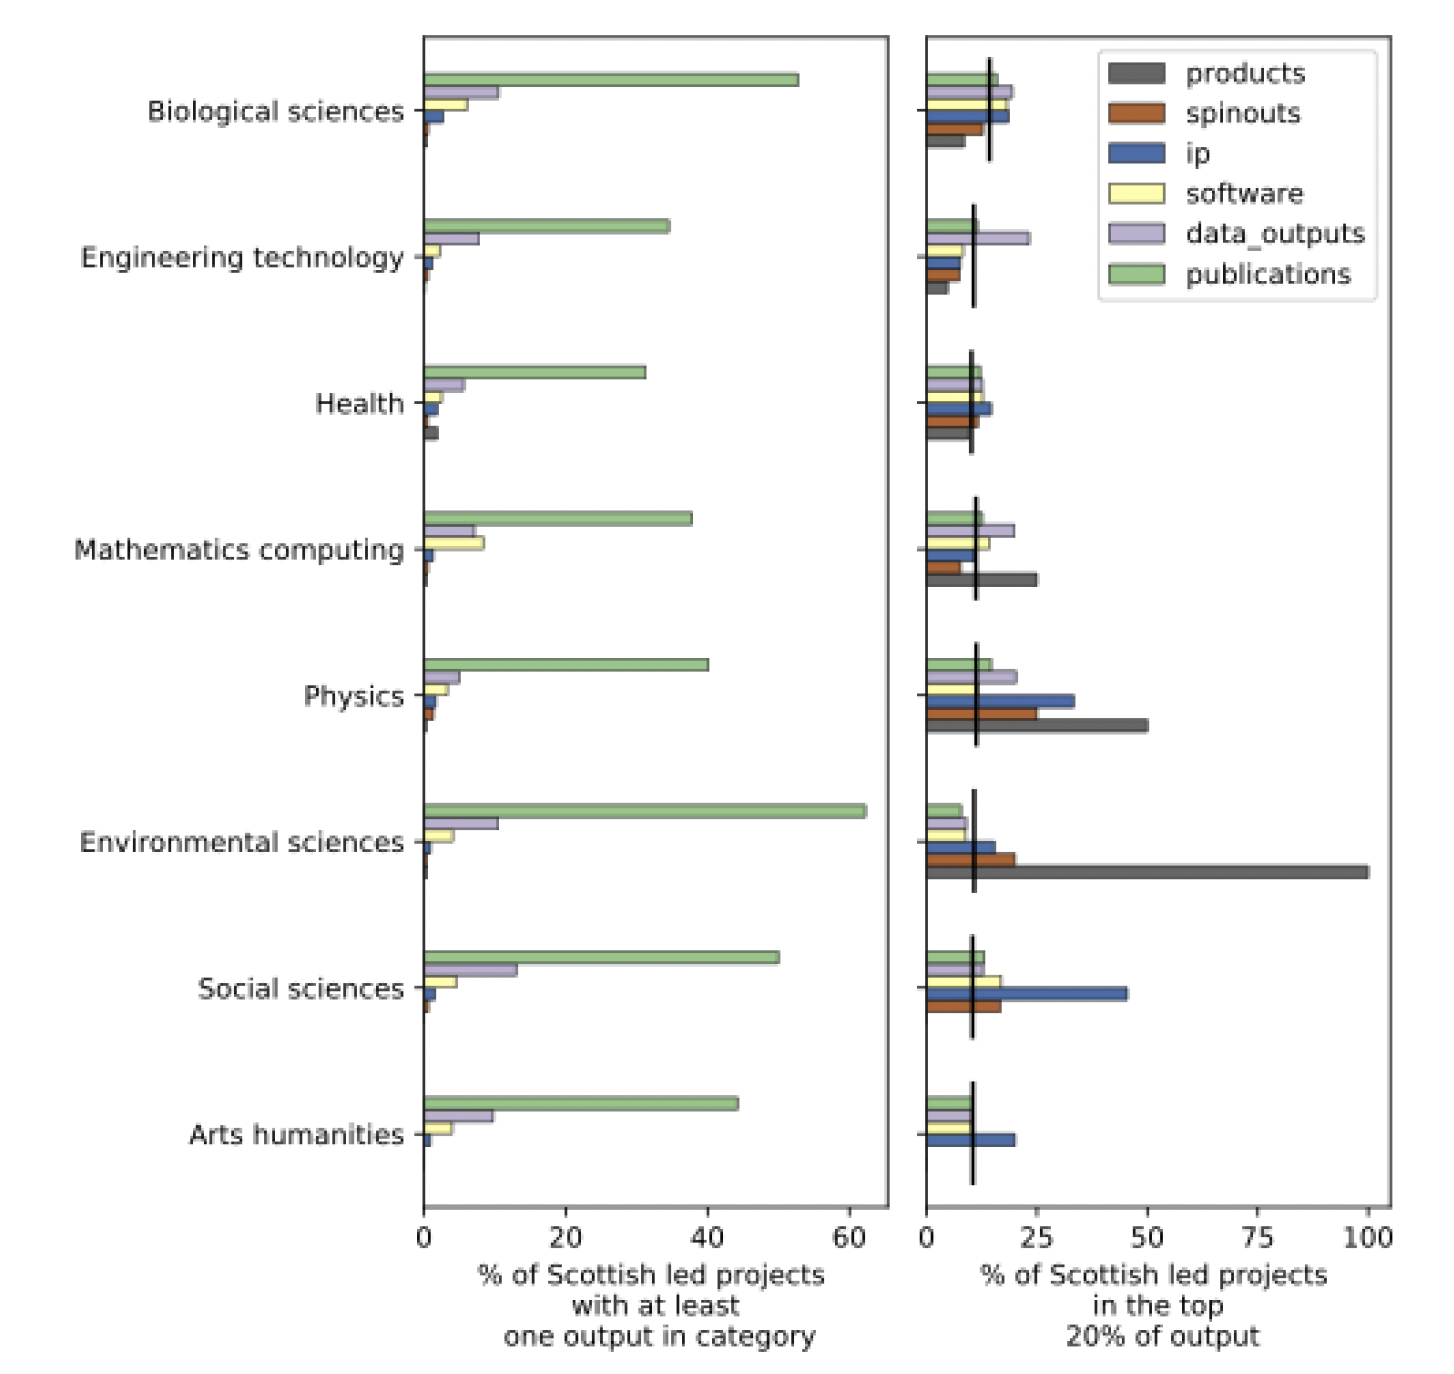
NESTA analysed research outputs from Scotland's universities and linked project data with information in the Gateway to Research about various research project outputs including academic publications, intellectual properties (including patents), technical products such as software, databases and models, products (generally health-related) and spinouts. Results are shown by discipline rather than by sector in figure 17. Difficulty in mapping subject disciplines to sectors is an issue prevalent in all of the HE data that has been assessed for this paper.
The left-hand panel shows the proportion of projects producing at least one output of each type in various disciplines – naturally publications dominate. More interesting for this piece is the right-hand panel, which focusses on the top quartile of productivity in each research output category. The vertical lines represent Scotland's share of projects in each discipline, helping us get a sense of whether Scottish projects are over or under-represented in the top productivity tier in each discipline and output category. It finds that Scottish-led projects tended to be overrepresented amongst the most productive in a variety of disciplines and categories. This was particularly visible in the following disciplines:
- Physics
- Biological Sciences
- Health
- Mathematics and Computing
Engineering and Technology projects tend to be underrepresented amongst the most productive. The spike in Environmental Science products is explained the fact that the only project in that discipline with one product output was led by a Scottish institution.
Source: NESTA
5.3.2 Higher Education Institution Competitive Research Funding Secured
Data on the proportion of competitive international research funding that Scotland's HEIs secure can provide an indication of Scotland's HEIs' relative areas of research strength on the international stage.
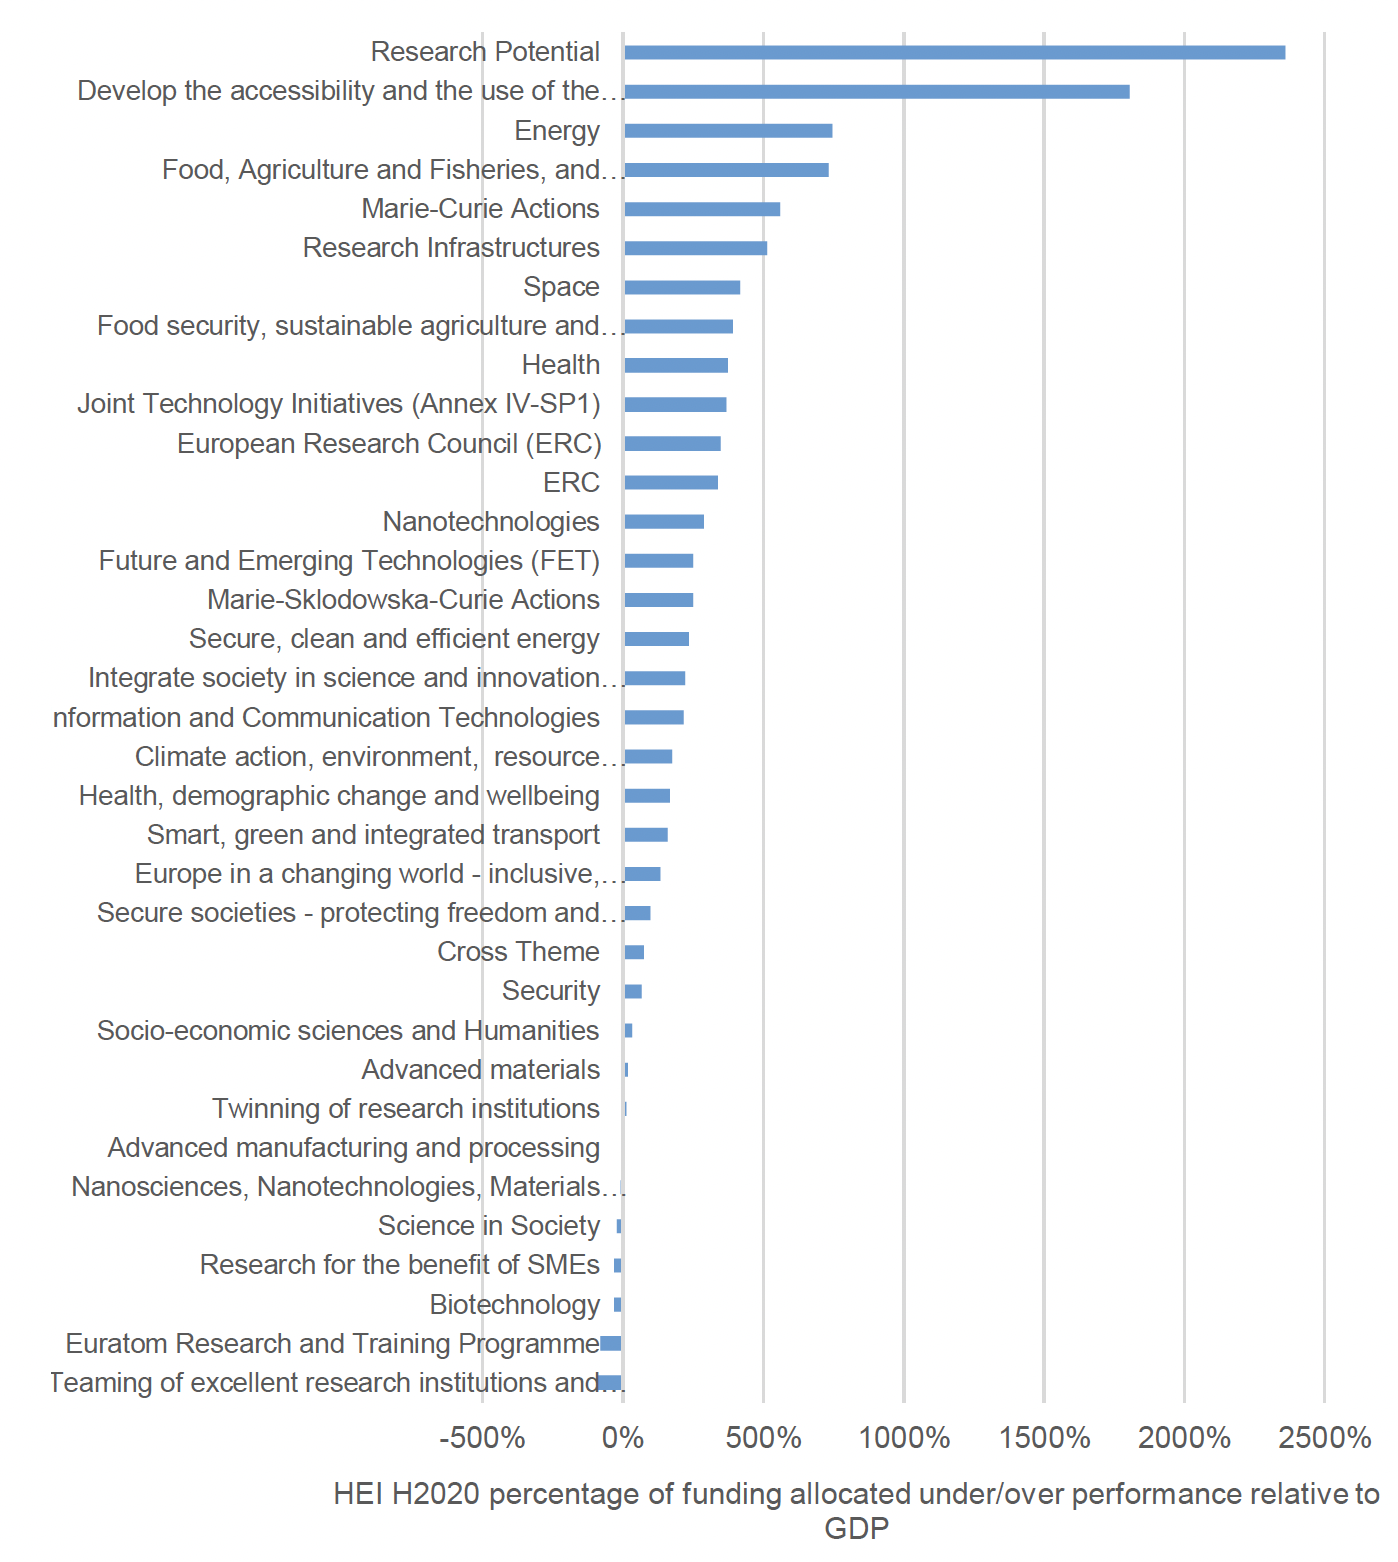
This section draws on data on funding secured by Scottish HEIs[75] from the EU Horizon 2020 programme which was the EU's research and innovation funding programme from 2014-2020 with a budget of approximately €80B, allocated via open competition to projects in EU member states. Organisations could apply for funding for projects falling within the programme's three pillars[76], each of which contained a set of 'thematic objectives' – broad subject areas considered to be a priority for innovation in the EU. Given that funding could only be secured within the EU's 'thematic objectives' areas, this analysis does not cover research across all subject areas. It does however still provide an indication of where Scotland's HEI research strengths lie.
It is important to note that whilst this analysis focuses only on Horizon 2020 funding secured by HEIs, Horizon 2020 funding could also be secured by businesses, public bodies and research organisations. Whereas HEIs accounted for around three quarters (76%) of Horizon 2020 funding secured by Scottish organisations, the proportion of funding accounted for by HEIs across the EU as a whole was much lower at 34%. This potentially skews the results of this analysis which focuses only on HEI funding, with Scottish HEIs more likely to receive a higher proportion of funding in each 'thematic objective'.
To determine the areas in which Scotland's HEIs perform comparatively strongly in securing research, for each thematic objective, funding secured by EU HEIs as whole was normalised to Scottish GDP[77] and compared with actual funding secured by Scottish HEIs. The difference between this theoretical 'Scottish expected contribution' and the observed figures for received funding was then used a measure for Scottish over/under performance when the size of the Scottish economy is taken into account. As shown in Figure 18, the results indicate that Scottish HEIs perform comparatively strongly in research in the following areas[78]:
- Energy including clean and efficient energy
- Food, agriculture and fisheries, and biotechnology
- Space
- Health
- Nanotechnologies
- Future and emerging technologies
- Information and Communication Technologies
Source: Horizon 2020 data (EU)
5.4 Summary Findings
This section has considered a range of evidence to seek to identify sectors in which Scotland currently performs strongly on innovation and where it has the potential for further growth at three tiers: business capabilities; the application of innovation into business; and higher education sector capabilities. The strongest performing sectors are selected based on the extent to which they score highly across the metrics considered in each tier.
The analysis was constrained by the lack of sufficiently disaggregated sectoral data, the lack of data on emerging sectors that are not yet an established part of Scotland's economy and the lack of sectoral data on higher education sector capabilities. The analysis therefore focused on Scotland's innovation strengths in terms of broad sectors. Despite these limitations, the analysis has provided some interesting insights on Scotland's sectoral strengths at a broader level.
- In terms of business capabilities, the evidence reviewed on sectoral R&D spending, innovation activity and investment secured indicates that Scotland's business innovation capabilities lie primarily in the following sectors: scientific R&D (part of life sciences); financial and insurance activities; professional services; architectural, engineering and technical activities; business services; and computing/ICT with strengths also in: communications; energy; food and drink; space; fin tech; and health tech.
- With regard to the application of innovation into business, the evidence reviewed on patents and business-higher education collaboration indicated that the sectors in which Scotland performs well compared to the UK are: computing/ICT; scientific R&D (part of life sciences); administrative services (part of business services); professional services and architecture; creative services; and health.
- Finally, in terms of higher education sector capabilities, the evidence reviewed on HEI research outputs and research funding secured indicated that Scotland's strengths lie primarily in the following disciplines: health; computing/ICT; energy; biological sciences; nanotechnologies and emerging technologies; and physics and space.
While the areas of strength that emerged in each strand of the analysis differ somewhat, a number of broad sectors showed strength across the tiers, as outlined in Figure 20. These are:
- Scientific R&D (part of life sciences)
- Computing / ICT
- Business Services
- Professional Services
- Architectural, engineering and technical activities
- Health
- Energy
- Emerging technologies (including fin tech, health tech and nanotechnologies)
- Space
It is important to note that data limitations have required this analysis to focus on broad sectors, that the exercise is necessarily backward looking, and that many new disruptive and radical innovations are not happening within specific sectors but rather between sectors. To identify our innovation priorities for the next ten years, our current strengths and potential must be balanced with industry insight into future opportunities and emerging markets where Scotland can claim a comparative advantage. Therefore, data analysis has been only one stage of the prioritisation exercise to identify more specific areas where Scotland has the potential to be world leading. Specifically, it has been necessary to build on this analysis with expert advice from industry, academia and the public sector.
| Sector |
Business capabilities |
The application of innovation to business |
Higher education sector capabilities |
|---|---|---|---|
| Scientific R&D (part of life sciences) |
✓ |
✓ |
✓ |
| Computing/ICT |
✓ |
✓ |
✓ |
| Financial and insurance activities |
✓ |
||
| Business services |
✓ |
✓ |
|
| Professional services |
✓ |
✓ |
|
| Architectural, engineering and technical activities |
✓ |
✓ |
|
| Creative services |
✓ |
||
| Health |
✓ |
✓ |
✓ |
| Energy |
✓ |
✓ |
|
| Emerging technologies |
✓ |
✓ |
|
| Physics and space |
✓ |
✓ |
Following this process, the final innovation priorities identify a number of opportunity areas - a mixture of vertical sector-specific priorities and complimentary horizontal underlying enabling technologies that support all verticals - of emerging excellence and in which Scotland has existing strength as pillars of our economy and a high potential for further innovation-driven scale and growth.
- Energy Transition
- Health & Life Sciences
- Data & Digital Technologies
- Advanced Manufacturing
6. Innovation Scorecard Indicators
As actions to grow and scale Scotland's innovation ecosystem over the next 10 years proceed there is a need to track performance on a number of key metrics to allow assessment of progress towards the ambition to become one of the most innovative small nations in the world.
It is proposed that this will be undertaken through an Innovation Scorecard which will track Scotland's innovation performance over time on a set of key indicators against other benchmark geographies: ideally these will be international comparators, but it must be recognised that some relevant indicators only permit comparison across UK nations and regions.
The Scorecard metrics aligns to the elements of the Innovation Ecosystem, ensuring we monitor the health of the system at each stage of each process to demonstrate Scotland's performance at different stages in the innovation journey, specifically tracking progress at three stages in the innovation system defined as the concept, convert and commercialise stages as well as tracking investment and the adoption of innovation.
- Concept – this aims to track the generation of new ideas both within universities and the private sector
- Convert – this aims to measure the movement of early-stage research towards being closer to market
- Commercialise – this aims to track the realisation of the early economic benefits of innovation
In addition, "adoption and diffusion" across the business base in general and overall research and development "investment" will be tracked.
Although it is important to recognise that there are often lengthy time lags until economic impacts emerge from new innovations, and that there is a need to factor in time to implement and deliver a new strategy, the Scorecard will provide a useful snapshot of the health of the Scottish innovation system over time.
Process
Scottish Government analysts developed a set of metrics, drawing upon commonly used data and considering existing UN and EU measurement frameworks, refining this through consultation with academic experts, NESTA and the Innovation Strategy Steering Group.
Existing frameworks
Existing innovation measurement frameworks that allow comparison with other geographies have been reviewed to assess their fit for this purpose.
The Global Innovation Index (GII) is produced annually by the World Intellectual Property Organisation (WIPO) and ranks countries' performance. It is considered to be too broad-based, tracking measures such as political stability, regulatory effectiveness, educational attainment, infrastructure and trade diversity, as well as measures that had already been considered such as BERD jobs and patents. Our own Innovation Strategy has a narrower focus on delivering business benefits; moreover, the GII does not include Scotland in its data collection.
| GII Rank | Economy | Score | Income Group Rank | Region Rank |
|---|---|---|---|---|
| 1 | Switzerland | 64.6 | 1 | 1 |
| 2 | United States | 61.8 | 2 | 1 |
| 3 | Sweden | 61.6 | 3 | 2 |
| 4 | United Kingdom | 59.7 | 4 | 3 |
| 5 | Netherlands | 58.0 | 5 | 4 |
| 6 | Republic of Korea | 57.8 | 6 | 1 |
| 7 | Singapore | 57.3 | 7 | 2 |
| 8 | Germany | 57.2 | 8 | 5 |
| 9 | Finland | 56.9 | 9 | 6 |
| 10 | Denmark | 55.9 | 10 | 7 |
Global Innovation Index | What is the future of innovation-driven growth?
The EU Regional Innovation Scoreboard – also considered in section 4 – includes data for Scotland and thus has the advantage of allowing comparison across Europe. However, it features a large number of metrics and so does not suit the desired approach which is to track progress across the ecosystem in a targeted way.
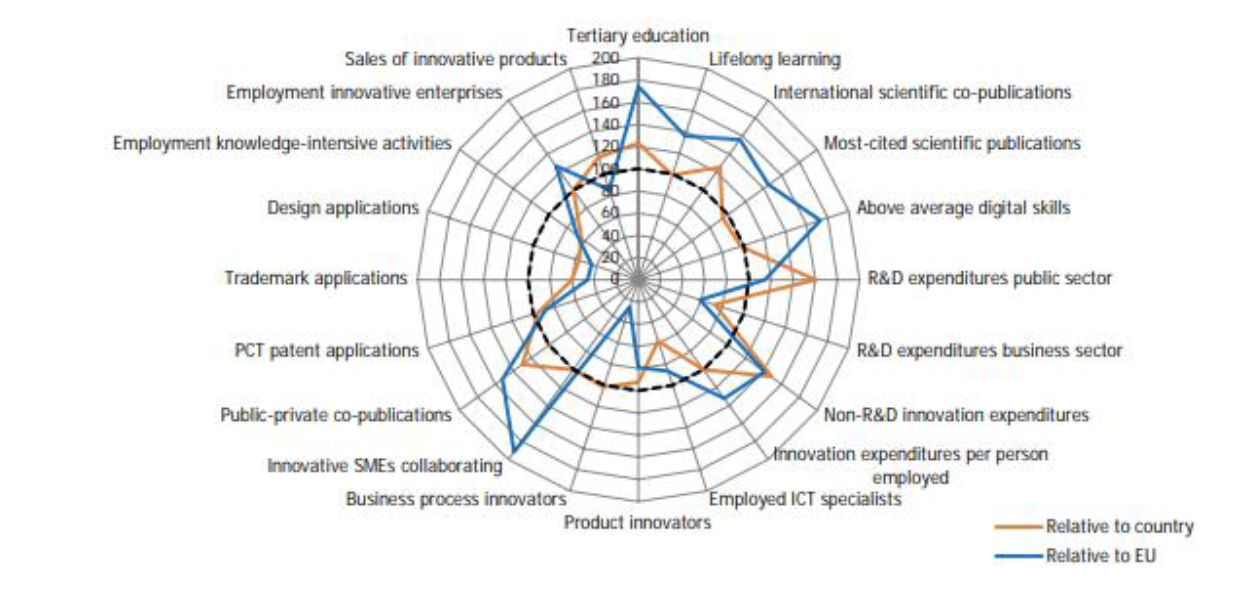
European Commission's Regional Innovation Scoreboard 2021
Alternative measurement frameworks/ techniques
This process will utilise the best and most up to date data and evidence available taking a flexible approach to the selection of metrics; if alternative effective metrics are identified in future these will be considered.
Given that much innovation activity is informal and goes "under the radar", novel techniques are being employed to capture a wider range of activity. Various techniques such as web-scraping have been used, for example, the following article measures product/ service launch: https://www.sciencedirect.com/science/article/pii/S0048733321001700.
Over time, it may be that new techniques can be employed to fill gaps not currently well served by existing indicators or to complement these, either as part of the continuing development of a Scorecard or as part of evaluation activity.
Given the focus on public sector innovation in the strategy, there will be some focus on the development of an appropriate measure, although it is recognised that this will be very difficult to achieve. The GOVERD measure
Summary of current position
Concept
- Patent citations
- Academic Income from Business and Community Interactions
Convert
- Early-stage risk capital (under £10 million)
- BERD jobs
Commercialise
- High growth firms
- Later-stage investment
Adoption and diffusion
- Innovation active businesses
Investment
- Gross Expenditure on R&D (which comprises)
- Business Expenditure on R&D
- Higher Education Expenditure on R&D and
- Government Expenditure on R&D
Description of measures
Concept
This aims to track the generation of new ideas both within universities and the private sector.
Patents – are often used to track innovation in the literature and allow for international comparison. This has weaknesses as an indicator – it is skewed towards new products; most patents are lodged speculatively and are never successfully commercialised and most innovation is not covered by such protections. However, it is widely used in the literature as a proxy for innovation and covers both private business and HE innovation.
Academic income from business and community interactions – tracks Higher Education innovation activity that is directly outward focussed. The collaborative nature of the measure is attractive as is the fact that it includes financial commitment which signifies anticipated value.
Convert
This measures the movement of early-stage research to being closer to market.
Early-stage risk capital – the attraction of investment capital in deals below £10 million is a good indicator of innovation that is closer to market, by way of "following the money". Although not all deals are strictly innovation driven, this a sufficiently good proxy for innovation at this stage because the top sectors for deals are generally those associated with innovation:
- Digital and IT
- Business Services
- Technology and Engineering
And to a lesser extent:
- Energy including renewables
- Food and drink
- Life sciences
BERD jobs – measure the number of workers in the private sector employed in R&D activities. These people are likely to be directly engaged in new innovation with an eye to market or in making existing ideas marketable. Though absolute job numbers are relatively small there will be associated employment multipliers (additional jobs within the companies and their supply chains which will typically offer relatively high wages).
Commercialise
This tracks the realisation of the early economic benefits of innovation.
High growth companies – these generate disproportionate jobs and innovation and are seen as key to economic transformation. Again these are not necessarily innovation driven but will disproportionately be in innovative sectors. Though these are difficult to measure as their growth tends to be episodic, the agreed (OECD) definition is of firms growing their employment numbers and/or turnover by more than 20% a year over a period of three years, with at least 10 employees at the start of the period. This three-year period may present issues given that Covid-19 impacts will be seen for a number of years, affecting comparisons where there are differences between Scotland and other parts of the UK in the sectoral composition of high growth firms.
Later stage investment – equity deals at £10 million and above provides strong evidence of commercialisation which is closer to market.
Adoption and diffusion
Every business or organisation should have the opportunity to adopt innovation. Innovation should be accessible to all, not just those businesses working at the cutting edge
Along with BERD, measures drawn from the Community Innovation Survey provide key metrics for private sector innovation, particularly the percentage of innovation active businesses. The overall measure covers both product and process innovation. This measure allows for international comparison.
Investment
Gross expenditure on R&D covers such expenditure from business, higher education and government combined and is a reasonable proxy for overall investment. When expressed as a percentage of GDP this allows for international and cross-UK comparisons.
The baseline scorecard, figure 22, is shown on the next page.
| Ecosystem |
Tracking |
Metrics Used in Scorecard |
Current Performance |
Comparison |
Progress Since Last Year |
|---|---|---|---|---|---|
| Concept |
|
|
|
|
|
| Convert |
|
|
For deals under £10M, £305 million was invested across 440 deals in 2020, this is down 5% over 2019. BERD Jobs made up 0.61% of the total Scottish 16-64 labour force in 2020, up from 0.56% in 2019. |
|
|
| Commercialise |
|
|
|
|
|
| Adoption |
|
% of innovation active businesses |
|
|
|
| Investment |
|
|
|
|
|
Contact
Email: Innovation@Gov.Scot